
US CPI Report: Release Dates, Latest Inflation, Market Impact


Contents
- US CPI report in 30 seconds
- What is the US CPI report?
- When is the next CPI report? Release dates 2026 and 2027
- What is the US inflation rate now? The October 2026 report
- Core CPI, energy and shelter: the parts that matter
- Why the CPI report moves markets
- How traders handle CPI day
- CPI, PPI and PCE: how they differ
- Conclusion: core CPI beats the headline
- Frequently asked questions about the US CPI report
- About the author
Few numbers move interest rate expectations as directly as the monthly US consumer price index, the CPI. If inflation comes in higher than expected, the dollar tends to rise and gold and stock index futures come under pressure. If it comes in lower, the picture can turn within seconds.
This guide gives you every CPI release date to the end of 2027 in New York, UK and central European time, the latest figures straight from the Bureau of Labor Statistics, and what sits behind the headline. I explain why core CPI often matters more than the headline, how CPI differs from PPI and PCE, and how I handle CPI day after trading since 1980. This article follows our editorial policy.
US CPI report in 30 seconds
The key points as of 18 November 2026:
- Next release: Thursday, 10 December 2026, at 8:30 a.m. ET (1:30 p.m. UK time, 2:30 p.m. CET), with the data for November. It comes one day after the Fed decision of 9 December.
- Latest figures: in October 2026 prices rose 0.4% on the month and core prices 0.3%, seasonally adjusted. There is no official 12-month rate for headline or core CPI in October, because prices for October 2025 were never collected.
- Last official annual rate: 3.7% in September 2026, with core CPI at 2.6%. Energy was up 20.4% on the year.
- Why it matters: next to the jobs report, CPI is the most important monthly date for Fed rate expectations. The dollar, gold, Treasuries and index futures react at once.
- Good to know: CPI figures are final when released. The Fed’s official 2% target, however, refers to the PCE price index, not to CPI.
What is the US CPI report?
The US CPI report is the monthly consumer price release of the Bureau of Labor Statistics (BLS), published at 8:30 a.m. Eastern Time around the middle of the month.
The consumer price index (CPI) measures the average change in the prices that consumers pay for a fixed basket of goods and services in the United States.
The basket covers what people buy every day, from rent and gasoline to groceries, doctors and restaurant meals. According to the BLS, prices are collected each month in 75 urban areas from about 6,000 housing units and 22,000 retail and service establishments. Taxes linked to a purchase are included.
The headline number refers to the CPI-U, the index for all urban consumers. It represents over 90 percent of the US population. A second index, the CPI-W for urban wage earners and clerical workers, covers about 30 percent of the population.
One feature sets CPI apart from most other US data: the figures are final when released. The BLS states in the technical note of its release that the CPI-U and CPI-W “are considered final when released”. Only the seasonally adjusted values are recalculated each February, for the past five years. Unlike the jobs report, there are no monthly revisions of the unadjusted index.
When is the next CPI report? Release dates 2026 and 2027
The next CPI report comes out on Thursday, 10 December 2026, at 8:30 a.m. ET, with the data for November. Unlike the jobs report there is no “first Friday” pattern: the weekday changes from month to month. All dates below come from the official BLS release schedule, checked on 18 November 2026.
| Data for | Release (8:30 a.m. ET) | UK / central Europe |
|---|---|---|
| November 2026 | Thu, 10 Dec 2026 | 1:30 p.m. / 2:30 p.m. |
| December 2026 | Wed, 13 Jan 2027 | 1:30 p.m. / 2:30 p.m. |
| January 2027 | Thu, 11 Feb 2027 | 1:30 p.m. / 2:30 p.m. |
| February 2027 | Wed, 10 Mar 2027 | 1:30 p.m. / 2:30 p.m. |
| March 2027 | Tue, 13 Apr 2027 | 1:30 p.m. / 2:30 p.m. |
| April 2027 | Wed, 12 May 2027 | 1:30 p.m. / 2:30 p.m. |
| May 2027 | Thu, 10 Jun 2027 | 1:30 p.m. / 2:30 p.m. |
| June 2027 | Wed, 14 Jul 2027 | 1:30 p.m. / 2:30 p.m. |
| July 2027 | Wed, 11 Aug 2027 | 1:30 p.m. / 2:30 p.m. |
| August 2027 | Tue, 14 Sep 2027 | 1:30 p.m. / 2:30 p.m. |
| September 2027 | Thu, 14 Oct 2027 | 1:30 p.m. / 2:30 p.m. |
| October 2027 | Wed, 10 Nov 2027 | 1:30 p.m. / 2:30 p.m. |
| November 2027 | Fri, 10 Dec 2027 | 1:30 p.m. / 2:30 p.m. |
Watch the clock change if you trade from outside the United States. In the weeks when only the US or only Europe is on summer time, CPI reaches London and Frankfurt one hour earlier. On 11 March 2026 that happened: the report came at 12:30 p.m. UK time and 1:30 p.m. CET. None of the dates up to the end of 2027 falls into such a gap, because the US switches on 14 March and 7 November 2027, the UK and the EU on 28 March and 31 October.
Even the calendar itself is not guaranteed. During the US government shutdown of autumn 2025, the BLS did not collect any price data for October 2025, so there was never a CPI for that month. That gap still matters today, as the next section shows. All upcoming US dates, including the Fed and the jobs report, are collected in our economic calendar.
What is the US inflation rate now? The October 2026 report
In October 2026 consumer prices rose 0.4% on the month, seasonally adjusted, after 0.6% in September. Core prices, without food and energy, rose 0.3%, as they did in September and August. These are the official figures from the BLS release of 10 November 2026:
- Shelter: +0.3%, accounting for over thirty percent of the monthly increase.
- Energy: +0.7%, after a 5.2% jump in September; gasoline was up 37.4% on the year.
- Food: +0.5%, with food at home +0.4% and food away from home +0.5%.
- Falling: used cars and trucks (-1.2%) and communication (-0.1%).
For October 2026, the BLS publishes no 12-month rate for headline or core CPI. Because no prices were collected in October 2025, the BLS “cannot publish 12-month percent changes for October 2026 for indexes where October 2025 data are unavailable”. A few components still have an annual rate, such as gasoline above. The last official annual rate is therefore 3.7% for September 2026, with core CPI at 2.6%. The 12-month rate returns with the November data on 10 December 2026.
The comparison month is simply missing, so any annual October figure you see elsewhere is not an official BLS number. The BLS describes a way to approximate missing index values for contracts, but says that percent changes based on such values are unofficial estimates, as explained on its page on approximating missing data.
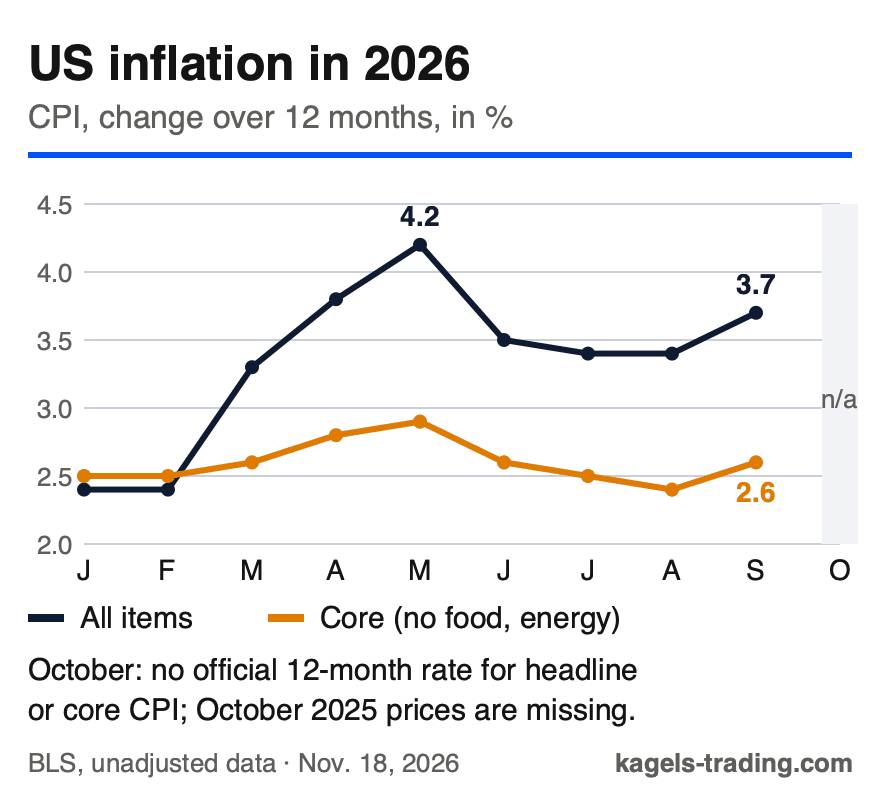 Click to enlarge
Source: Bureau of Labor Statistics, CPI-U not seasonally adjusted, retrieved 18 November 2026.
Behind the annual rate lies an eventful year. In spring 2026 inflation picked up sharply: the 12-month rate rose from 2.4% in February to 4.2% in May. The main driver was energy, which was up more than 20% on the year in May and again in September. Core inflation moved much less, between 2.4% and 2.9%, so a large part of the headline inflation was an energy story.
Be careful with secondary sources. Finance portals sometimes show different values because they use their own conversions, or a 12-month figure for October that the BLS has not published. For trading, the official BLS figure counts, because market expectations are calibrated to it.
Core CPI, energy and shelter: the parts that matter
Core CPI measures price changes without the volatile prices of food and energy.
Professionals look at core CPI first, not at the headline. Energy and food prices swing with the oil price and harvests and say little about the underlying trend. Core CPI shows whether inflation is settling in services and rents, where the Fed’s rate policy really works. In September 2026, a 3.7% headline stood next to 2.6% core.
Shelter is the heavyweight of the index. It includes rent and owners’ equivalent rent, an estimate of what homeowners would pay to rent their own home. Because rents adjust slowly, shelter keeps CPI high for months after market rents have cooled.
Disinflation means a falling inflation rate: prices still rise, just more slowly than before.
This difference decides how markets read the number. If the annual rate falls from 3.7% to 3.5%, goods in the shop do not get cheaper; price growth only slows down. For markets, this kind of disinflation is often enough to price out further rate rises.
Why the CPI report moves markets
Price stability is one half of the Fed’s dual mandate; maximum employment is the other. Rising inflation argues against rate cuts and for rate rises, falling inflation the other way round. In 2026 this is not theory: the Fed raised rates in September and held them at 3.75% to 4.00% in October. That is why rate markets adjust their expectations for the next Fed rate decision right after the CPI, which you can follow in the CME FedWatch Tool.
The typical chain after a higher-than-expected number: the dollar strengthens, EUR/USD falls, gold suffers from higher expected real yields, and stock indices drop. A lower-than-expected number reverses the chain. Our EUR/USD forecast and gold price forecast show where these markets stand, and the S&P 500 forecast covers the index side.
What counts is never the absolute number, but the gap to the consensus forecast. An inflation rate of 3.7% is bullish for stocks if 3.9% was expected, and bearish if the consensus was 3.5%. Then comes the second look at core CPI: if it misses in the other direction than the headline, the first price move is often corrected on the same day.
Treasuries price new inflation figures fastest: their yields often jump before stocks and currencies react. How large such jumps are expected to be shows in the MOVE Index, which tracks the expected volatility of US rates. Our interest rate forecast covers the Fed path and the 10-year yield.
How traders handle CPI day
At 8:30 a.m. ET the US stock market is still closed, so the numbers hit the pre-market. The first reaction runs through index futures, bonds and the currency market; how this phase works is explained in our guide to pre-market and after-hours trading. In the minute of the release, the same rules apply as for every big data release: spreads widen, market and stop orders get worse fills, and the first move often runs in both directions.
Headline and core CPI can point in different directions, just as the components of the jobs report can. A friendly headline with a sticky core rate is no all-clear, and markets sometimes need half an hour to sort that out. So it pays to note both consensus values before the release and to judge the reaction only when both surprises are clear. The other big monthly date is covered in our guide to nonfarm payrolls.
In December 2026 the order is unusual: the Fed decides on 9 December, and the November CPI follows the next morning. The November CPI will not be publicly available when the Fed announces its decision, so markets will read it as a test of whatever the Fed said. Expect a busy two days.
I treat CPI day in my trading preparation exactly like the jobs report. The date and the consensus are clear to me in the morning, and I do not open a new position just before the release. After the numbers, the market tells me quickly enough where it wants to go. I do not need to be in the first, wildest minute.
CPI, PPI and PCE: how they differ
The producer price index (PPI) measures the prices that US producers receive and is read as an early hint of future consumer prices.
The BLS publishes the PPI in the same window as the CPI, sometimes before it, sometimes after. The October 2026 PPI came on 13 November, three days after the CPI; the November PPI follows on 15 December, five days after it, according to the BLS PPI schedule. Rising producer prices pass into consumer prices with a delay, which is why traders read the two reports as a pair.
The PCE price index measures the prices of what US households actually spend, and it is the index behind the Fed’s 2% target.
The Fed’s official inflation goal is 2 percent, “as measured by the annual change in the price index for personal consumption expenditures”, not CPI. That is how the Federal Reserve puts it. PCE is published by the Bureau of Economic Analysis (BEA) about two weeks after the CPI: the October data on 25 November 2026 and the November data on 23 December 2026, according to the BEA release schedule. PCE takes into account that consumers switch to cheaper products when prices jump, and it usually runs a little below CPI. For markets, CPI is still the more important date, because it comes first and sets the direction.
Conclusion: core CPI beats the headline
Next to the jobs report, the US CPI report is the second big fixed date in a trader’s month. It helps decide how the Fed thinks about rates, and with that the direction of the dollar, gold and indices. The date belongs in every trading calendar, even if you deliberately do not trade it.
My assessment from almost five decades in the markets: the headline inflation number is the loudest, but not the most important number of the day. Anyone who looks only at the headline misses what core CPI and the reaction of the rate markets are saying. After the release, I wait until headline, core and expectations have sorted themselves into one picture. Only then is CPI day tradable for me.
Your next step: put 10 December 2026 into your calendar, together with the Fed decision the day before. On that morning, the 12-month rate is back, and the market will compare it with the last official 3.7% and with the consensus.
Frequently asked questions about the US CPI report
When is the next CPI report?
The next CPI report comes out on Thursday, 10 December 2026, at 8:30 a.m. ET, with the data for November. The weekday changes from month to month; the binding source is the BLS release schedule. All dates to the end of 2027 are in the table above.
What time is the CPI released?
The BLS publishes CPI at 8:30 a.m. Eastern Time. That is normally 1:30 p.m. in London and 2:30 p.m. in central Europe. In the short clock-change gaps in March and around the end of October, it is one hour earlier in Europe.
What is the current US inflation rate?
The last official 12-month rate is 3.7% for September 2026, with core CPI at 2.6%. For October 2026 the BLS publishes no annual rate for headline or core CPI, because October 2025 prices were not collected; prices rose 0.4% on the month. The annual rate returns on 10 December 2026.
What is the difference between CPI and core CPI?
CPI measures the price change of the whole basket, core CPI leaves out food and energy. Because these two parts swing strongly, core CPI is seen as the better measure of the underlying trend.
Why does the Fed look at PCE instead of CPI?
The Fed’s 2% target refers to the PCE price index, because it covers what households actually spend and reflects how they switch between products. For markets, CPI is still the more important date, because it comes about two weeks earlier.
Are CPI figures revised?
The unadjusted CPI figures are final once they are published. Only the seasonally adjusted values are recalculated each February, for the past five years. That sets CPI apart from the jobs report, whose monthly figures are revised twice.
This English edition is based on our German edition on kagels-trading.de and has been adapted for international readers.
More Central Banks guides
- Follow the US dollar
Fed Interest Rate Decision 2026: Dates, Rate and Outlook
Every FOMC date, the latest decision and dot plot, and how much a Fed decision moves markets.
- Follow the euro
ECB Interest Rate Decision 2026: Dates and Latest Decision
Current ECB rates, every meeting date with times and what traders should watch.
- Follow the yen
BoJ Interest Rate Decision: Dates, Times and Japan's Rate
Bank of Japan meeting dates to the end of 2027 and how much the yen and the Nikkei move on BoJ days.
- Follow the British pound
Bank of England Interest Rate Decision: Dates and Times
Every MPC date to the end of 2027 with times, the named votes of 2026 and how much EUR/GBP moves on BoE days.
- Follow the Swiss franc
SNB Interest Rate Decision: Dates, Times and the Swiss Franc
SNB meeting dates to the end of 2027 with times, the latest decision and how much the franc moves on SNB days.
- Follow the Canadian dollar
Bank of Canada Interest Rate Decision: Dates and Times
Bank of Canada dates with times in New York and Europe, the latest decision and how much USD/CAD moves after BoC days.
- Follow the Australian dollar
Next RBA Meeting 2026: Decision Dates, Times and the Aussie
RBA dates with the Monday-evening times in New York, the 2026 votes and how much the Australian dollar moves.
- Read Fed expectations
CME FedWatch Tool Explained: Forecasting Fed Rate Decisions
How FedWatch turns futures prices into rate probabilities, and how accurate it has been.
- Trade around the jobs report
Nonfarm Payrolls (NFP): Release Dates and What They Mean
Every NFP release date to the end of 2027 in ET, UTC and CET, the latest figures, revisions and how markets react.
- Read US growth in real time
Atlanta Fed GDPNow: How Accurate Is the GDP Nowcast?
How the Atlanta Fed's GDPNow estimates current GDP growth, and how far it has missed since 2011.