
Day Trading Strategies: Rules, Examples and When to Skip


Contents
- Day trading strategies in 30 seconds
- Strategy, setup and signal: three different things
- Three approaches compared
- The test bed: five SPY sessions, rules fixed first
- Win case: a trend pullback on 19 October 2026
- Loss case: an opening range breakout on 19 October 2026
- No-trade case: a range fade skipped on 19 October 2026
- How to choose your first approach
- Common mistakes when choosing a strategy
- Frequently asked questions about day trading strategies
- About the author
A day trading strategy is a written rule set, not a single signal. It says which market phase you trade, what triggers the entry, where the trade is wrong, how you exit and when you do nothing. This guide compares three common approaches, the opening range breakout, the trend pullback and range trading, and uses VWAP as a filter. It applies all three to the same five SPY sessions and shows one win, one loss and one skipped trade. It is educational, not investment advice, and follows our editorial policy.
Day trading strategies in 30 seconds
- Strategy, setup and signal are different things: the strategy is the full rule set, the setup is one situation that meets it, the signal is the moment that triggers the entry.
- Three families cover most beginner needs: the opening range breakout for the first hour, the trend pullback for a directional day, the range fade for a sideways day.
- VWAP works best as a filter: it tells you which side the session average favours; touching it is not a strategy on its own.
- Every rule set needs a no-trade rule: skipped trades protect the account as much as stops do.
- Five sessions prove nothing: the examples below show how the rules work, not how often they win.
Strategy, setup and signal: three different things
Most beginner confusion starts with mixing these three words. A clear vocabulary makes your journal useful later.
| Term | What it is | Example |
|---|---|---|
| Strategy | The complete written rule set | Trend pullback to VWAP, 10:00 to 12:00 ET, 2R target |
| Setup | One situation that meets the strategy’s conditions | Price above a rising VWAP pulls back and touches it |
| Signal | The exact trigger for the entry | The next bar closes above the pullback bar’s high |
A signal without a strategy is a guess. If you cannot say in advance where the stop goes, what the exit is and when you skip, you are trading a chart pattern, not a plan. The broader question of whether day trading suits you is in our day trading guide.
Three approaches compared
Each approach fits a different market phase, so the first decision is which phase you are looking at. The table compares the rule sets used in the examples below.
| Opening range breakout | Trend pullback | Range fade | |
|---|---|---|---|
| Market phase | First move after the open | Directional day | Sideways day |
| Trading window (ET) | Signal bars 9:45 to 11:50 | Pullback bars 10:00 to 11:50 | Signal bars 10:30 to 13:55 |
| Entry trigger | Bar closes beyond the 15-minute range | Bar closes beyond the pullback bar after a VWAP touch | Bar breaks the first-hour range and closes back inside |
| Stop | Opposite range boundary | Pullback bar extreme | Signal bar extreme plus $0.10 |
| Exit | 2R target or 3:55 p.m. | 2R target or 3:55 p.m. | VWAP or 3:55 p.m. |
| VWAP filter | Signal must close on the trade side of VWAP | VWAP must slope in the trade direction over 30 minutes | VWAP must stay within 0.15% from 10:00 to 10:30 |
| No-trade when | First signal is on the wrong side of VWAP | No touch and confirmation in the window | VWAP not flat, or target less than 1R away |
| Main cost risk | Wide range means a wide stop | Many small stops on choppy days | Small targets, so costs weigh more |
R is the risk unit used in every result below. One R is the distance from entry to stop. A 2R target sits twice that distance away in the trade direction. Results in R make trades with different stop sizes comparable.
Opening range breakout
The opening range breakout trades the first decisive move after the open. You mark the high and low of the first 15 minutes, wait for a 5-minute bar to close beyond them and enter at the next bar’s open. The stop sits at the opposite boundary. The full method, window choices and two worked SPY days are in our guide to the opening range breakout. Here, a VWAP filter is added: a long signal must close above VWAP, a short signal below it.
Trend pullback
The trend pullback waits for a directional day to pause, then joins the trend. The context is price above a rising VWAP for a long, or below a falling VWAP for a short. The setup is a bar that touches VWAP but closes on the trend side; the signal is the next bar closing beyond that bar’s high or low. The stop sits at the pullback bar’s extreme. How to tell a pullback from a possible reversal is in our guide to pullback trading, which uses daily charts; the logic is the same on intraday bars.
Range fade
The range fade bets that a sideways day stays sideways. The first trading hour sets a range. If VWAP has stayed flat (within 0.15% between 10:00 and 10:30 a.m.), a bar that pokes beyond the range and closes back inside is the signal to trade back toward VWAP. If the reward to VWAP is smaller than the risk, the rule says skip. Boundaries, order types and two longer-term SPY fades are in our guide to range trading.
VWAP: a filter, not a fourth strategy
VWAP is the volume-weighted average price since the open. It is useful as a reference: above a rising VWAP, buyers have paid up on average; below a falling one, sellers have. In the three rule sets it only filters direction or market phase. A rule like “buy every VWAP touch” lacks a stop, an exit and a no-trade condition. The formula and settings are in our guide to the VWAP indicator.
The test bed: five SPY sessions, rules fixed first
The rules were written down before they were applied to the data. The full specification, the evaluation script and the result file are kept with this article. This is a demonstration on five sessions, not a backtest.
- Instrument and data: SPY (S&P 500 ETF), 5-minute bars, US regular session 9:30 a.m. to 4:00 p.m. ET, time zone America/New_York, from Interactive Brokers delayed quotes. Sessions: 19 to 23 October 2026.
- VWAP: computed from the 5-minute bars (typical price times volume, cumulative from 9:30). A tick-based VWAP on your platform can differ slightly.
- Entry: at the open of the bar after the signal bar; one trade per rule set and day; no re-entry.
- Exit: stop, target or the open of the 3:55 p.m. bar. If one bar touches both stop and target, the stop is recorded.
- Costs: results are shown gross and net of an assumed $0.03 per share round trip for commission, spread and slippage. That is an assumption for illustration, not a broker quote.
One known bias is disclosed here. Our ORB guide had already shown two of these sessions. That is why all three rule sets run on all five days and every result appears in the table below. The cases shown in charts were picked by a fixed rule: the first target, the first stop and the first filter-based no-trade in date order.
| Date | Opening range breakout | Trend pullback | Range fade |
|---|---|---|---|
| 19 Oct | Short, stop: −1.00R (−1.02R net) | Long, target: +2.00R (+1.97R net) | No trade: target less than 1R |
| 20 Oct | Long, target: +2.00R (+1.99R net) | Long, stop: −1.00R (−1.03R net) | No trade: VWAP not flat |
| 21 Oct | Short, stop: −1.00R (−1.01R net) | No trade: no signal | Short, stop: −1.00R (−1.04R net) |
| 22 Oct | Short, target: +2.00R (+1.98R net) | No trade: no signal | Long, target: +1.80R (+1.77R net) |
| 23 Oct | Long, stop: −1.00R (−1.02R net) | No trade: no signal | No trade: target less than 1R |
Do not read a win rate into this grid. Five sessions in one calm week are far too few, and a different week could reverse every column. The value of the grid is that it shows how often each rule set does nothing, and that losses and wins follow the same rules.
Win case: a trend pullback on 19 October 2026
 Click to enlarge
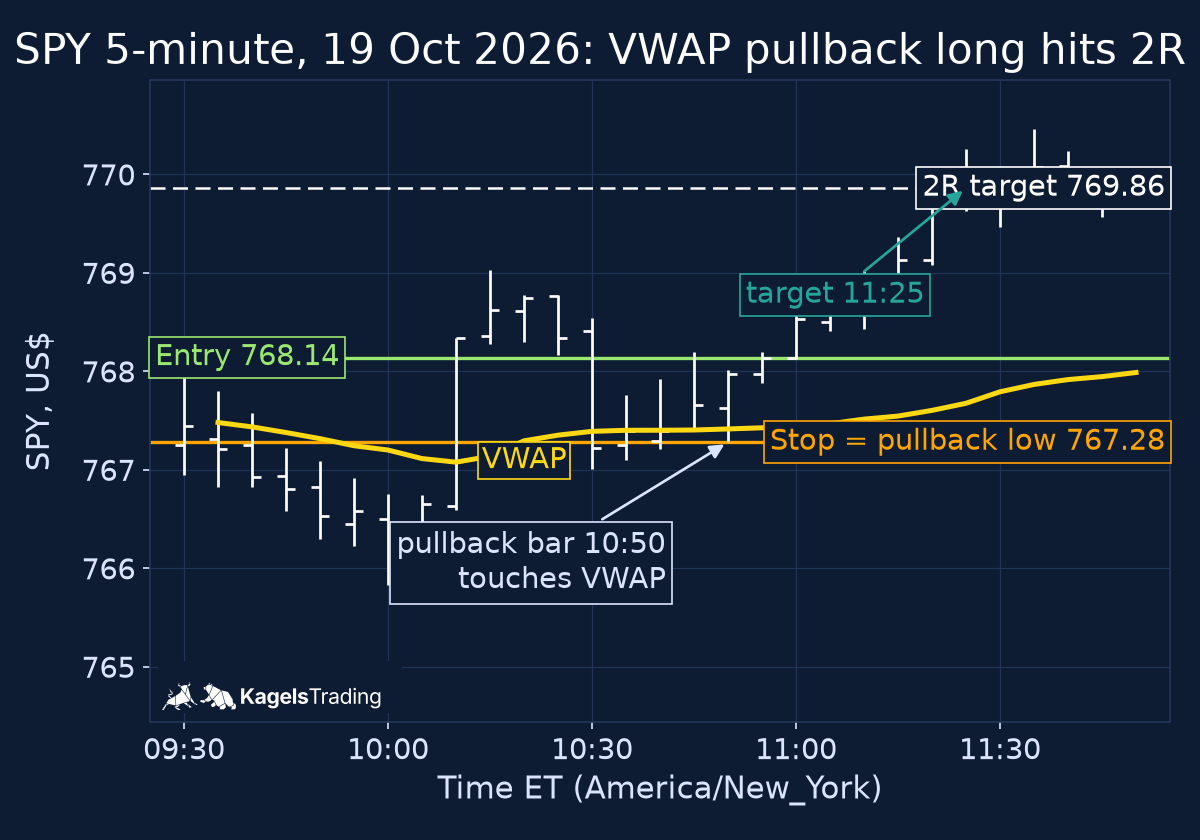
The trend pullback took a long trade that reached its 2R target. After a weak start, SPY climbed back above VWAP and VWAP turned up. The 10:50 bar dipped to VWAP and closed above it; the next bar closed above that bar’s high, so the model entered at the 11:00 open.
| Field | Value |
|---|---|
| Pullback bar (10:50) low | 767.28 |
| Signal bar closed (11:00) | 768.14 |
| Model entry (11:00 open) | 768.14 |
| Stop | 767.28 |
| Risk per share (1R) | 0.86 |
| 2R target | 769.86 |
| Outcome | target reached during the 11:25 bar, +2.00R gross, +1.97R net |
A win does not prove the rule. With a $50 risk budget, 0.86 per share allows 58 shares; the target would add about $99.76 before costs. The same rule set lost the next day, as the grid shows.
Loss case: an opening range breakout on 19 October 2026
 Click to enlarge
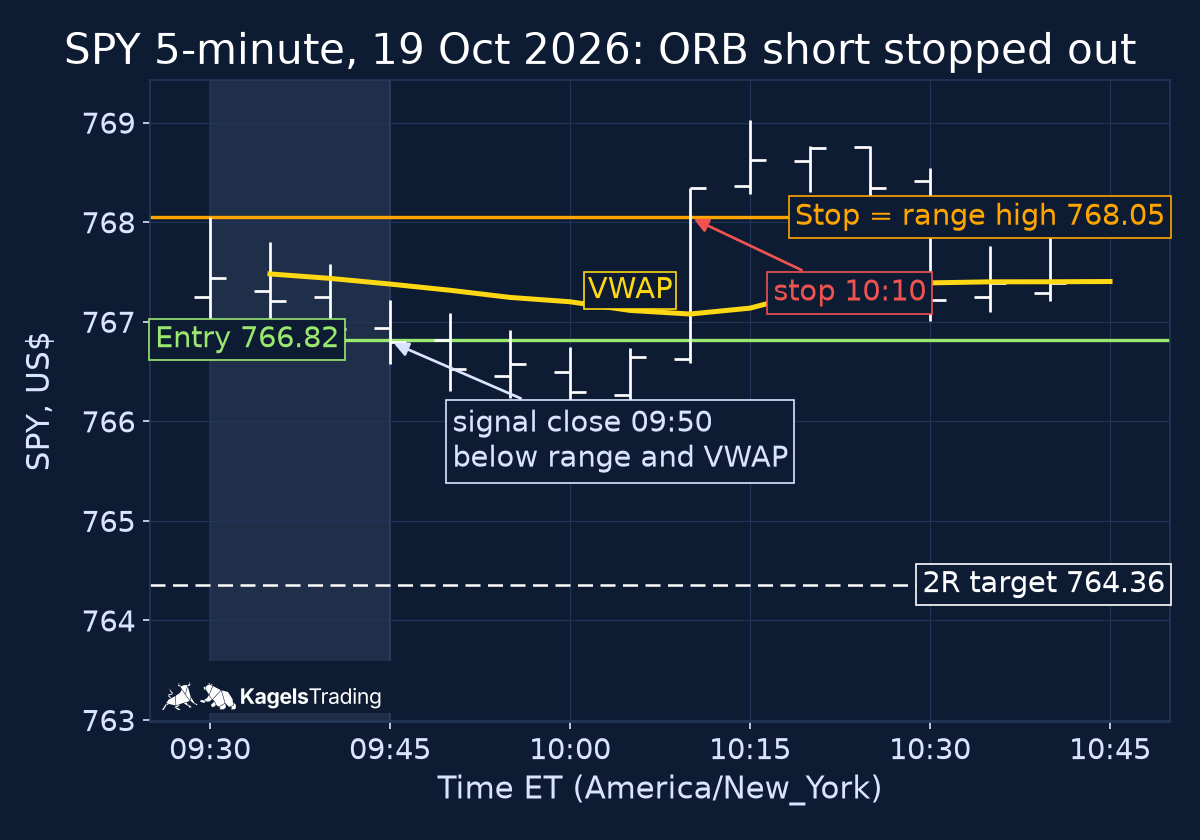
The same morning, the opening range breakout went short and was stopped out. The 15-minute range ran from 766.82 to 768.05. The 9:45 bar closed at 766.80, below the range and below VWAP, so the filter allowed a short. The model entered at the 9:50 open of 766.82; at 10:10 the price rose through the stop at the range high.
| Field | Value |
|---|---|
| Range high / low | 768.05 / 766.82 |
| Signal bar closed (9:50) | 766.80 |
| VWAP at the signal close | 767.32 |
| Model entry (9:50 open) | 766.82 |
| Stop | 768.05 |
| Risk per share (1R) | 1.23 |
| Outcome | stop crossed during the 10:10 bar, −1.00R gross, −1.02R net |
The loss followed the rules, and that is the point. A loss inside the plan is a cost of the method; a loss from a moved stop is a discipline problem. Note one detail: the entry opened exactly at the range low. Our ORB guide, linked above, uses a stricter rule that skips an entry opening on the boundary, so it would not have traded this day. Small rule differences change results, which is why you write them down first.
No-trade case: a range fade skipped on 19 October 2026
 Click to enlarge
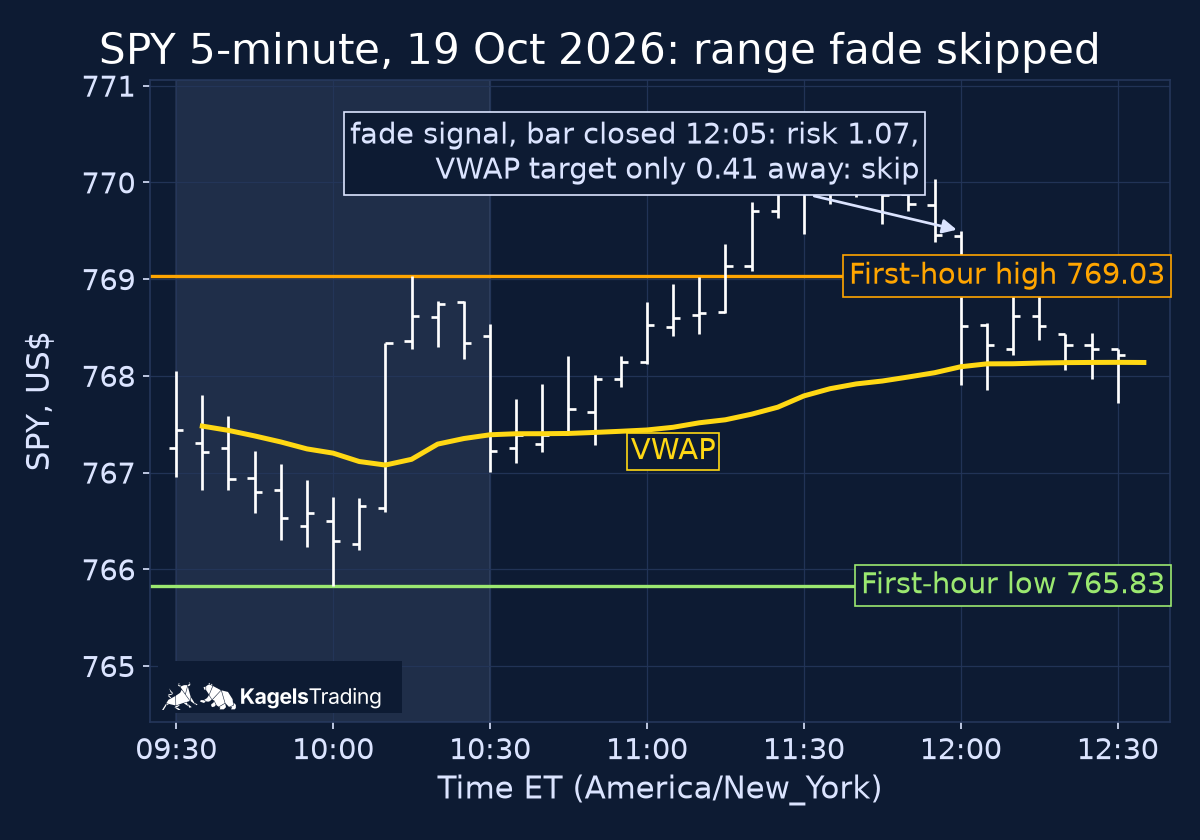
The range fade found a signal at noon but the rule said skip. VWAP had stayed almost flat between 10:00 and 10:30 a.m. (a change of 0.025%), so the day qualified as a range candidate. The 12:00 bar broke above the first-hour high of 769.03 and closed back inside. A short would have entered at 768.53 with a stop at 769.60, a risk of 1.07. VWAP, the target, was only 0.41 away.
Paying 1.07 to make 0.41 fails the rule. The no-trade condition exists for exactly this case: the market had drifted up, so VWAP sat close to the entry. Skipping is a decision, and it belongs in the journal like a trade. Our trading journal guide shows how to record skipped setups.
How to choose your first approach
Choose by the time you can trade and the market phase you can recognise, not by the last winning chart. Each approach has a natural home in your schedule.
- You can watch the morning closely: the opening range breakout fits, because its signals come before noon. An open trade still has to be managed until the stop, the target or 3:55 p.m.; on 22 October the ORB trade entered at 10:15 and reached its target at 2:00 p.m. If you cannot watch, use a bracket order with stop and target, or test a first-hour-only exit as a separate rule.
- You recognise trends and can wait: the trend pullback fits, but expect many days without a signal, as in the grid above.
- You prefer quiet markets and limit orders: the range fade fits, but its targets are small, so costs weigh most.
Then test it before you trade it. Write the rules down, apply them to past sessions with the checks in our backtesting guide, and practise in a simulated account such as TradingView paper trading. Size every trade from the stop distance with our position sizing guide.
Common mistakes when choosing a strategy
Most mistakes come from changing rules after seeing the result. Read this list before a losing day, not after the result.
- Collecting strategies. Three half-learned methods give you three ways to make mistakes. Start with one.
- Treating VWAP as a signal. A touch of VWAP without trend, stop and exit rules is not a setup.
- Ignoring the no-trade rule. Most of the protection comes from the days you skip.
- Judging by one week. Five sessions show the mechanics. A sample that says anything about results needs far more trades and costs included.
- Changing the stop after entry. A moved stop turns a defined risk into an open one.
Frequently asked questions about day trading strategies
What is the best day trading strategy for beginners?
There is no best strategy, only one that fits your schedule and that you follow. For a beginner, a rule set with few signals, a fixed stop and a clear no-trade condition is easier to practise than a busy one. Test it in a paper account first.
Is VWAP a strategy on its own?
No, VWAP is a reference line. It shows the volume-weighted average price since the open. It becomes part of a strategy only when you add entry, stop, exit and no-trade rules.
How many trades should a day trader take per day?
As many as the rules allow, which can be zero. In the example grid, the trend pullback rule set traded on only two of five days. A daily trade limit protects against overtrading after a loss.
Do these examples show which strategy is most profitable?
No, they show how the rules work, not which one earns most. Five sessions in one week are a demonstration of the rules. Any statement about profitability would need a much longer test with costs, a fixed specification and all trades recorded.
Which market is best for these strategies?
Liquid markets with clear session times suit them best. The examples use SPY. On index futures, which trade almost around the clock, a 9:30 a.m. ET range is a cash-session anchor; our futures market hours guide has the times.