
Trading Edge: How to Calculate, Test and Keep One


Contents
- Trading edge in 30 seconds
- What is a trading edge?
- The expectancy formula: your average result per trade
- Where do trading edges come from?
- How to find your own trading edge, step by step
- How to test your trading edge
- Risk management and position size
- Why trading edges get weaker over time
- Can AI help you find a trading edge?
- Conclusion: find your edge and use it consistently
- Frequently asked questions about trading edges
- About the author
A strategy that wins 90 percent of the time can empty your account, and one that wins 40 percent can grow it year after year. The difference is the trading edge, and most traders have never calculated theirs. They have a setup that feels right and an account that shrinks anyway.
This guide shows you how to put a number on your edge, how to test it against luck and how to protect it. You get the expectancy formula with worked examples, the win rate you need for each reward-to-risk ratio, and the tests that most strategies fail. This article follows our editorial policy.
Trading edge in 30 seconds
- What it is: a statistical advantage that produces a positive expected value after costs and holds up over many trades.
- Win rate alone says nothing: a 90% win rate can lose money, a 40% win rate can be profitable for years.
- The formula: expectancy = win rate × average win minus loss rate × average loss. A positive value after costs is a first sign of an edge, not proof.
- What matters: the reward-to-risk ratio together with the win rate, never one of them alone.
- How to test it: a backtest with an out-of-sample part, then a forward test in a demo account with a large enough sample.
- How to keep it: risk 1 to 2% per trade, and recalculate your expectancy regularly, because edges decay.
What is a trading edge?
A trading edge is a statistical advantage that produces a positive expected value per trade after costs and holds up over many trades in different market phases.
An edge means you have found a situation in the market that repeats and puts the odds on your side. Not on every single trade: you will still lose regularly. But over many trades, the small advantage can add up to a profit.
How rare that is shows in the numbers of European regulators. In 2018, the European Securities and Markets Authority reported that 74 to 89% of retail accounts typically lose money trading CFDs, based on analyses by national supervisors. Since then, CFD providers in the EU must print their own loss rate in their risk warning.
It works like a casino. In American roulette, the house has an edge of 5.26% per spin, in European roulette 2.70%. The casino loses single rounds all the time and still makes money over thousands of spins.
In trading, you can choose your side. The gambler who hopes for luck, or the house that plays its advantage consistently. For that, you need more than a good entry: clear rules for the exit, the position size and your risk management. All of it together is your edge.
The expectancy formula: your average result per trade
Expectancy is the average profit or loss per trade: win rate times average win, minus loss rate times average loss.
Here is a concrete example. You win 45% of your trades. Your average win is twice your average loss, a reward-to-risk ratio of 2 to 1.
Expectancy = (0.45 × $200) − (0.55 × $100) = $90 − $55 = +$35 per trade
You lose more often than you win and still make money, because your winners are big enough. Over 100 trades of this kind, the model earns $3,500 before costs. If the result holds after costs on new data, that points to an edge.
45% versus 90% win rate: why high win rates deceive
Now turn it around. A strategy wins 90% of its trades, but the average win is $10 and the average loss is $100:
Expectancy = (0.90 × $10) − (0.10 × $100) = $9 − $10 = −$1 per trade
A 90% win rate, and you still lose money. This happens more often than you think, because many strategies take small profits quickly and let losses run. It feels good to be right almost every time, until one losing trade wipes out the last ten winners.
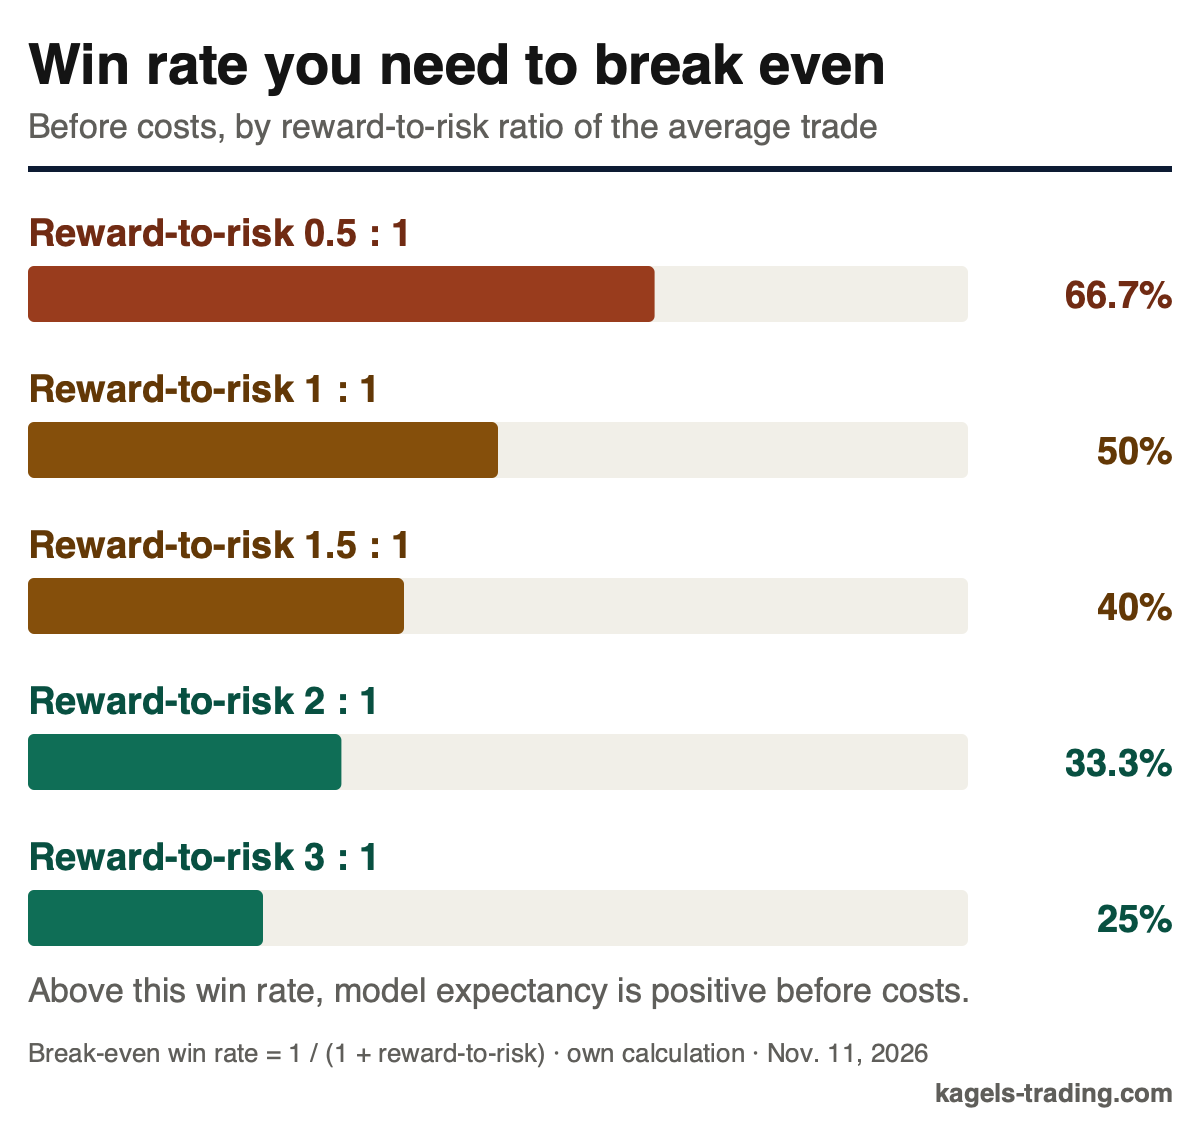
The reward-to-risk ratio sets the win rate you need. The chart shows the break-even win rate for five ratios. At 1 to 1 you need more than 50%, at 2 to 1 only a third, at 3 to 1 a quarter. Costs push each bar a little higher.
 Click to enlarge
What a trading edge is not:
- One big win is not an edge.
- Ten wins in a row can be pure chance.
- A single indicator is not an edge, whether RSI, a moving average or a candlestick pattern.
About 100 trades are a sensible first review sample, not proof. The law of large numbers applies to trading too: how reliable a positive expectancy is depends on how much the results vary, whether trades depend on each other, which market phases the sample covers and how many variants you tried before.
Your edge is always the whole system. Entry, exit, position size and risk management count together.
Jack Schwager makes a related point in his interviews with top traders. Ask whether a good result came from your system or simply from a strong market. When everything rises, every trader looks like a genius. More on those interviews in our guide to Market Wizards.
You do not have to calculate expectancy by hand. Most journal tools show it next to win rate and profit factor; our trading journal guide explains which numbers to record so the result is honest.
Where do trading edges come from?
Most edges come from one of five sources.
- Price patterns: trend following, mean reversion, seasonal patterns.
- Information and structure: better interpretation of data, and forced trading by large market participants.
- Psychology and discipline: buying fear, selling greed and sticking to the plan.
- Risk management and technology: volatility targeting and automation.
- Time horizon: short-lived versus long-lived edges.
Price patterns and technical edges
Markets tend to continue existing moves, and trend following is built on that. Mean reversion bets on the opposite: when a stock falls sharply within days without any fundamental change, the price often recovers part of the move.
The Turtle experiment shows how a low win rate can still work. Richard Dennis trained a group of beginners with a simple trend-following system. The win rate was below 50%, but the average winner was far larger than the average loser.
Over years, the few big winners more than paid for the many small losses. You can read the rules and their history in our guide to turtle trading.
Information and structural edges
An information edge sounds less legal than it usually is. If you notice that certain commodities tend to lead the stock market, you have an information advantage. Information alone is worth little, though: interpretation and timing make the difference.
Structural edges are often seen as the longest-lasting. Index funds, for example, often trade around index change dates because they track the index. Hedging by commodity producers also tends to follow their needs more than the price. Such flows can create price pressure you can estimate in advance, but whether that leaves an edge after costs, and for how long, needs testing like any other idea, because other traders know the dates too.
Psychological edges and discipline
Discipline alone can be an edge. If you buy during panic selling, sit through drawdowns without throwing out your system and do not jump into the next trade right after a loss, you already have an advantage. Some traders build their edge around the Fear and Greed Index, because extreme readings often mark turning points.
Most traders do not fail because of the wrong strategy. They fail because they cannot stick to their own. That is less a question of analysis than of behavior.
Risk management and technology as a source of edge
Robert Carver puts position size at the center of his book Systematic Trading. His volatility targeting adjusts the position to current volatility: larger in calm markets, smaller in wild ones. The idea is to risk roughly the same dollar amount on every trade.
Technology is an edge, too. When your system runs as an automated trading bot, there is no moment when you skip the next trade after three losses even though your rules say take it. Clean data without gaps also beats free feeds with delays.
Short-lived versus long-lived edges
Short-lived edges such as intraday patterns often work for only months or a few years. Once enough traders use the same setup, for example an opening range breakout, the advantage shrinks. You have to keep adapting and finding new setups.
Longer-lived edges such as trend following or rebalancing flows can work much longer than intraday patterns. Their cause tends to sit in the structure of the market, not in a pattern others can easily copy. That is no guarantee for decades, so they need regular retesting too.
How to find your own trading edge, step by step
Finding an edge starts with a strategy idea, and there are more than enough of them. Start with something proven, such as trend following. Look at charts and note which patterns repeat.
Ideas are everywhere, but most of them do not survive a clean backtest. Research papers, blogs, newsletters, videos and social media deliver more ideas than you can test. Whether an idea is an edge, you only see in the test results.
Understand why an idea could work before you test it. “It looked good in the backtest” is not enough. If you can explain the market mechanics behind your idea, you have a valid hypothesis.
Before you start, settle a few things:
- Which market do you want to trade?
- On which time frame?
- With how much capital?
- How large a loss can you bear?
Then turn your rules into a precise system. If you cannot tell a computer exactly when to buy and sell, you have a feeling, not a system. Keep the number of parameters small: a handful of settings, not dozens. The more parameters, the more likely your system only fits old data.
Be careful with manual backtests. Your brain finds patterns where there are none and remembers winners better than losers. That is confirmation bias.
Program your rules and let the computer test them. A simple Python backtest can check your rules on decades of price data.
A four-step loop for traders who do not code
Mike Bellafiore, co-founder of SMB Capital, stresses a loop of preparation, execution, recording and review in his book One Good Trade. We sum it up in four steps (develop, execute, record, review). More on his firm in our SMB Capital review.
- Develop: build your setup with clear rules for entry, stop and target.
- Execute: trade it consistently, with about 100 trades as a first sample.
- Record: log everything in a trading journal, including your emotions.
- Review: check your statistics and judge process quality, not only profit and loss.
This sounds easier than it is, and many traders fail right here. A losing trade that followed your rules is a good trade, because the process was right. A winning trade that broke your rules is a bad trade, even if your account says otherwise.
If you judge by process instead of single results, you get better over time. Your statistics then measure the system, not your mood.
How to test your trading edge
Your backtest looks good and your expectancy is positive. Before you risk real money, here are the main traps.
Avoid overfitting
Overfitting means tailoring a strategy so closely to historical data that it performs much worse in live markets than in the backtest.
Here is how it happens. You test a strategy from a video on the S&P 500 for one year. It works, but not great, so you add a filter and then another indicator. Suddenly you have fewer trades and a much better win rate.
What you did was fit the strategy to that one year. Strategies tuned like this regularly break down on new data or in new market phases.
Backtesting with in-sample and out-of-sample data
Backtesting means checking a trading strategy on historical prices to judge its profitability before using it live.
A simple split reduces the risk of overfitting. Divide your data into two parts:
- On the first part (in-sample) you develop the strategy and tune parameters.
- The second part (out-of-sample) stays untouched until you are completely done.
- Only then do you run the finished system on that unseen data, without changing a single parameter.
If the system collapses on out-of-sample data, treat that as a serious warning sign. Curve fitting is one possible cause; random variation, changed market conditions or an error in the test can also explain it, so find the reason before you trust or drop the idea. Include commissions and slippage from the start, because some strategies only look profitable without costs. Our backtesting guide shows a full worked example with an untouched test period.
Then shake the parameters as a check. Move each one by, for example, plus or minus 10%. If your system only works with a moving average of exactly 42 periods but not with 38 or 46, that is a strong warning sign worth investigating.
Finally, remove your best two or three trades and recalculate the expectancy. If it is still positive, good. If not, the result may have been luck.
Forward testing in the real market
Next, trade your system in a demo account or with small positions. This shows whether slippage, costs and real execution confirm your backtest or eat it. A TradingView paper trading account is enough to start.
In strong trend markets, every long strategy looks good. That is not your edge, that is the market. You only see whether your system works when conditions turn against it.
Walk-forward analysis and Monte Carlo for advanced traders
Walk-forward analysis tests a strategy again and again on a rolling window of unseen data to check its robustness across changing market phases.
It is the thorough version of the in-sample and out-of-sample split. Instead of splitting once, you move the window forward step by step and repeat the test. That shows whether your system copes with changing conditions.
A Monte Carlo simulation runs a trading system on randomly generated or reshuffled price paths to tell real patterns from random results.
If your system does much better on real data than on random data, that hints at real patterns, but it does not prove an edge. The result depends on how the random data is generated, which statistic you compare and how many tests you run. If it does about the same on both, that is a warning sign. A single passed prop firm challenge is not proof either, as our page on prop firm drawdown rules explains.
You do not need your own program for a first test. Our guide to TradingView backtesting shows how to run your rules through the history by hand and how many trades make a reliable sample.
Risk management and position size
Your edge is the whole system, and position size decides whether you actually collect it. The same strategy with a 45% win rate and a 2 to 1 ratio can run profitably for years at 2% risk per trade. At 10% risk, five losses in a row already cost about 41% of the account, and you would need a gain of almost 70% to get back, although the strategy is identical.
The instrument matters too. If you hold the same strategy as a leveraged CFD or margin swing trade, financing costs can eat a small edge completely. Futures have no separate overnight charge, but financing is built into the price: the fair value of an index future includes interest and expected dividends. Commissions, spreads, rolling to the next contract and less flexible position sizes come on top.
The 2% rule is a rule of thumb that caps the planned loss of a trade at 2% of the account, calculated as stop distance times position size times point value, plus costs.
The planned loss is not a guaranteed limit. For instruments in another currency, convert into your account currency. Price gaps and slippage can push the real loss beyond the plan.
A common rule of thumb among retail traders is simple. Risk at most 1 to 2% of your account per trade. Alexander Elder popularized the 2% rule in Come Into My Trading Room, together with a 6% rule: once this month’s losses plus the risk on your open trades reach 6% of the account, you open no new trades until the month ends.
Why these numbers? Because losing streaks are normal, not rare. At a 60% win rate, five losses in a row in one given sequence of five trades is only about 1% likely. But over a year with 200 trades, you will see at least one such streak with a probability of about 71%.
| Win rate | At least 5 losses in a row | At least 8 in a row | At least 10 in a row |
|---|---|---|---|
| 40% | 99.9% | 75% | 38% |
| 50% | 97% | 32% | 9% |
| 60% | 71% | 7% | 1% |
The table shows the chance of at least one losing streak of that length within 200 trades. We calculated it exactly with independent trades and a fixed win rate; real trades can cluster, which makes long streaks more likely.
Five losses in a row cost about 10% at 2% risk per trade. That hurts, but you can carry on. At 10% per trade, the same five losses leave you with about 59% of your capital: you have lost 41%.
Expect these streaks instead of throwing out your system after five losses. If your system is tested, a losing streak is normal and not a sign that something is broken.
In trading forums you keep reading about the Kelly criterion. John L. Kelly described the formula in 1956 in the Bell System Technical Journal for bets with known odds. In trading, win rate and payoff are only estimates, so Kelly works better as an upper bound than as your position size.
Position size decides not only how much you make, but also how deep your drawdowns get. Our guides to position sizing and risk management turn this into concrete rules.
Why trading edges get weaker over time
Edge decay, also called alpha decay, is the tendency of a trading edge to lose effectiveness over time through crowding, changes in market regime and technological change.
No edge lasts forever. As soon as too many traders use the same approach, they compete for the same entries and the advantage shrinks. The better known a setup is, the faster this happens.
Changes in the market environment come on top. A strategy that worked for years with near-zero interest rates can stop working when rates rise, because market participants behave differently. In 2022, US stocks and bonds fell sharply in the same year. Your system did not change, but the market did.
So recalculate your expectancy from your journal regularly and retest your strategies with new data each quarter. If the expectancy drifts toward zero over several months, look closer. Sometimes the best move is to switch a strategy off before it eats your capital.
Can AI help you find a trading edge?
Yes, but differently from what most people think.
AI does not replace an edge in trading; it speeds up the work an edge requires: writing backtest code, reading research papers and analyzing your trading journal.
AI is not a magic edge generator. No bot sends you signals that make you rich. Most “AI trading” products advertised on social media are marketing, not real advantages. What AI can do is help with work you must do anyway:
- Have it write backtest code in Python, even if you can barely code yourself.
- Have it summarize research papers so you can judge strategy ideas faster.
- Have it analyze your trading journal for patterns in your wins and losses that you do not notice.
The danger is overfitting. If a tool can backtest a thousand strategies in an hour, it will certainly find one that looks good on historical data. With a thousand attempts, something will work by chance.
That is not an edge, that is luck. The idea still needs a reason why it works, and it must survive the same tests described above. More in our guide to AI trading.
Conclusion: find your edge and use it consistently
A trading edge is not a secret formula but the result of a hypothesis, a clean test and disciplined risk management. If you do not know your expectancy, you trade blind. If you know it and keep your risk per trade small, you get through losing streaks far more easily. That is no guarantee either.
If you already trade, open your journal, take your last 100 trades and calculate your expectancy after costs. That shows whether your past trading made money. Whether it is a lasting edge, only the tests in this article can show.
If you do not have a strategy yet, start with something proven. Pick an approach such as trend following, write clear rules, test them on historical data and trade them in a demo account first. Your first edge does not have to be brilliant; it has to stay positive after costs and survive the tests. Our guide on how to learn trading covers the basics.
This is educational content, not investment advice. The examples use simple model numbers. They are not trading signals, and past results do not guarantee future results.
Frequently asked questions about trading edges
What is an edge in trading?
A trading edge is a statistically measurable advantage that leads to a positive expected value over many trades. It does not show in a single trade, only over hundreds of them.
How do you calculate your trading edge?
Use the expectancy formula: (win rate × average win) − (loss rate × average loss). The result is your average profit or loss per trade. A positive value after costs is a sign of an edge; only tests on new data show whether it lasts.
Can you be profitable with a 40% win rate?
Yes, if your winners are big enough. With a 40% win rate and a 2 to 1 reward-to-risk ratio, the expectancy is positive: $80 minus $60 is +$20 per trade on $100 risk. The Turtle trend-following system is the best-known example.
How many trades do you need to judge an edge?
About 100 trades are a first review sample, not proof. Below that, chance can easily look like skill. How much you can trust the result depends on how much the trades vary, whether they cover different market phases and how many variants you tested.
How do you test a trading edge properly?
In three stages. First a backtest with an untouched out-of-sample part, then robustness tests with shifted parameters or a walk-forward analysis, and finally a forward test in a demo account or with small positions.
Do trading edges stop working?
Yes, many do. Crowding, changes in market regime and new technology weaken edges over time. Retesting your expectancy regularly and running several uncorrelated strategies is the best protection.
Do you need to know how to code to find an edge?
No, but it helps. Manual backtests are prone to confirmation bias. If you know basic Python, you test faster and more objectively, and AI tools make the start easier.
This US edition is based on our German edition on kagels-trading.de and has been adapted for US readers.
More Risk Management guides
- Manage your trading risk
Risk Management in Trading: Rules, Math, Psychology
The 1% rule, stops, risk/reward, daily loss limits, leverage caps and the psychology of losing streaks, with the math behind each rule.
- Understand a stock market crash
Stock Market Crash: Causes, Patterns and Lessons
What caused 1929, 1987, 2000, 2008 and 2020, how deep the S&P 500 fell, how long recovery took, and the lessons for your own risk.
- Calculate your position size
Position Sizing in Trading: Formula, Calculator, Examples
The formula, a free calculator, the 1% rule explained correctly, and examples for stocks, forex and futures.
- Read your account equity
Account Equity vs Balance: Margin and Free Margin Explained
Equity against balance, margin, free margin and margin level, with a worked example and the close-out rules for cash, US margin and CFD accounts.
- Avoid a margin call
Margin Call: What It Is, How It Happens and How to Avoid It
When a margin call comes, what your broker does next, whether you can owe money, and four rules that keep your account away from it.
- Size your risk per trade
Kelly Criterion for Traders: Formula, Calculator, Risks
The Kelly formula for traders with a calculator, and a simulation of why full Kelly is far too much.
- Check a profit factor
Profit Factor in Trading: Formula, Calculator, Good Values
The formula, a free calculator, what a good value is, and why 61 trades showed 2.22 while 356 trades showed 1.37.
- Avoid costly mistakes
Trading Mistakes: 13 Costly Errors and How to Avoid Them
The 13 mistakes that cost accounts the most, the biases behind them, overtrading and revenge trading, and a checklist for your next trade.
- Keep a trading journal
Trading Journal: How to Record and Review Your Trades
What to write before and after each trade, a completed example with a win and a loss, a weekly review and a template to copy.
- Choose a journal
Best Trading Journal Software 2026: 6 Tools Compared
Six journals compared on price, free plans, refunds, automatic broker sync, costs and export, with a decision guide.
- Check TradeZella
TradeZella Review 2026: Pricing, Features and Limitations
The three plans since July 2026, what Essential leaves out, the no-refund terms, imports, export and what users report.
- Check TraderSync
TraderSync Review 2026: Pricing, Broker Sync and Limits
Plans and dated prices, broker imports and autosync, Market Replay, Cypher and the no-refund policy.
- Check Tradervue
Tradervue Review 2026: Imports, Reports and Costs
Silver or Gold, why net P&L needs Gold, few automatic imports, US-only stocks, the no-refund sign-up terms and how to cancel.
- Check Edgewonk
Edgewonk Review 2026: Features, Costs and Limitations
One feature set billed monthly or yearly, the refund period, MetaTrader auto sync, the psychology tools and our own test journal.
- Check TradesViz
TradesViz Review 2026: Pricing, Broker Sync, Terms
The free stock plan, Pro and Platinum prices checked November 10, 2026, which US brokers sync automatically, the no-refund terms and user reviews.