
Fed Interest Rate Decision 2026: Dates, Rate and Outlook


Contents
- The Fed rate decision in 30 seconds
- When is the next Fed rate decision?
- The latest Fed rate decision: September 2026, the first rise under Warsh
- The Fed rate decision of April 2026
- Fed rate outlook 2026: is a rate rise coming?
- What is the Fed rate decision?
- How does the Fed rate decision work?
- How does the Fed rate decision affect the markets?
- How much does a Fed decision move the market?
- The Fed and the ECB: the differences
- My conclusion on the Fed rate decision
- Frequently asked questions about the Fed rate decision
- About the author
On 16 September 2026 the Federal Reserve raised its policy rate by 0.25 percentage points to 3.75 to 4.00%, the first rise since July 2023. Under Chair Kevin Warsh the decision was unanimous, 12 to 0, seven weeks after a meeting with three dissents. For traders and investors in US stocks, currencies or commodities, the Fed rate decision is one of the most important dates in the economic calendar.
On this page you will find the current state of the Fed rate decision, the new dot plot from September, all dates for 2026 and 2027, and our own measurement of how much markets actually move on a Fed day, based on 60 meetings since 2019. All information is updated regularly and comes from official Federal Reserve sources and from market data of leading providers.
The Fed rate decision in 30 seconds
- Decision of 16 September 2026: the Fed raises its policy rate to 3.75 to 4.00%, the first rise since July 2023
- Vote 12 to 0: unanimous, after three members had voted against the pause in July
- New dot plot: the median sees 4.1% at the end of the year, and 16 of 18 participants expect at least one more step
- Next meeting: 27 and 28 October 2026, without new projections, released at 7:00 pm Central European Time
When is the next Fed rate decision?
The next FOMC meeting takes place on 27 and 28 October 2026, without new projections. One point for readers in Europe: Europe puts its clocks back on 25 October, the United States only on 1 November. In that week the decision therefore arrives at 2:00 pm Eastern Time (7:00 pm Central European Time), one hour earlier than usual, and the press conference starts at 2:30 pm Eastern Time (7:30 pm Central European Time). The next meeting with new projections and a dot plot is on 8 and 9 December 2026.
| Meeting | SEP / dot plot |
|---|---|
| 15 and 16 September 2026 (done) | Yes |
| 27 and 28 October 2026 | No |
| 8 and 9 December 2026 | Yes |
| 26 and 27 January 2027 | No |
| 16 and 17 March 2027 | Yes |
| 27 and 28 April 2027 | No |
| 8 and 9 June 2027 | Yes |
| 27 and 28 July 2027 | No |
| 14 and 15 September 2027 | Yes |
| 26 and 27 October 2027 | No |
| 7 and 8 December 2027 | Yes |
The decision is released on the second day of each meeting at 2:00 pm Eastern Time. The FOMC minutes follow about three weeks later. Source: federalreserve.gov
The latest Fed rate decision: September 2026, the first rise under Warsh
On 16 September 2026 the Federal Reserve raised its policy rate by 0.25 percentage points to 3.75 to 4.00%. It is the first rate rise since July 2023 and the first under Kevin Warsh. The decision was unanimous, 12 to 0, after three members had voted against the pause in July.
The statement is short and gives a single reason. The economy is expanding at a solid pace, domestic spending is resilient, job gains have kept pace with the workforce, and the unemployment rate has changed little. Then comes the sentence that matters: inflation remains elevated, and the move is meant to support a timelier return to the 2% goal. At the end the committee repeats its clear commitment that it will deliver price stability. That sentence was already in the statements of June and July. What is new in September is that the Fed backs the commitment with a rise of 25 basis points.
Warsh kept the press conference short. Today’s decision was the right decision, he said, and inflation is too high and has been for too long. Once again there was no forward guidance: he would not commit himself on the coming meetings.
The new dot plot is the real news. The median for the end of 2026 stands at 4.1%, a quarter of a point above today’s range. Of the 18 participants, 12 see exactly one more step, 4 see two, and only 2 see none. For the end of 2027 the median is also 4.1%, so the median shows no cut for next year. The individual projections do spread out, though: four of the 18 participants see the policy rate at the end of 2027 below today’s range. The chart shows every dot on its own.
As in June, Warsh did not submit a dot of his own. At the press conference he spoke of the projections of his 18 colleagues, which he said he was only passing on.
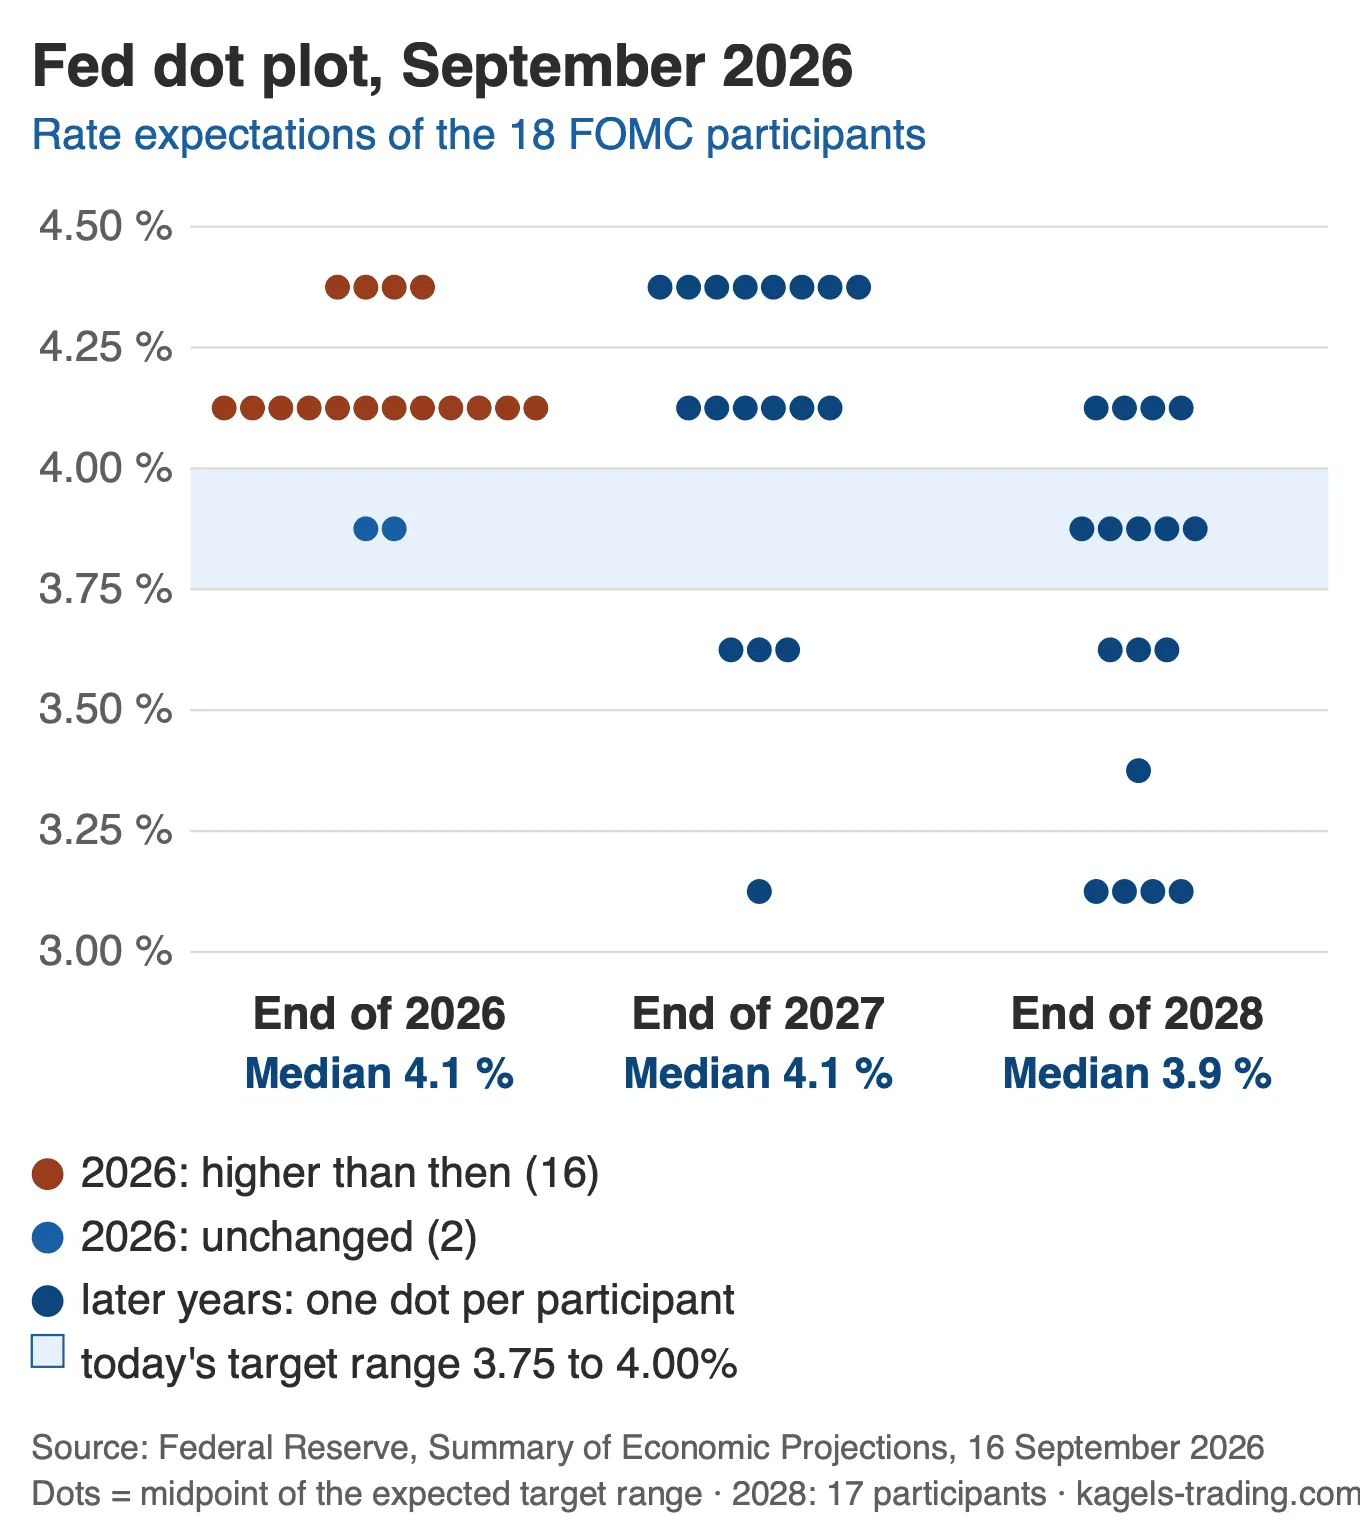 Fed dot plot, September 2026: the median for the end of 2026 and the end of 2027 stands at 4.1%. Twelve of the 18 participants see exactly one more step, four see two, and two see none. Source: Federal Reserve, Summary of Economic Projections of 16 September 2026.
| Projection (median) | Sept. | June |
|---|---|---|
| Policy rate end of 2026 | 4.1% | 3.8% |
| Policy rate end of 2027 | 4.1% | 3.6% |
| PCE inflation 2026 | 3.7% | 3.6% |
| Core PCE 2026 | 3.4% | 3.3% |
| Unemployment rate 2026 | 4.1% | 4.3% |
| GDP growth 2026 | 2.3% | 2.2% |
FOMC projections of 16 September 2026 against those of 17 June 2026. Source: Federal Reserve, Summary of Economic Projections.
The market reaction stayed within what a Fed day usually brings. The S&P 500 closed 0.45% lower, the Dow lost 1.21%, and the Nasdaq finished almost unchanged. In the bond market the two-year Treasury yield rose by 7 basis points to 4.74%, the ten-year by one basis point to 5.01%. The dollar gained: the dollar index climbed 0.66% to 100.31, and EUR/USD fell from 1.1542 to 1.1476 between 8 and 10 pm Central European Time.
Gold took the hardest hit. The gold future lost 1.99% in the two hours after the decision, with a range of 3.15%. For context: the daily range of the S&P 500 was 1.57%, while the median for a Fed day since 2019 is 1.24% and the median for an ordinary trading day is 0.95%. The section further down shows how that is distributed.
Looking back: the July 2026 decision, three dissents for Warsh
On 29 July 2026 the Federal Reserve left its policy rate at 3.50 to 3.75% for the fifth time in a row. What is new is the vote: the decision passed 9 to 3. Beth Hammack (Cleveland), Neel Kashkari (Minneapolis) and Lorie Logan (Dallas) voted for a rise of 0.25 percentage points. The last time three dissents went in the same direction was in September 2016.
Warsh: no soft inflation target
The statement describes an economy growing at a solid pace amid raised uncertainty, partly because of the conflict in the Middle East. Job creation is keeping pace with the growth of the labour force, and the unemployment rate was little changed. Inflation remains above the 2% target. Kevin Warsh was clear at the press conference: there is no soft inflation target, only one target, 2%. Five years of inflation above target could not be cured in nine weeks, and the Fed would not waver.
Once again there was no forward guidance. Warsh said the statement deliberately stays out of forecasting: market participants should react to data, not to the central bank. On the three dissents, he said he had asked for an open debate and got one. He avoided any signal for September, but said the Fed would not hesitate to act where needed.
The market reaction was clear: the yield on ten-year US Treasuries rose by about 8 basis points to 4.69%, and the 30-year yield climbed above 5.2%. Stocks came under pressure: the Dow lost 2.2%, the S&P 500 1.5% and the Nasdaq 1.7%. The US dollar weakened, and gold gained about 1%.
Looking back: the June 2026 decision, Warsh’s first meeting
On 17 June 2026 the Federal Reserve left its policy rate unchanged at 3.50 to 3.75% for the fourth time in a row. It was the first meeting under the new chair Kevin Warsh, who had been sworn in on 22 May. The vote was unanimous, 12 to 0, a clear contrast to the disputed 8 to 4 decision in April.
Warsh overhauls Fed communication
Warsh shortened the monetary policy statement considerably and dropped the previous forward guidance. The statement no longer contains any hints of future rate cuts or rises. The so-called easing bias wording, which had provoked three dissents in April, was removed without replacement. Warsh also announced five task forces to review key areas of the Fed by the end of the year: communication, balance sheet policy, data sources, productivity and the labour market, and the causes of inflation.
What drew particular attention was that Warsh became the first Fed chair not to submit his own dot for the dot plot. At the press conference he said he did not consider the dot plot in its current form helpful in shaping monetary policy. The other 18 participants submitted their projections as usual.
New projections: the Fed raises its inflation forecast sharply
The Summary of Economic Projections from June paints a dramatically different picture from March. For 2026 the Fed now expects PCE inflation of 3.6%, up from 2.7%. Core PCE inflation was raised to 3.3%. At the same time the Fed trimmed its growth forecast to 2.2% (from 2.4%) and its unemployment forecast to 4.3%.
The Summary of Economic Projections (SEP) is the Fed’s quarterly economic forecast, with estimates for inflation, growth, unemployment and the expected rate path.
The dot plot has turned 180 degrees: the median policy rate for the end of the year is 3.8%, which equals one rate rise of 0.25 percentage points. Nine of 18 participants expect the rate at the end of 2026 to be above the current level, six of them even two rises. Rate cuts are only expected from 2027.
The dot plot is a chart of the individual rate expectations of FOMC participants for the coming years. In June 2026 only 18 of 19 participants submitted a dot, because Chair Kevin Warsh deliberately did not.
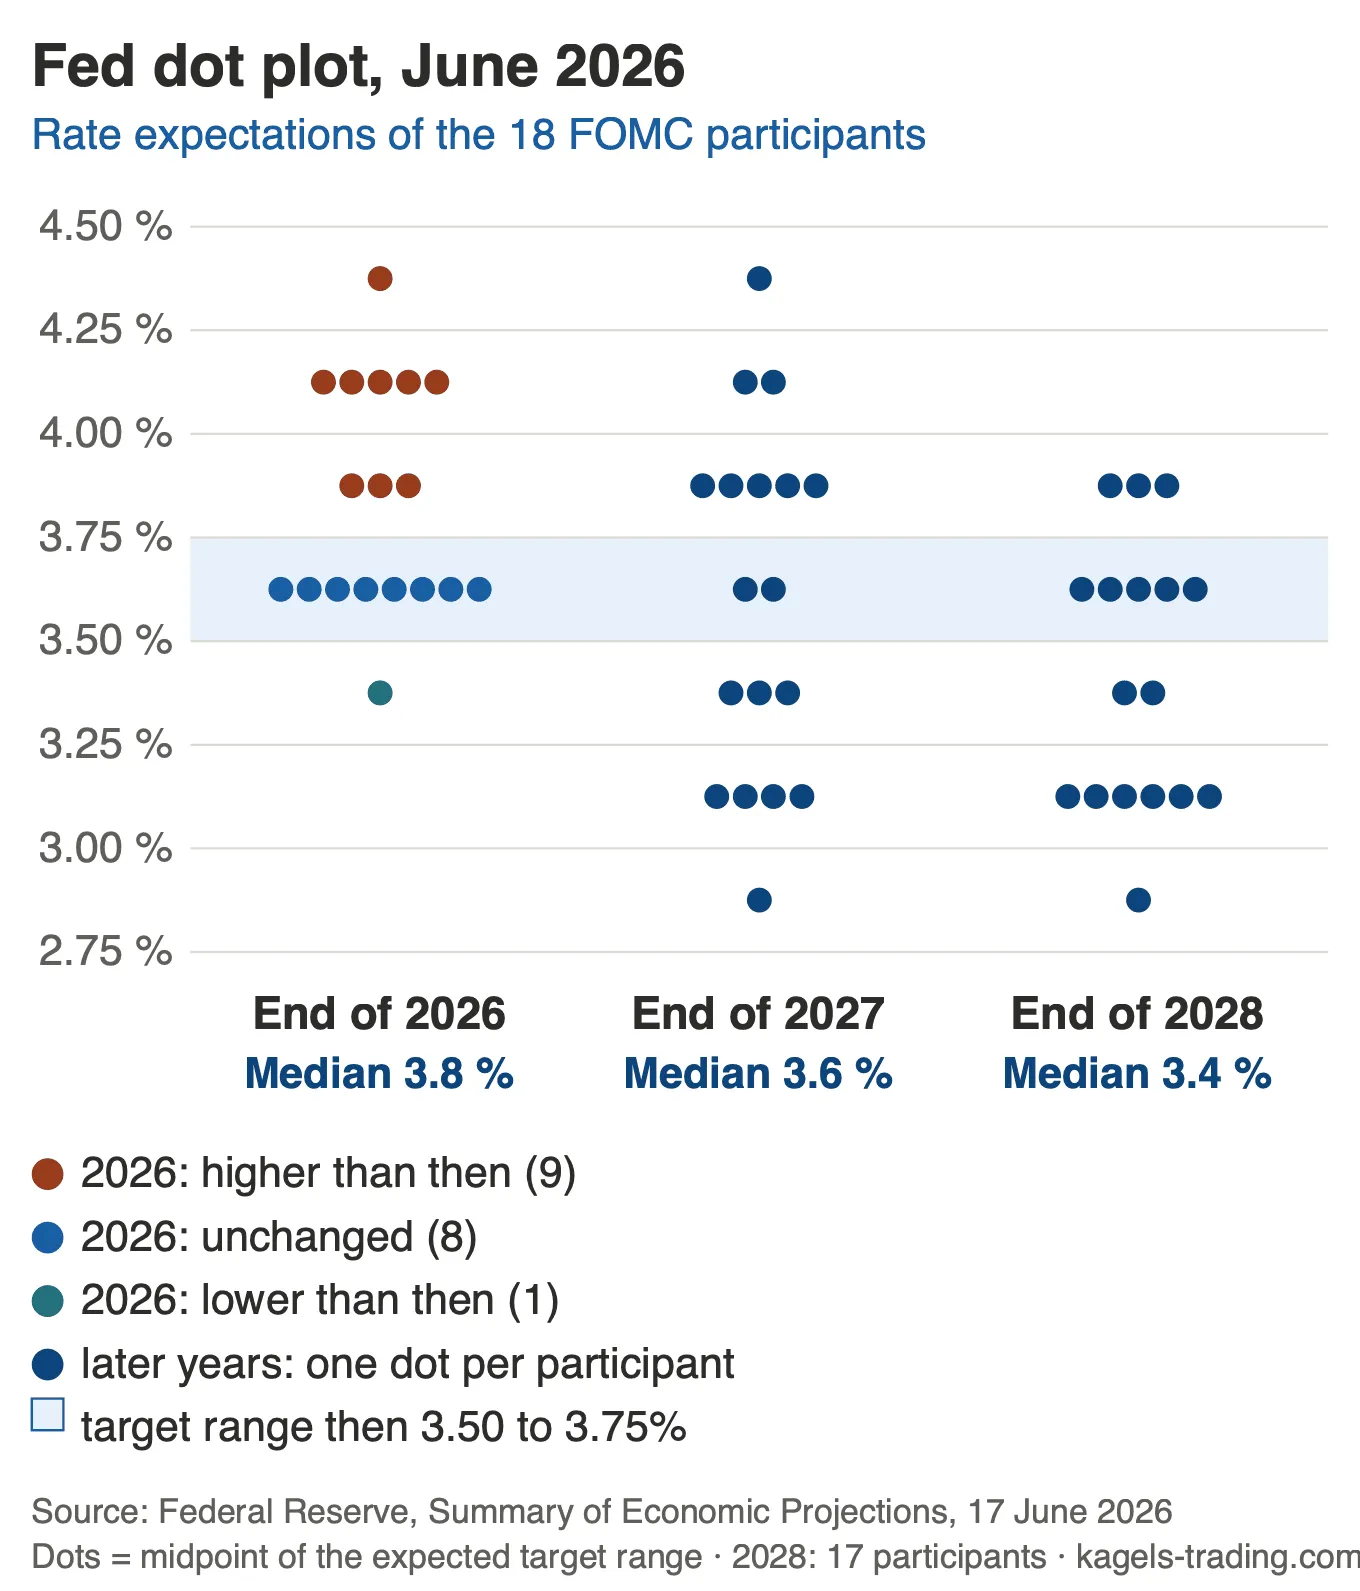 Fed dot plot, June 2026: the median rate path signalled a rise to 3.8% for the first time. Nine of the 18 participants expected higher rates than the range at the time, and Chair Warsh did not submit a dot. Source: Federal Reserve, Summary of Economic Projections of 17 June 2026.
The main reason for the drastic revision is the oil price shock caused by the Iran war and the blockade of the Strait of Hormuz (see the crude oil forecast). The US consumer price index (CPI) stood at 4.2% in May, its highest level since April 2023. At the same time the labour market remains robust: 172,000 new jobs were created in May, well above expectations.
Market reaction in June: sell-off into the close
Markets reacted calmly at first, then turned clearly lower in the last hour of trading. The S&P 500 and the Nasdaq hit their lows of the day in the final minutes, as the weight of the hawkish dot plot sank in. Short-term bond yields jumped. The US dollar rallied strongly, while EUR/USD and the gold price came under pressure. Both typically react negatively to rising US real interest rates. On the futures market, the CME FedWatch Tool priced a probability of about 61% for a rate rise in October.
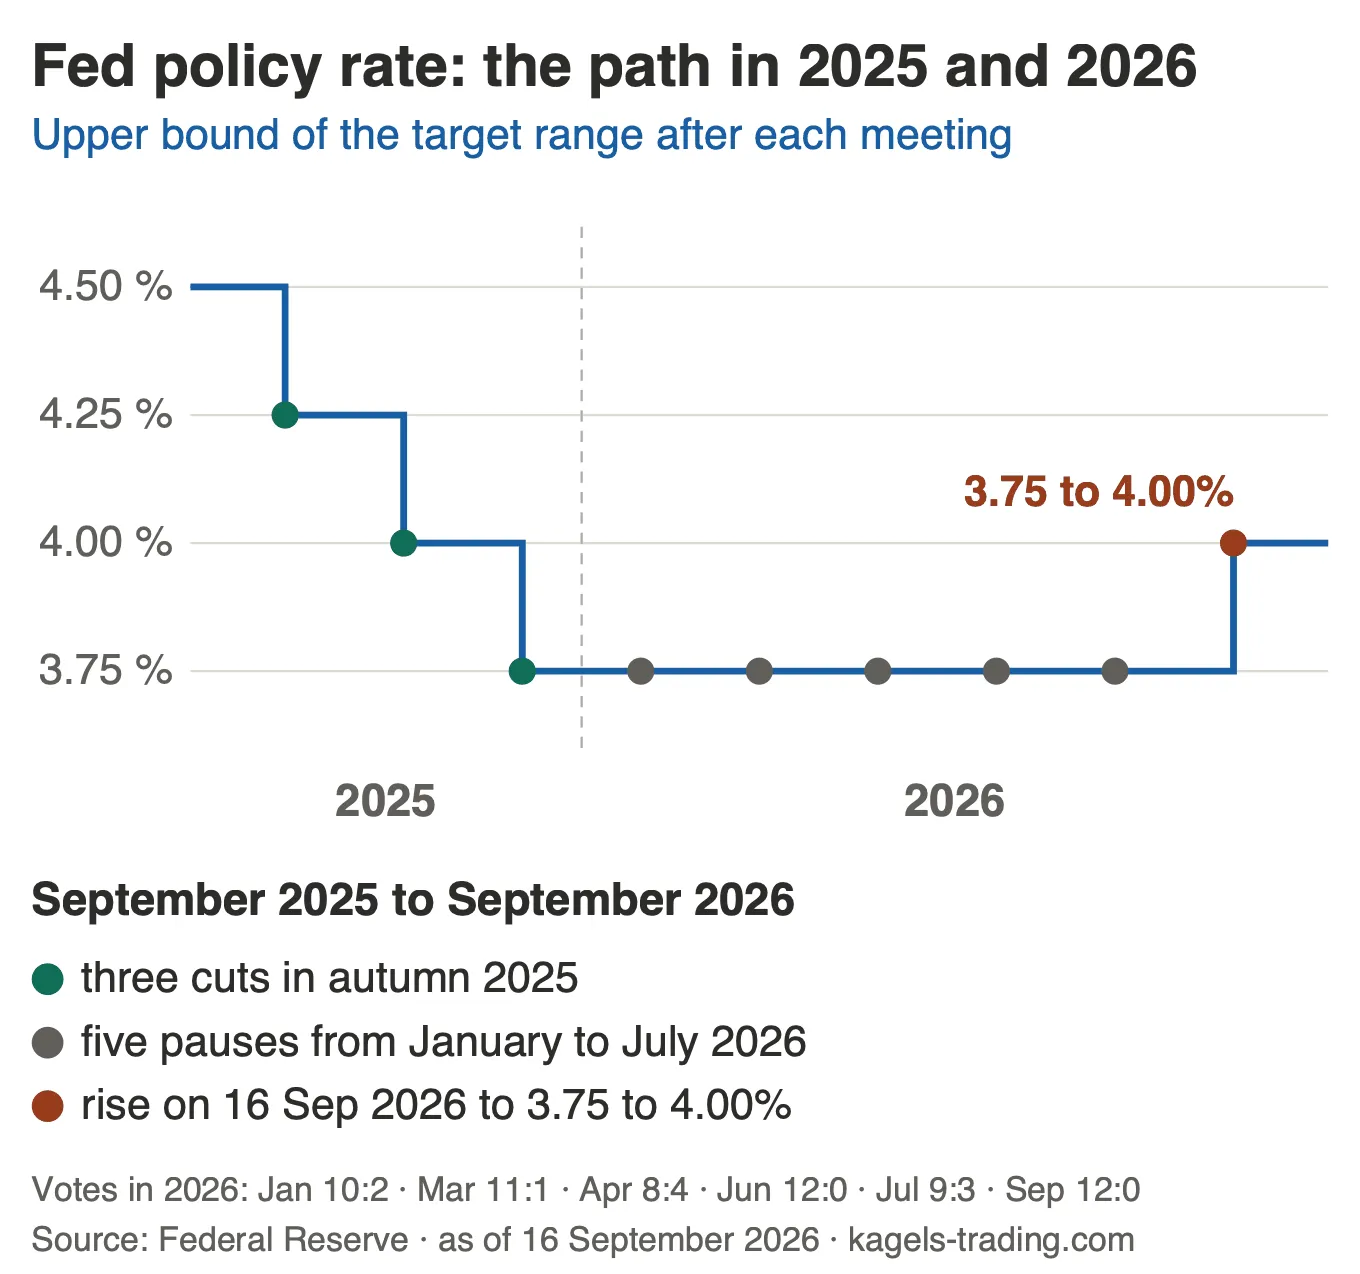 Fed policy rate 2025 to 2026 (upper bound): three cuts in autumn 2025, then five pauses from January to July 2026, and the rise of 16 September 2026 to 3.75 to 4.00%. The vote of every meeting in 2026 is shown below the chart. Source: Federal Reserve.
The Fed rate decision of April 2026
On 29 April 2026 the Fed left its policy rate at 3.50 to 3.75%. The vote was 8 to 4, the strongest dissent since October 1992. Stephen Miran voted for a cut, while Beth Hammack, Neel Kashkari and Lorie Logan voted against the easing bias in the statement. At his last press conference as chair, Jerome Powell announced that he would stay on the Board as a governor. On the same day, the Senate Banking Committee approved Kevin Warsh’s nomination by 13 to 11. Full Senate confirmation followed on 13 May 2026. Miran then left the Board to make room for Warsh.
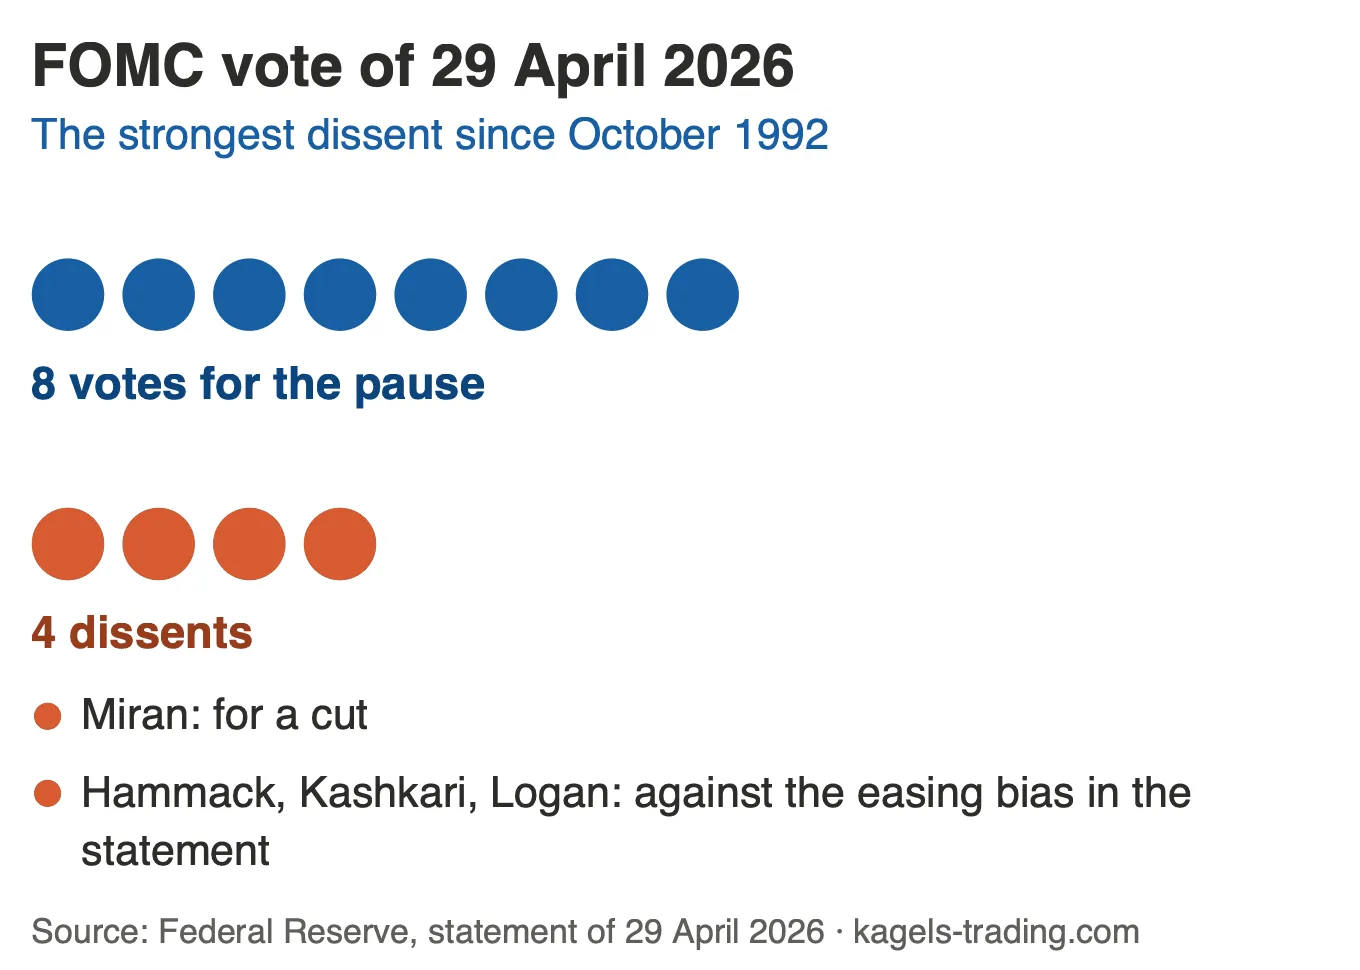 FOMC vote, April 2026: the 8 to 4 split turned into a unanimous 12 to 0 under Warsh in June. Source: Federal Reserve, statement of 29 April 2026.
Fed rate outlook 2026: is a rate rise coming?
Since 16 September the question is no longer whether the Fed raises rates, but how often it still will.
The September dot plot sets the direction: 16 of the 18 participants expect at least one more step by the end of the year, and the median stands at 4.1%. For the end of 2027 the same figure applies. What matters for 28 October is the inflation data of the coming weeks: the Fed projects PCE inflation of 3.7% for 2026 and a core rate of 3.4%, both clearly above target.
There is still no commitment on the path ahead. Warsh gave no forward guidance in September either and said nothing about the coming meetings. Anyone trying to judge the next step is left with the data and with prices in the futures market, not with statements from the central bank.
Prediction markets offer a second reading of these expectations. On October 6, 2026, the exchange Kalshi priced an 82 percent chance that the Fed leaves rates unchanged on October 28, close to the FedWatch Tool. How such event contracts work is explained in our guide to prediction markets.
Several factors currently point to tighter monetary policy:
- Dot plot: 16 of 18 participants expect at least one more rise in 2026
- PCE inflation projected at 3.7% for 2026, with a core rate of 3.4%
- The unemployment rate for 2026 was lowered to 4.1% (June projection: 4.3%), so the labour market gives no reason to ease
- The US government’s tariff policy is pushing consumer prices up further
- The statement repeats the commitment to price stability, and the rise was unanimous
One source of uncertainty remains geopolitics. The statement names it explicitly as a reason why uncertainty stays elevated. If the oil price falls sharply, inflation pressure could ease and the rate path could flatten again.
What is the Fed rate decision?
The Fed rate decision is the US central bank’s decision on the target range for the federal funds rate, the policy rate at which American banks lend money to each other overnight.
The Federal Open Market Committee (FOMC) takes this decision eight times a year. The committee has twelve voting members: the seven members of the Board of Governors, the president of the Federal Reserve Bank of New York and four of the other eleven regional bank presidents, who vote on a rotating basis.
The Federal Open Market Committee (FOMC) is the monetary policy body of the US central bank. It votes on the level of the policy rate and the direction of monetary policy.
The Fed has a dual mandate: maximum employment and stable prices. By raising or cutting its policy rate, it steers borrowing costs across the whole economy. Higher rates make credit more expensive and slow demand. Lower rates make money cheaper and stimulate consumption and investment.
The federal funds rate is the Fed’s policy rate: the interest rate at which banks lend money to each other overnight.
The decision is released on the second day of each meeting at 2:00 pm Eastern Time (20:00 CEST) in a monetary policy statement. Straight after that, at 2:30 pm Eastern Time (20:30 CEST), the Fed chair holds a press conference. At four of the eight meetings the Fed also publishes its economic projections (Summary of Economic Projections), including the dot plot. About three weeks after each meeting the FOMC minutes are released: the detailed record of the meeting, which traders analyse closely.
How does the Fed rate decision work?
The Federal Reserve is the central bank of the United States and steers monetary policy for the world’s largest economy.
The process follows a fixed routine. In the weeks before each meeting the Fed analyses a wide range of economic indicators: labour market data (non-farm payrolls), inflation data (CPI, PPI, PCE), GDP growth, consumer spending and conditions in financial markets. Based on this data, FOMC members form their individual assessments. The Fed publishes detailed information on monetary policy on its official website.
During the so-called blackout period, FOMC members may not comment publicly on monetary policy. It begins on the second Saturday before the meeting at 12:00 am Eastern Time and ends on the day after the meeting at 11:59 pm Eastern Time, as set out in the FOMC communication rule. This matters for traders, because trading volume typically falls in this phase and volatility rises ahead of the decision.
The two-day meeting itself takes place in Washington. On the first day the economic situation and risks are discussed, and on the second day the committee votes. The result is released at 2:00 pm Eastern Time in a short monetary policy statement. At the press conference that follows at 2:30 pm, the chair explains the decision and answers questions from the press.
At four meetings a year (March, June, September, December) the Fed also publishes the Summary of Economic Projections with the dot plot. These meetings are considered especially market-relevant, because they show the expected rate path for the coming years. About three weeks after each meeting the FOMC minutes are released, and they often trigger further market moves.
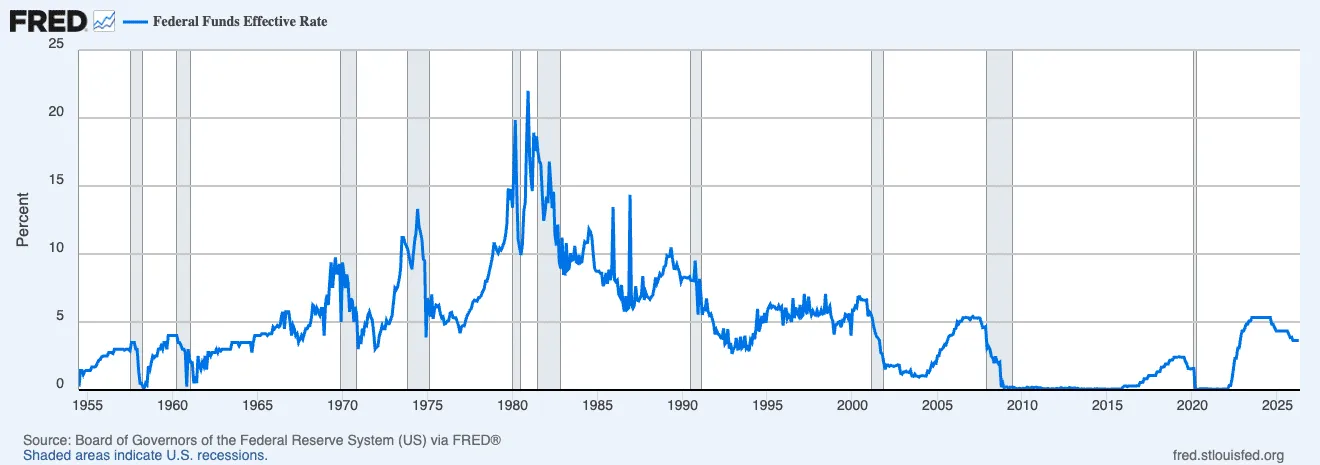 Federal funds rate since 1954, as of the summer of 2026: the range of 3.50 to 3.75% that applied until 16 September 2026 is close to the long-term average. Source: Federal Reserve Bank of St. Louis, FRED.
How does the Fed rate decision affect the markets?
The Fed rate decision has far-reaching effects, both on the US economy and on global financial markets. For experienced traders, four channels matter most. The effect is especially clear in the yen, where the rate gap between the Fed and the Bank of Japan drives the exchange rate.
Borrowing costs and consumption
The policy rate sets the base for all short-term interest rates in the US economy. When it rises, loans become more expensive for companies and consumers, and consumption and investment fall. When it falls, money becomes cheaper, which stimulates the economy. This mechanism is the most important transmission channel of monetary policy.
Stock markets
Rate cuts tend to make stocks more attractive, because bond yields fall and the risk premium for stocks rises. Rate rises work the other way round: bonds become more attractive as an alternative to stocks, and valuations come under pressure. Growth and technology stocks are especially sensitive to rates, as the sell-off on the day of the June decision showed. How the tech index is doing on the chart is shown in our Nasdaq 100 forecast.
The US dollar and exchange rates
Higher US interest rates attract international capital and strengthen the US dollar. That pushes the EUR/USD rate down and makes US assets more expensive for European investors. Conversely, a rate cut can weaken the dollar, which in turn supports the gold price, since gold traditionally moves inversely to the dollar.
Bond market and yields
Fed policy directly affects the yields on US Treasuries. The yield on the 10-year Treasury is seen as the global benchmark rate and feeds into mortgage rates, corporate bonds and the US government’s financing costs. How much the market expects those yields to swing is measured by the MOVE index, the VIX of the bond market. Where the Fed rate and the 10-year yield could go next is covered in our interest rate forecast.
The Fed’s rate decisions affect not only financial markets but also rates on savings and loans. Rising US interest rates tend to lift the global interest-rate level, including in Europe.
How much does a Fed decision move the market?
For this section I measured all 60 regular Fed decisions from January 2019 to July 2026. In each case the range on the decision day is compared with an ordinary trading day from the same period. The two emergency cuts of March 2020 are left out, because they fell outside the meeting calendar.
On a Fed decision day the S&P 500 typically swings about 30% more than on an ordinary trading day, and in the two hours after the release more than two and a half times as much.
| Market | Fed | Normal | Stronger |
|---|---|---|---|
| S&P 500 | 1.24% | 0.95% | 73% |
| DAX (next day) | 1.29% | 1.02% | 62% |
| EUR/USD (next day) | 0.36% | 0.24% | 67% |
| Gold (GLD) | 1.30% | 0.80% | 93% |
Median move across 60 FOMC meetings, January 2019 to July 2026. The measure is the daily range; for the euro it is the ECB reference rate against the next day. “Stronger” means larger than the median of all other trading days, which pure chance would put at 50%.
Gold reacts most clearly. On 56 of 60 decision days its daily range was larger than on a typical day. For the DAX the effect is weaker: Xetra closes at 5:30 pm Central European Time, the decision only comes in the evening, and what happens overnight in the DAX future shows up in the opening gap the next day rather than in the range.
More movement does not mean more direction. Measured by the closing price, the S&P 500 moves more than usual on only 57% of Fed days, and across 60 meetings that is hard to tell apart from chance. The market swings, but often ends up close to where it started. The risk sits in the back and forth, not in a predictable trend.
The two hours after the decision
The effect is largest in the window from 2 to 4 pm New York time. That is the time between the release and the US close. Hourly candles on Yahoo Finance only go back about two years, so this part rests on 19 to 22 meetings since the end of 2023.
| Market | Fed | Normal | Stronger |
|---|---|---|---|
| S&P 500 future | 0.95% | 0.37% | 18 of 19 |
| EUR/USD | 0.50% | 0.10% | 22 of 22 |
| Gold future | 1.73% | 0.38% | 19 of 19 |
Range of the futures and the euro in the two hours after the decision (median), hourly candles from Yahoo Finance.
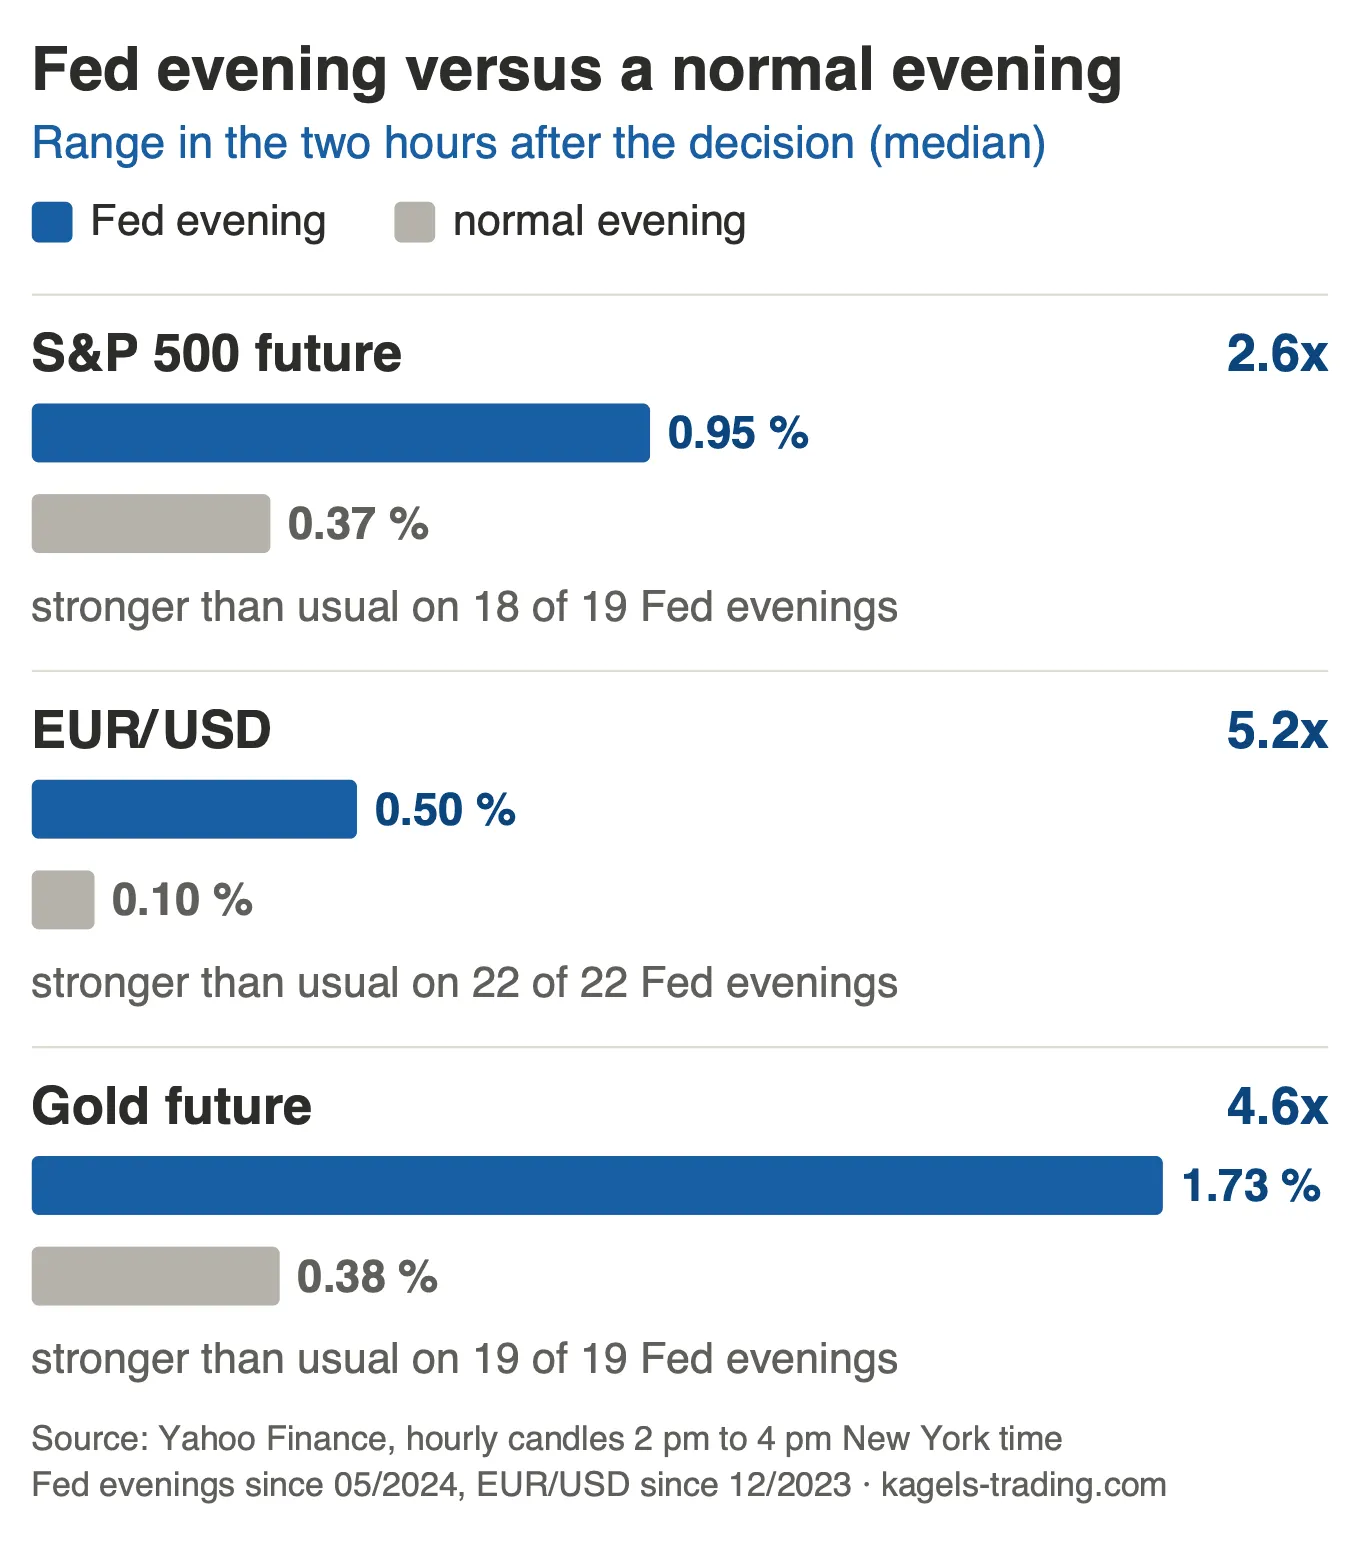 After a Fed decision the S&P 500 future, EUR/USD and gold swing 2.6 to 5.2 times as much as on an ordinary evening (median, hourly candles since the end of 2023, own calculation).
The difference is largest for the euro: the range is about five times the one on a normal evening, for gold 4.6 times and for the S&P 500 future 2.6 times. The chart shows the three markets side by side. What that looks like in practice was visible on 16 September 2026: the gold future swung 3.15% in those two hours, almost twice as much as on an average Fed evening, and the S&P 500 future 1.55%.
Pause, rate change, projection meeting
The rate change itself makes the biggest difference, not the dot plot. The table takes the daily range of the S&P 500 and sorts the 60 meetings by the type of decision.
| Meeting | Count | Range | Stronger |
|---|---|---|---|
| Pause | 40 | 1.17% | 68% |
| Change | 20 | 2.08% | 85% |
| Rise | 11 | 2.58% | 91% |
| Cut | 9 | 1.11% | 78% |
| with dot plot | 29 | 1.24% | 83% |
| without dot plot | 31 | 1.17% | 65% |
S&P 500, daily range on the decision day (median), 60 regular FOMC meetings from January 2019 to July 2026. Rise and cut are subsets of the rate changes.
The rises have to be read with care. All eleven fell in 2022 and 2023, when markets were nervous anyway. I therefore compared every Fed day with the 20 trading days before it as well. Even then the S&P 500 swung more than in the weeks before on all eleven days with a rise, while on pause days it did so in only 59% of cases. The rise of 16 September fits in exactly there, with a daily range of 1.57%.
The data does not support a reliable dot plot effect. In the same comparison the projection meetings are only slightly ahead for the S&P 500, at 76% against 67%. For the DAX range on the next day it is the other way round: there the meetings without projections move the market more often.
How I measured
The meeting dates come from the Federal Reserve meeting calendar, the prices from Yahoo Finance and the euro reference rates from the European Central Bank. The range is the daily high minus the daily low, divided by the previous close. Gold is measured through the GLD exchange traded fund, because the daily settlement price of the gold future is set before the decision. For the euro I take the ECB reference rate of 2:15 pm Central European Time and compare it with the one of the next day, because the daily candles for currencies on Yahoo do not cover the evening properly.
The Fed and the ECB: the differences
For traders in Europe, the comparison between the Fed and the ECB is especially relevant, because both central banks influence the most important currencies and their decisions act directly on the EUR/USD exchange rate.
In Europe, rate expectations show most directly in the Bund future, which moves inversely to the yield on ten-year German government bonds.
The Fed steers monetary policy with a single policy rate, the federal funds rate. The ECB works with three key rates: the main refinancing rate (currently 2.65%), the deposit facility (2.50%) and the marginal lending facility (2.90%).
The ECB raised rates twice in 2026, on 11 June and on 10 September, by 0.25 percentage points each time. Both central banks are tightening, and both did so in September. The rate gap between the Fed’s upper bound of 4.00% and the ECB deposit rate of 2.50% is 1.50 percentage points. This gap continues to drive capital into the dollar and makes US bonds attractive for European investors. For European traders the rate gap also affects the DAX, because rising US rates can pull capital out of European stocks.
In 2026 both central banks face the same dilemma: inflation is above target, while the growth outlook stays uncertain. Both responded in September and raised rates, the Fed by 0.25 percentage points to 3.75 to 4.00% and the ECB by the same step to a deposit rate of 2.50%.
Two neighbouring central banks often decide close to the Fed. The Bank of Canada has often announced on the same Wednesday since 2025, at 9:45 a.m. ET, as the Bank of Canada rate decision shows. The Bank of England often decides the day after the Fed, see the BoE rate decision, and for the Australian dollar there is the RBA rate decision. In December 2026 the Swiss National Bank follows on 10 December, the day after the Fed’s decision, as the SNB rate decision shows.
My conclusion on the Fed rate decision
With 16 September 2026 the debate has turned into a decision: Kevin Warsh raises the policy rate to 3.75 to 4.00%, and he does it unanimously. In July three members still stood against him, in September the committee stands behind the tightening as a whole.
The outlook is the remarkable part. In the median the dot plot sees one more step by the end of the year and no cut in 2027, even though individual participants see it differently. For forex traders the reaction on Wednesday evening was clear: short yields higher, stocks weaker, the dollar firmer and gold clearly under pressure.
For my own trading this changes one thing above all: the next date is a real date again. If you want to use the Fed rate decision as a trader, put the FOMC meetings firmly into your trading plan and look at your position size beforehand. My measurement above shows why: on these evenings the range is regularly a multiple of the usual one, while the direction cannot be predicted.
One source of uncertainty remains geopolitics. The statement names it explicitly as a reason why uncertainty stays elevated. As long as that lasts, volatility in the interest-rate markets stays high, and a few data points can turn the rate path around again.
Frequently asked questions about the Fed rate decision
What is the Fed rate decision?
The Fed rate decision is the US central bank’s decision on its policy rate, the federal funds rate. The FOMC takes this decision eight times a year and so sets the rate at which American banks can borrow money from each other overnight. The decision has far-reaching effects on financial markets, loan rates and the value of the US dollar.
What time is the Fed rate decision released?
The decision is released at 2:00 pm Eastern Time (20:00 CEST) in a monetary policy statement. The Fed chair’s press conference follows at 2:30 pm Eastern Time (20:30 CEST). Note: because Europe and the US change their clocks on different dates, the time in Europe can differ by one hour.
How often does the Fed decide on rates?
The FOMC meets eight times a year, each time on two consecutive days (Tuesday and Wednesday). At four of these meetings (March, June, September, December) the Fed also publishes its economic projections and the dot plot. The exact dates are published in advance on the Federal Reserve’s website.
When is the next Fed rate decision?
The next FOMC meeting takes place on 27 and 28 October 2026, without new projections. In that week the decision arrives at 7:00 pm Central European Time, because Europe has already put its clocks back while the United States has not. The next meeting with a dot plot is on 8 and 9 December 2026.
What is the difference between the Fed and the ECB?
The Fed steers US monetary policy with a single policy rate (the federal funds rate, currently 3.75 to 4.00%). The ECB works with three key rates for the euro area (deposit facility currently 2.50%). Both central banks raised rates in 2026: the ECB in June and September, the Fed on 16 September.
What does the Fed’s dot plot mean?
The dot plot shows the individual rate expectations of FOMC participants as dots on a chart. Each dot represents one member’s forecast for the policy rate at the end of the year. In September 2026 the median for the end of the year stands at 4.1%. In June only 18 of 19 participants had submitted a dot, because the new chair Kevin Warsh deliberately did not. The median of all dots is seen as the most important guide to the expected rate path.
What is the blackout period before the Fed rate decision?
The blackout period begins on the second Saturday before each FOMC meeting at 12:00 am Eastern Time. During this phase, FOMC members may not comment publicly on monetary policy. This matters for traders, because trading volume typically falls in this period and market participants prepare for the decision. It does not end with the rate decision, but only on the day after the meeting at 11:59 pm Eastern Time.
This article is based on official Federal Reserve sources, current market data and Karsten Kagels’ personal market assessment. It is not investment advice.
This article is translated from the German edition on kagels-trading.de.
More Central Banks guides
- Follow the euro
ECB Interest Rate Decision 2026: Dates and Latest Decision
Current ECB rates, every meeting date with times and what traders should watch.
- Follow the yen
BoJ Interest Rate Decision: Dates, Times and Japan's Rate
Bank of Japan meeting dates to the end of 2027 and how much the yen and the Nikkei move on BoJ days.
- Follow the British pound
Bank of England Interest Rate Decision: Dates and Times
Every MPC date to the end of 2027 with times, the named votes of 2026 and how much EUR/GBP moves on BoE days.
- Follow the Swiss franc
SNB Interest Rate Decision: Dates, Times and the Swiss Franc
SNB meeting dates to the end of 2027 with times, the latest decision and how much the franc moves on SNB days.
- Follow the Canadian dollar
Bank of Canada Interest Rate Decision: Dates and Times
Bank of Canada dates with times in New York and Europe, the latest decision and how much USD/CAD moves after BoC days.
- Follow the Australian dollar
RBA Interest Rate Decision: Dates, Times and the Aussie
RBA dates with the Monday-evening times in New York, the 2026 votes and how much the Australian dollar moves.
- Read Fed expectations
CME FedWatch Tool Explained: Forecasting Fed Rate Decisions
How FedWatch turns futures prices into rate probabilities, and how accurate it has been.