
Donchian Channel: Breakout Rules and a 20-Year ETF Test


Contents
- Donchian Channel in 30 seconds
- What is the Donchian Channel?
- How the Donchian Channel is calculated
- Buy and sell signals with the Donchian Channel
- My test: Donchian breakouts in SPY, GLD and TLT
- The right period: 20, 55 or shorter
- The Donchian Channel in the Turtle system
- Donchian Channel, Bollinger Bands and ATR: different inputs
- Advantages and disadvantages of the Donchian Channel
- Combining the Donchian Channel with other tools
- The Donchian Channel in TradingView
- My conclusion: simple does not mean easy to trade
- Frequently asked questions about the Donchian Channel
- About the author
The Donchian Channel may be the simplest indicator in technical analysis. It smooths nothing, weights nothing and needs no formula to remember. It draws two lines: the highest high and the lowest low of a set number of periods. That is its appeal, because a breakout from this channel is not an interpretation but a fact.
Most explanations stop there; this one puts numbers next to it. I tested close-confirmed breakout rules on three ETFs from 2006 to 2026: SPY for US stocks, GLD for gold and TLT for long-term Treasuries. The result contradicts the picture of a simple buy signal, and it shows clearly which settings and which trading direction carried the results. This article follows our editorial policy.
Donchian Channel in 30 seconds
- Two lines, no formula: the upper line is the highest high of the last N periods, the lower line the lowest low, the middle line the average of both. The common default is 20 periods.
- The signal is a breakout: a close above the upper line is a buy signal, a close below the lower line a sell signal. The classic exit is the opposite extreme of a shorter channel, often 10 periods.
- Most breakouts failed in my test: of 499 trades in three ETFs, 36.1% were winners. The average winner (+4.3%) was larger than the average loser (−2.5%), but the mean trade was about zero (−0.02%).
- Long beat short: long trades won in 44.4% of cases, short trades in 27.1%. In SPY only 21.1% of short trades won.
- The slower channel did better: with 55 periods for entry and 20 for exit, there were 236 trades and 41.9% winners.
What is the Donchian Channel?
The Donchian Channel is a technical indicator that draws the highest high and the lowest low of a set number of past periods as two lines on the chart.
Unlike almost every other indicator, it smooths nothing. It reads two extreme values from the price data and shows them. That answers one practical question: is the market trading outside its recent range? As long as price moves inside the channel, it is in known territory. When it breaks above or below, it enters new territory.
The indicator is named after Richard Donchian, a pioneer of managed futures. According to CME Group, he started the first publicly offered futures fund, Futures Inc., in 1949. His channel is still the clearest expression of the idea that a trend starts exactly where price leaves its previous range.
The channel is often linked to Turtle Trading, because Richard Dennis made breakout rules of this kind the core of his training experiment in the 1980s. Donchian and Dennis are two different people who are often mixed up: the channel is named after Donchian and his breakout idea, and Richard Dennis built a complete trading system around it with position sizes and risk rules.
How the Donchian Channel is calculated
The calculation needs a single parameter: the number of periods, N. Because only highs and lows are read, you can check the channel on any chart by hand. There is no weighting and no smoothing factor that could change the result. The Donchian Channels help of TradingView uses the same three lines:
- Upper line: the highest high of the last N periods. With N = 20 on a daily chart, the highest daily high of the past 20 sessions.
- Lower line: the lowest low of the last N periods.
- Middle line: the average of the upper and the lower line, (high + low) ÷ 2. It is the middle of the range, not an average of prices.
One detail decides whether your chart shows tradable signals at all. Some platforms include the current bar in the calculation, others do not. If the current bar is included, its close can never be above that bar’s own upper line, because the bar’s high is part of the highest high. A breakout rule then has to compare the close with the previous bar’s channel. In my charts and test, the channel is built from the N bars before the current bar. Check this setting on your platform before you trust a signal.
The second peculiarity is the step shape. The lines do not move every day; they jump when an old extreme drops out of the lookback window. The channel can narrow although nothing happened in the market, only because a high from 21 days ago no longer counts. If you do not know this, you may mistake such a jump for a market signal. It is just arithmetic.
Buy and sell signals with the Donchian Channel
A Donchian breakout is a close above the highest high or below the lowest low of the lookback period.
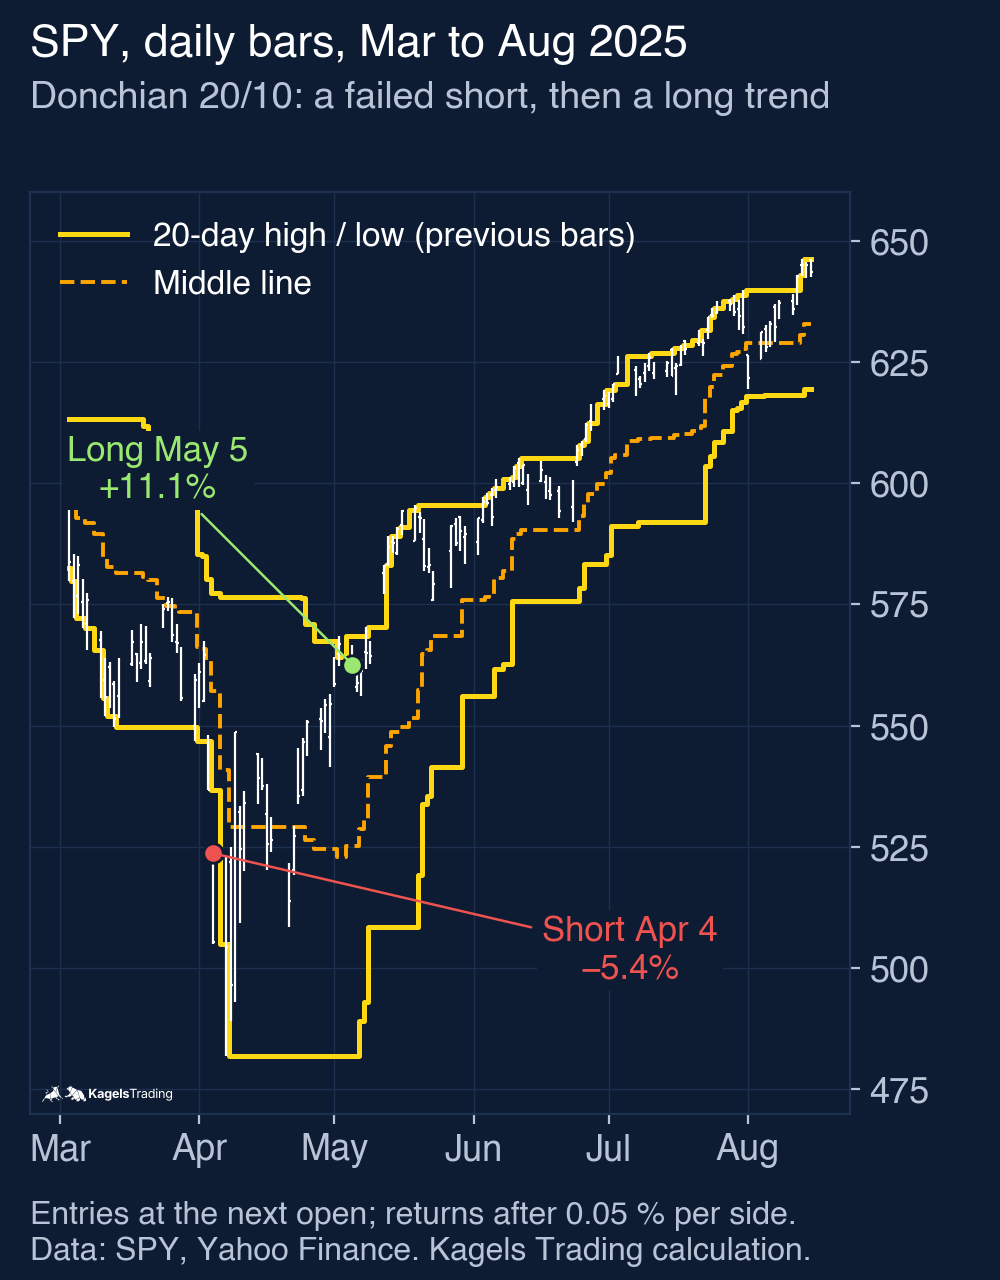
The close-confirmed reading fits into one sentence. A close above the upper line is a long entry; a close below the lower line is a short entry. In this version the close counts, not an intraday touch, so a wick that pokes above the channel and falls back does not trigger a trade. The original Turtles worked differently: they entered during the session as soon as price moved beyond the channel.
There are two common ways to exit. One uses a shorter channel in the other direction: a long position is closed when price closes below the low of the last 10 periods. The other uses the middle line as the limit. The short opposite channel lets trends run longer; the middle line gives back less profit but also ends good trades earlier. All numbers in this article use the first exit.
 Click to enlarge
The example from 2025 was chosen on purpose, and it is not a success story at first. During the April 2025 sell-off, SPY closed below its 20-day low and the rules went short at the open of April 4, 2025. The market then turned, and the short was closed on April 28 with a loss of 5.4%. The next signal, a long entry on May 5, ran until August 4 and gained 11.1%. Several losing signals followed by one that catches the trend: that is the normal pattern of trend following.
My test: Donchian breakouts in SPY, GLD and TLT
I wrote the rules down before I calculated anything, and I applied them unchanged to all three ETFs. The ETFs serve as stand-ins for US stocks (SPY), gold (GLD) and long-term Treasuries (TLT); they are not futures. Data: daily bars from Yahoo Finance from January 2006 to October 15, 2026, with real opening prices.
- Entry: a close above the highest high of the previous 20 sessions (long) or below their lowest low (short), only when no position is open.
- Exit: a close beyond the 10-session extreme in the other direction. No extra stop, no profit target.
- Execution: at the next session’s open, 0.05% cost per side, one position per ETF.
- Returns: price returns per trade in percent of the entry price. Dividends and short borrowing costs are not included, and I did not check whether shares could always be borrowed; leaving out dividends favours short trades in SPY and TLT and hurts long trades by an amount I did not measure. Open positions at the end are listed separately below.
 Click to enlarge
| Donchian 20/10, 2006 to 2026 | SPY | GLD | TLT | All three |
|---|---|---|---|---|
| Completed trades | 167 | 164 | 168 | 499 |
| Winning trades | 36.5% | 37.2% | 34.5% | 36.1% |
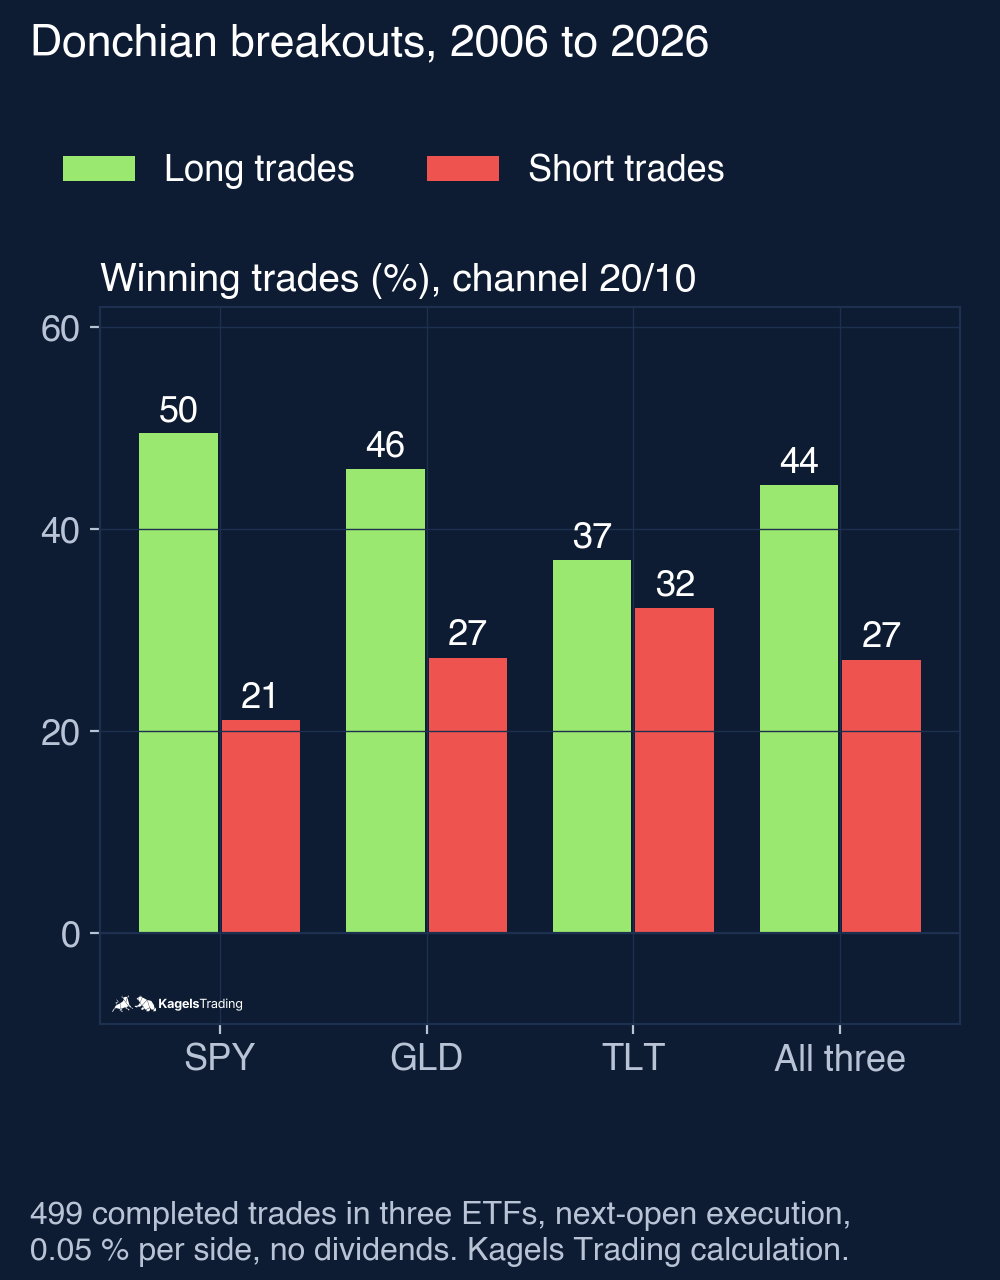
| Long trades, winners | 49.5% (91) | 46.0% (87) | 37.0% (81) | 44.4% (259) |
| Short trades, winners | 21.1% (76) | 27.3% (77) | 32.2% (87) | 27.1% (240) |
| Average winner / loser | +4.23% / −2.69% | +4.60% / −2.64% | +4.02% / −2.06% | +4.29% / −2.46% |
| Mean / median trade | −0.16% / −1.28% | +0.06% / −1.17% | +0.04% / −1.24% | −0.02% / −1.24% |
| Median holding period | 18 sessions | 15.5 | 18 | 17 |
Almost two out of three breakouts failed. Over all three ETFs, 36.1% of trades were winners. The size of the winners almost offset the many losses: on average +4.3% against −2.5% for the losers. The median trade was a loss of 1.2%, the mean trade −0.02%. Added up without compounding, the 499 trades came to −11.6 percentage points over almost 21 years, before taxes and with an assumed cost of 0.05% per side.
The most important finding is the direction, not the hit rate. The 259 long trades won in 44.4% of cases and added up to +205.5 percentage points. The 240 short trades won in only 27.1% and cost 217.0 percentage points. In SPY just 21.1% of short trades were winners; the worst trade of the 20/10 test was a SPY short from November 20 to December 9, 2008 with −12.9%. A stock index with a long-term upward drift produces many downside breakouts that are recovered within days. In TLT the two sides were much closer.
Breakout closes showed no consistent advantage in positive 21-session returns across these three ETFs. I also counted every SPY close above its previous 20-day high and looked 21 sessions ahead: the ETF was higher in 63.1% of cases (420 of 666), against 66.1% for any day (3,444 of 5,208); the median change was +1.00% against +1.46%. In GLD the two were about equal (56.1% against 55.9%). In TLT the share was lower too (45.9% against 48.9%). The system’s results came from a few long trends, not from the average breakout.
These numbers have limits. They come from three ETFs over one 21-year window, with overlapping signals and a simple cost assumption. They describe this sample; they do not prove that the rules work elsewhere or in the future. The best single trade was a GLD long from September 2007 to March 2008 with +30.9%.
Three positions were still open on October 15, 2026, and they are not in the tables. With 20/10, a SPY long from October 7 (−0.5% at the last close) and a GLD short from September 11 (+4.9%); with 55/20, a TLT short from August 3 (+2.8%). These are price changes before costs.
The right period: 20, 55 or shorter
The period sets how far price must run before it counts as a breakout. A short channel lies close to price and signals often. A long channel signals rarely, but on larger moves. The 20-period default is not a law of nature.
I planned one variant before calculating: 55 periods for entry and 20 for exit. These are the lengths of the Turtles’ System 2, and the results are in the table below.
| Donchian 55/20, 2006 to 2026 | SPY | GLD | TLT | All three |
|---|---|---|---|---|
| Completed trades | 86 | 78 | 72 | 236 |
| Winning trades | 41.9% | 38.5% | 45.8% | 41.9% |
| Long trades, winners | 49.1% (55) | 51.2% (43) | 42.1% (38) | 47.8% (136) |
| Short trades, winners | 29.0% (31) | 22.9% (35) | 50.0% (34) | 34.0% (100) |
| Mean trade | −0.18% | +0.29% | +0.60% | +0.21% |
| Median holding period | 35 sessions | 28 | 36.5 | 31.5 |
Fewer trades did better in this sample. The number of trades fell from 499 to 236, the share of winners rose from 36.1% to 41.9%, and the mean trade from −0.02% to +0.21%. The median holding period grew from 17 to 31.5 sessions. The price is a later entry: waiting for a 55-day high means you join a fast trend only after a good part of it has passed. In TLT the short side of the 55/20 channel even did better than the long side, so the direction effect is not the same in every market.
Time frames follow the same logic. For day trading on minute or hourly charts, short channels of 10 to 20 periods are common, because they react within the session. On daily charts, 20 to 55 periods is the usual range. A 52-period channel on a weekly chart shows new yearly highs and lows at a glance. These are conventions, not results of my test.
The Donchian Channel in the Turtle system
Turtle Trading is a rule-based trend-following system from 1983 that used channel breakouts for entries and sized positions by the market’s volatility.
The best-known use of the channel did not come from Donchian himself. Richard Dennis and William Eckhardt argued in 1983 about whether trading could be taught, and settled it with an experiment: they trained a group of beginners, later known as the Turtles. The rules they received were at their core a breakout system of this kind:
- System 1: entry on a 20-day breakout, exit at the 10-day opposite extreme. A signal was skipped if the previous breakout would have been a winner.
- System 2: entry on a 55-day breakout, exit at the 20-day opposite extreme. This signal was always taken.
- Risk instead of share count: position size came from the market’s volatility, measured with the average true range. Volatile markets got smaller positions.
My test is a close-confirmed adaptation that uses the Turtles’ lookback lengths, without their intraday entries, skip filter, position sizing and risk limits. That difference is the real point. The Turtles never traded the channel alone: the channel was the signal, the risk management was the system. The full rules are in the guide to Turtle Trading.
Donchian Channel, Bollinger Bands and ATR: different inputs
The three indicators use different inputs, so they react differently to the same chart. The Donchian Channel uses only the highest high and the lowest low of the lookback period, so its lines stay flat for days and then jump. The Bollinger Bands use the standard deviation of closes around a 20-period average, so they widen as soon as closes start to swing more.
The ATR is not a band at all but a single line below the chart. The average true range measures the typical daily range including gaps. In the Turtle rules it set the position size, while the channel set the entry; each guide has its own test on US data.
Advantages and disadvantages of the Donchian Channel
A false breakout at the Donchian Channel happens when price closes outside the channel and soon returns to its old range.
The channel has one clear strength and one clear weakness, and both come from the same property: it measures only extremes and knows nothing else about the market. The lists below draw on the 499 trades of my test.
What speaks for the Donchian Channel
- Unambiguous: a close is outside the channel or not. There is no room for interpretation.
- No repainting: built from completed bars, the channel does not change afterwards, which makes a backtest straightforward.
- One parameter: only the length is set, which limits curve fitting.
- Can catch large trends: an extended move usually sets new extremes, though a close-confirmed, flat-only rule can still miss parts of it. The best trade in my test gained 30.9%.
What speaks against the Donchian Channel
- Low hit rate: only 36.1% of trades won with the 20/10 rules. If you need a high win rate to stay with a system, this one is hard to follow.
- False signals in sideways markets: in narrow ranges the lines sit close to price and every larger bar triggers a signal.
- Late entry: a breakout signal comes after the move has started.
- Blind to direction: the channel treats long and short the same, but the short trades won only 27.1% of the time in my test.
Combining the Donchian Channel with other tools
The channel needs something that tells it when to stay quiet. It detects a breakout, but not whether a trend exists in which the breakout can continue. Three common ideas, none of which I tested here:
- A direction filter: a long moving average, for example 200 days, decides which side you trade at all. That is the most direct answer to the weak short side in my test.
- A trend-strength filter: an indicator such as the ADX allows breakouts only when a trend is present.
- A volatility-based stop: a stop at a multiple of the ATR adapts to calm and busy markets instead of a fixed percent.
Two tools that measure almost the same thing add little. A Donchian breakout confirmed by a breakout in a second price channel mostly repeats the same information. A filter is more likely to help when it answers a different question than the entry signal; I have not tested any of these combinations.
The Donchian Channel in TradingView
TradingView has the indicator built in as “Donchian Channels” (plural), with a default length of 20. The plural matters when you search for it in the indicator list. Check whether your platform includes the current bar, because that decides how a breakout must be defined. When we asked the TradingView AI to write a Donchian Channel in Pine Script, the bands were right but the breakout signal never fired; the details are in our TradingView AI Copilot test.
My conclusion: simple does not mean easy to trade
The Donchian Channel does exactly what it is built for. It shows reliably, and without room for interpretation, when a market leaves its recent range. As a display it is more honest than most indicators, because it smooths nothing and changes nothing afterwards.
My test also shows where its limit lies. With 36.1% winners and a mean trade of −0.02% before taxes, the bare 20/10 rules did not make money in this sample. The channel is a signal, not a method. A direction filter, a longer period or position-sizing rules are the obvious things to test next; the Turtles combined the channel with such rules.
I trade discretionarily myself, not a mechanical breakout system, and that is why I find the numbers the most useful part of this article. The channel marks the place where a market leaves its range. Whether the move carries on depends on the context, not on the line. If you start with it, choose the period on purpose and decide in advance which direction you trade.
This article is market analysis, not investment advice. Past results of a rule test do not show future results.
Frequently asked questions about the Donchian Channel
What is the Donchian Channel?
The Donchian Channel is an indicator that draws the highest high and the lowest low of a set number of past periods. Between them lies the middle line, the average of both. It smooths nothing; it reads pure extremes.
How is the Donchian Channel calculated?
You need only one parameter, the number of periods N. The upper line is the highest high of the last N periods, the lower line the lowest low, the middle line their average. Check whether your platform includes the current bar: if it does, compare the close with the previous bar’s channel to find a breakout.
Which period should I use for the Donchian Channel?
The default is 20, but it is only a default. In my test from 2006 to 2026, a 55-period entry with a 20-period exit had 41.9% winners against 36.1% for 20/10, with fewer trades and a longer holding period. Longer channels signal less often and later.
How reliable are Donchian Channel signals?
Not very, on their own. Of 499 breakout trades in SPY, GLD and TLT, 36.1% were winners. Average wins (+4.3%) were larger than losses (−2.5%), but not enough: the mean trade was about zero, and the short side was clearly weaker than the long side.
What is the difference between the Donchian Channel and Bollinger Bands?
They are built from different inputs. The Donchian Channel uses only past highs and lows, so it moves in steps. Bollinger Bands use the standard deviation of closes around an average, so they react to every change in volatility.
Is the Donchian Channel good for beginners?
It is easy to use, but hard to stick with. There is only one setting and the signals are clear. With a hit rate around one third, several losing trades in a row are normal, and changing the rules after them means missing the few large winners. Practise on a demo account first.
This English edition is based on our German edition on kagels-trading.de and has been adapted for international readers.
More Technical Indicators guides
- Judge a golden cross
Golden Cross: Definition and S&P 500 Test Results
How the 50-day and 200-day averages cross, and what 38 signals in the S&P 500 since 1950 did against the base rate and buy and hold.
- Use moving averages
Moving Averages: SMA, EMA and a 76-Year 200-Day Test
SMA, EMA and WMA formulas with a worked example, common periods, and what the 200-day line showed on the S&P 500 since 1950.
- Read the RSI
RSI Indicator: Formula, Settings and a 75-Year Test
The RSI formula, overbought and oversold, and what RSI signals did on the S&P 500 since 1951 against the base rate.
- Read volatility with Bollinger Bands
Bollinger Bands: Settings, Squeeze and a 76-Year Test
Settings, the three typical chart situations, five strategies with rules, and what the bands and the squeeze showed on the S&P 500 since 1950.
- Set stops with the ATR
ATR Indicator: Average True Range for Stops and Size
True range and Wilder smoothing, stop distance and position size, and how ATR stops behaved on SPY from 1994 to 2026 against a fixed stop.
- Read the MACD
MACD Indicator: Histogram, Divergence and a 31-Year Test
Formula, histogram, crossovers and divergences, with a 31-year test on the S&P 500 and the DAX against the base rate.
- Use VWAP
VWAP Indicator: Formula, Anchored VWAP and TradingView Setup
The VWAP formula, trend day versus range day, Anchored VWAP and the right settings in TradingView.