
Supertrend Indicator: Settings, Strategies and an ETF Test


Contents
- Supertrend in 30 seconds
- Who created the Supertrend?
- What is the Supertrend indicator?
- How the Supertrend is calculated
- How to read the Supertrend on the chart
- Supertrend settings for different time frames
- My test: Supertrend flips in SPY, QQQ and GLD
- Supertrend strategies
- End of day or day trading?
- The Supertrend in TradingView
- Common mistakes with the Supertrend
- Advantages and disadvantages of the Supertrend
- Alternatives to the Supertrend
- My conclusion: a good trailing stop, a weak signal
- Frequently asked questions about the Supertrend
- About the author
Hundreds of trend-following scripts are available on TradingView alone, and almost every one promises entry and exit in the same picture. The Supertrend is one of the few that has lasted for years. It draws a single line on the chart, switches side and colour when the trend breaks, and so gives you a signal and a stop in one.
That simplicity is its strength and at the same time its biggest trap. In clean trends the indicator looks brilliant. In sideways phases the same line keeps flipping, and clear signals turn into a series of false ones. I tested the plain flip rules on three US ETFs since 1993, and the result shows which side of the trade carried the results. This article follows our editorial policy.
Supertrend in 30 seconds
- What it is: a trend-following indicator that combines the average true range with a factor and draws one line below or above price.
- One line, two states: below price (usually green) it shows an uptrend, above price (usually red) a downtrend. A flip of the line at the close is the signal.
- Two settings: an ATR length and a factor. The most common combination, and the one I tested, is 10 and 3.
- The line never moves against the trend: in an uptrend it can only rise or stay flat, so many traders use it as a trailing stop.
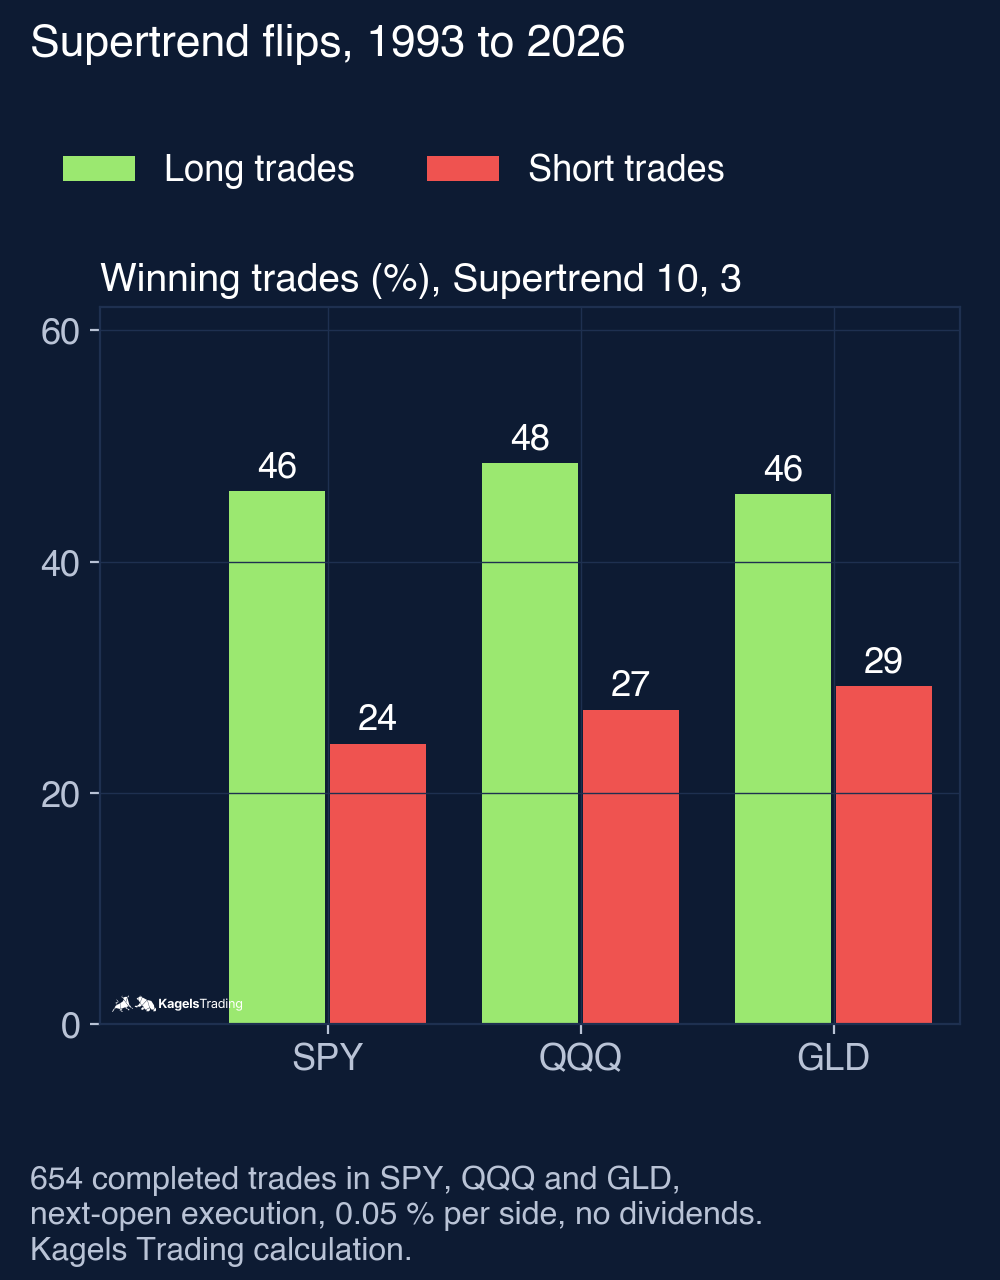
- My test: 654 flip trades in SPY, QQQ and GLD won in 36.7% of cases, and the mean trade was about zero. Long trades won 46 to 49% of the time, short trades only 24 to 29%.
Who created the Supertrend?
The Supertrend is credited to the French trader and author Olivier Seban. The TradingView help page on the Supertrend names him as its creator. Seban became known mainly for books on building wealth, not as an indicator developer.
The indicator spread through charting platforms, not through a textbook. That explains why there is no single canonical version and why the defaults differ between providers. If you open the same chart on two platforms, you may see two different lines with the same name, because the settings or the ATR smoothing differ. Check yours before you compare signals.
What is the Supertrend indicator?
The Supertrend is a volatility-based trend-following indicator that calculates a single line from the average true range and a fixed factor. As long as price stays above the line, the trend counts as up. When price closes below it, the line switches to the other side of price and signals a downtrend.
Its base is two quantities: the middle of the bar and its volatility. The middle is (high + low) ÷ 2. The volatility is the average true range, which measures the typical size of a bar including gaps. It says nothing about direction, only about how large the moves are.
Gaps are part of the calculation. Jumps between one close and the next bar’s range enter through the true range. For stocks with overnight gaps that gives a more realistic picture than a plain high-low comparison, and it is one reason the line can jump after a large opening gap.
Internally, the indicator calculates two bands; only one is visible at a time. In an uptrend you see the lower band, which acts as support. In a downtrend you see the upper band, which acts as resistance. When price closes through the active band, the line switches sides: support becomes resistance, and the indicator reports a trend change. That switch is the signal all Supertrend strategies revolve around.
How the Supertrend is calculated
The calculation has three steps: true range, the ATR from it, and the two bands. The guide to the ATR explains the true range and the ATR in detail; here is the short version.
- True range: the largest of three distances: high minus low, the distance from the previous close to today’s high, and from the previous close to today’s low.
- ATR: the average of the true range over the chosen period, smoothed in the way J. Welles Wilder described. It is recursive: with a period of 10, today’s ATR is 0.9 × yesterday’s ATR plus 0.1 × today’s true range, so older bars keep a slowly shrinking weight.
- Bands: upper band = (high + low) ÷ 2 + factor × ATR; lower band = (high + low) ÷ 2 − factor × ATR.
Then comes the rule that makes the line a stop. In an uptrend the lower band may rise but never fall: if the new value would be lower than yesterday’s, yesterday’s value stays. In a downtrend the upper band may fall but never rise. The line flips only when the close crosses the active band. That is why the line looks like a staircase.
The factor decides how fast the indicator is. A high factor pushes the line far away from price: it flips less often and holds trends longer. A low factor pulls it close to price and makes it more sensitive, but also more prone to false signals. The period works in the same direction through the volatility: a long period smooths the ATR, a short one reacts more to single large bars.
How to read the Supertrend on the chart
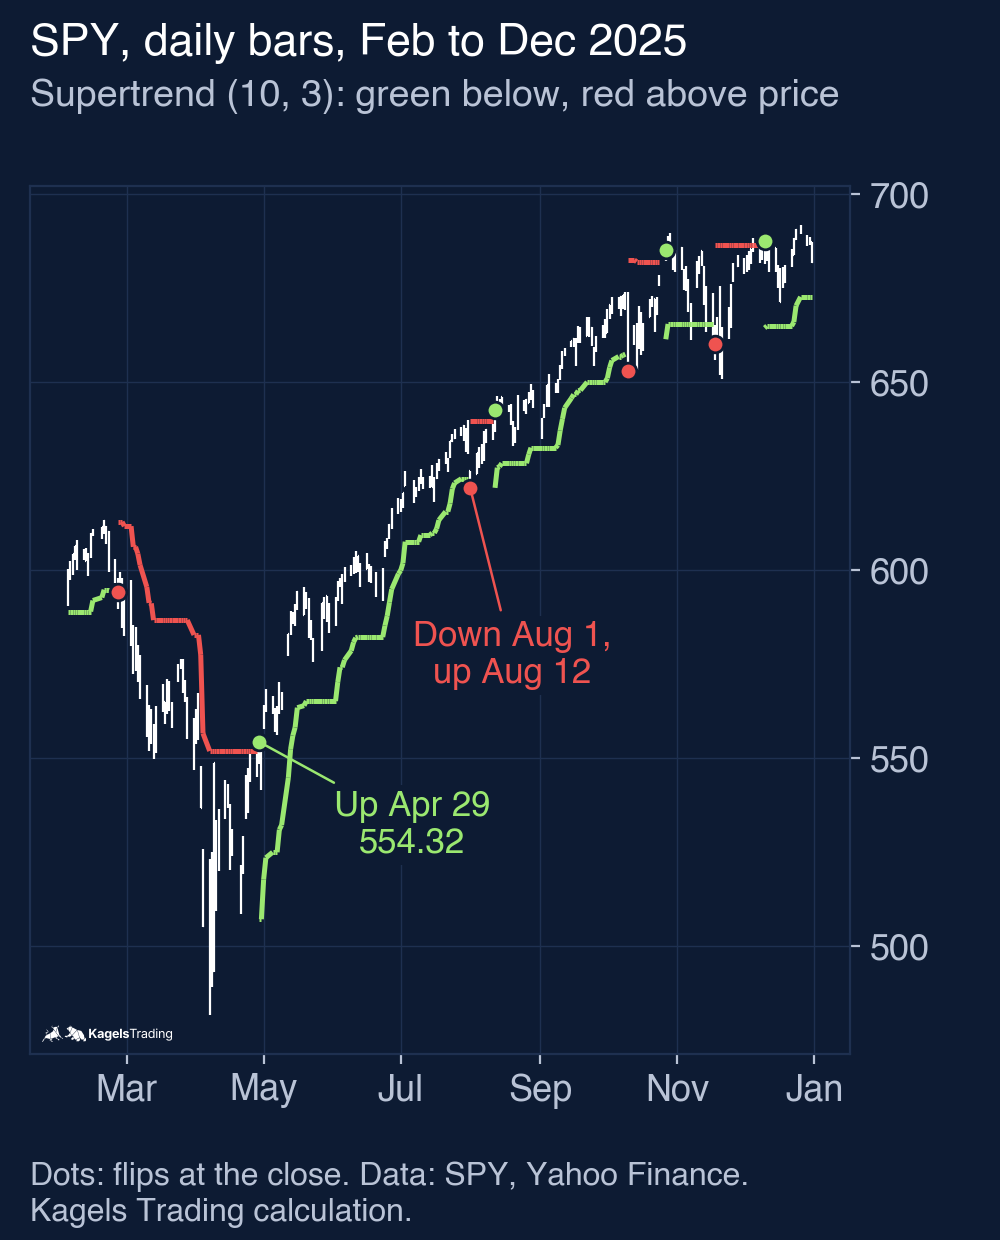
On the chart, the Supertrend is a line that changes sides. It follows price at a distance and jumps to the other side when it is broken. Below price means uptrend, the line works as support; above price means downtrend, the line works as resistance. The colour changes with it, on most platforms from green to red and back.
 Click to enlarge
A trend change happens only when a close breaks the line. A brief touch during the bar does not count. If you act during the bar, you trade signals that may no longer exist at the close. On a daily chart that means: wait for the daily close and act on the next session at the earliest.
Because the indicator reacts to the ATR, its distance from price keeps changing. In volatile markets the line moves far away and gives the move room; in a calm market it moves close. That is what makes it useful as a stop. The price is the problem of every trend follower: the Supertrend works with past data and shows a trend change only after it has happened. It is not a leading indicator.
In low volatility something happens that many beginners overlook. The line then simply runs flat, because the ATR measures hardly any movement. The indicator keeps showing a trend although the market is stuck in a range.
Supertrend settings for different time frames
The question about settings is searched more often than the formula. The most common combination is an ATR length of 10 and a factor of 3, and it is the one I tested; the TradingView help names no defaults, so check what your platform sets in its settings window. The table shows starting points that are common in practice; they are illustrations, not test results, and need testing on your own market.
| Time frame | ATR length / factor | Typical use |
|---|---|---|
| 5 to 15 minutes | 7 / 2 to 10 / 2 | Day trading in clear intraday trends, many signals |
| 1 to 4 hours | 10 / 3 | Swing entries, a balance between signals and calm |
| Daily chart | 10 / 3 to 14 / 3 | End-of-day trading, few clear signals |
| Weekly chart | 10 / 4 and higher | Position trading, holds long trends, ignores pullbacks |
The usual reasoning behind the table is simple. On short time frames traders often lower the factor to get signals at all; on long time frames they raise it so that normal pullbacks do not end the trade. My test covers daily bars only, so this is practice, not a measured rule. Markets with wide daily ranges, such as commodities and crypto, often need more room than calm large-cap stocks.
Test the values on your own market, not on a sample chart. A backtest on the platform takes a few minutes; our guide to TradingView backtesting shows how to set it up. What you should not do is turn the dials until the past looks perfect. That overfitting produces values that fit exactly the tested period and fall apart afterwards; I tested factor 2 and 4 as variants below, decided before I calculated, and the difference is large.
My test: Supertrend flips in SPY, QQQ and GLD
I wrote the rules down before calculating and applied them unchanged to three ETFs. SPY stands for the S&P 500, QQQ for the Nasdaq 100 and GLD for gold. Data: daily bars from Yahoo Finance up to October 15, 2026, with real opening prices. The test starts on the first day for which the indicator and a 200-day average both exist: November 1993 for SPY, December 1999 for QQQ and September 2005 for GLD.
- Indicator: Supertrend with ATR length 10 and factor 3, calculated like TradingView’s built-in version.
- Signal: a flip of the line at the close.
- Execution: at the next session’s open, 0.05% cost per side. In the long/short version every flip reverses the position; in the long-only version you are in cash after a down flip.
- Returns: price returns per trade, without dividends and without short borrowing costs. Leaving out dividends helps the short trades and hurts the long ones by an amount I did not measure.
The line flipped about eight times a year in the stock ETFs and nine times in gold. SPY had 257 flips in almost 33 years (7.8 a year), QQQ 7.7 a year and GLD 9.1. SPY spent 59.9% of the days in an uptrend, GLD 51.4%. The median uptrend phase lasted 29.5 sessions in SPY, the median downtrend phase 22.
 Click to enlarge
| Supertrend 10, 3, long and short | SPY | QQQ | GLD | All three |
|---|---|---|---|---|
| Completed trades | 256 | 206 | 192 | 654 |
| Winning trades | 35.2% | 37.9% | 37.5% | 36.7% |
| Long trades, winners | 46.1% (128) | 48.5% (103) | 45.8% (96) | |
| Short trades, winners | 24.2% (128) | 27.2% (103) | 29.2% (96) | |
| Average winner / loser | +5.56% / −3.05% | +7.89% / −4.45% | +5.11% / −3.37% | +6.18% / −3.57% |
| Mean / median trade | −0.02% / −1.56% | +0.22% / −1.68% | −0.19% / −1.45% | +0.01% / −1.58% |
| Sum of trades (not compounded) | −5.5 pp | +45.6 pp | −36.2 pp | +3.9 pp |
Almost two out of three flip trades lost money. Over all three ETFs, 36.7% of trades were winners. The winners were larger than the losers (+6.2% against −3.6% on average), which almost exactly offset the many losses: the mean trade was +0.01%, the median trade a loss of 1.6%. Added up without compounding, the 654 trades came to +3.9 percentage points in total over up to 33 years, before taxes.
The direction made the difference. The long trades won in 46 to 49% of cases and added up to +158.6 (SPY), +170.2 (QQQ) and +103.7 percentage points (GLD). The short trades won in only 24 to 29% of cases and cost −164.1, −124.6 and −139.8 percentage points. The same split showed up in my Donchian Channel test: in markets that rise over the long run, downside breakouts are often recovered quickly.
Long-only was the better version, but it did not beat buying and holding. If you trade only the up flips and stay in cash after a down flip, SPY grew by 4.3% a year against 8.9% for buy and hold, with a largest drawdown of 32.7% against 56.5%. QQQ: 5.3% a year against 8.1%, drawdown 48.2% against 83.0%. GLD: 4.2% a year against 10.7%, drawdown 27.3% against 45.6%. The system was invested 51 to 60% of the time; it gave up a lot of return for a smaller drawdown. Both sides are calculated on price only, with cash earning nothing.
A flip on its own said little about the next month. After an up flip, SPY was higher 21 sessions later in 67.2% of cases (86 of 128), against 64.2% for any day; QQQ 65.0% against 62.1%; GLD 58.3% against 56.3%. After a down flip, SPY was lower in 34.4% of cases, slightly less often than on any day (35.7%). The windows overlap and the samples are small, so these small differences are descriptive, not proof of an edge.
Some positions were still open on October 15, 2026, and they are not in the tables. In the long/short version: a SPY long from October 7 (−0.6% at the last close), a QQQ short from October 15 (−1.4%) and a GLD short from September 2 (+4.2%).
The variants: factor 2, factor 4 and a 200-day filter
I planned three variants before calculating, and all of them are reported here. A lower factor means more flips, a higher factor fewer. The filter variant takes only up flips when the close is above the 200-day moving average.
| Variant (all three ETFs) | Flips per year (SPY / QQQ / GLD) | Long/short: trades, winners, mean | Long-only, % a year (SPY / QQQ / GLD) |
|---|---|---|---|
| Factor 3 (default) | 7.8 / 7.7 / 9.1 | 654, 36.7%, +0.01% | 4.3 / 5.3 / 4.2 |
| Factor 2 | 14.2 / 13.5 / 16.2 | 1,172, 36.5%, −0.02% | 3.1 / 5.5 / 4.1 |
| Factor 4 | 5.1 / 4.7 / 5.6 | 409, 40.1%, +0.58% | 3.9 / 7.4 / 7.7 |
| Factor 3, long only above the 200-day line | 2.3 / 4.6 / 3.5 | ||
| Buy and hold, for comparison | 8.9 / 8.1 / 10.7 |
The slower factor 4 did best in this sample, and that is exactly where caution starts. With factor 4 the long/short trades won 40.1% of the time and the mean trade rose to +0.58%; long-only reached 7.4% a year in QQQ and 7.7% in GLD, but still less than buy and hold in all three ETFs. Factor 2 doubled the number of flips; it lowered the long-only return in SPY and GLD and raised it slightly in QQQ (5.5% against 5.3% a year). One sample and three ETFs cannot tell you that factor 4 will be better next time; I have not checked it on a separate later period.
The 200-day filter did not make the long-only system better. It cut the time in the market to 32 to 46% and the largest drawdown in SPY to 24.5% and in QQQ to 39.4%, but in GLD the drawdown rose to 30.6% (from 27.3%), and the yearly return fell in all three, to 2.3% in SPY. The filter removed some bad trades and many good ones. The long/short numbers are unchanged with the filter, because it applies only to entries in the long-only version.
 Click to enlarge
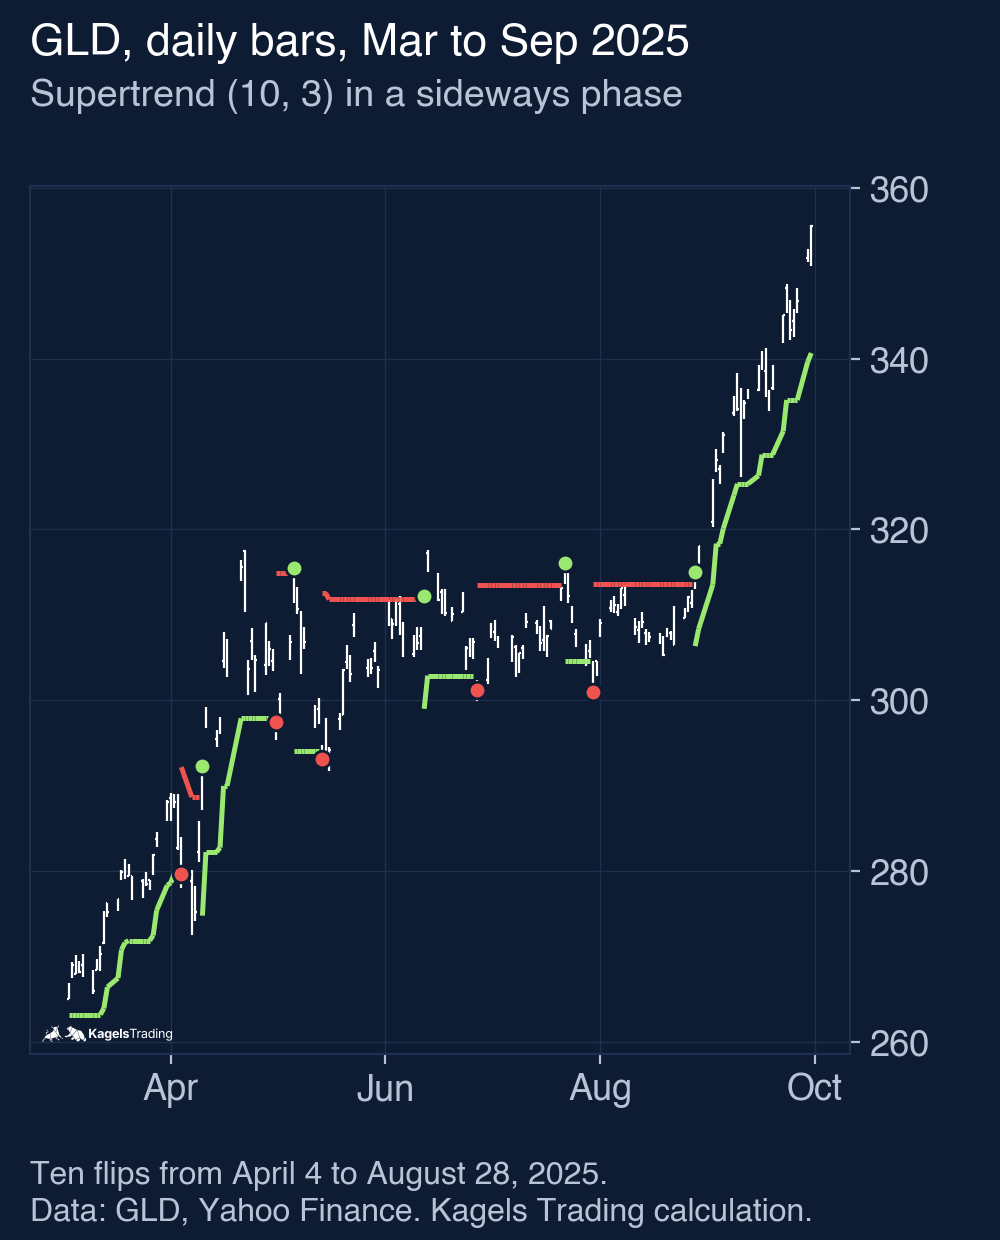
The gold chart of 2025 shows the weak spot in one picture. Between April 4 and August 28, 2025, GLD moved sideways between about $300 and $320 and the line flipped ten times. Every flip was a trade, and most of them were small losses. The up flip of August 28 then caught a rise of more than 15% in a month. Many small losses and a few large winners: that is the normal pattern of a trend follower, and you need to be able to sit through it.
Supertrend strategies
The indicator gives signals, not trading rules. When you enter, where the stop is and when you exit is decided by the strategy around it. These are the common approaches; apart from the plain flip and the 200-day filter above, I have not tested them.
The trend-change strategy
The simplest version uses the flip of the line as the signal. On a daily chart the bar must close beyond the line; a break during the bar is not enough. The entry comes on the next day, the stop sits at the line. For a short it works the other way round: price closes below the green line, the line turns red, the short follows and the stop sits above the line. My test used closing flips and next-open execution without a separate stop order; placing a stop at the line is a different, untested version. Either way it works only in trending markets.
Breakout strategy with the Donchian Channel
The second version separates direction and trigger. The Supertrend only sets the allowed direction: above the green line only long setups, below the red line only short setups. The trigger comes from the middle line of the Donchian Channel, for example when two bars in a row close beyond it. The drawback is a double delay: first you wait for the Supertrend, then for the breakout bars.
The Supertrend as a trailing stop
In my experience the most convincing use has nothing to do with entries. A trailing stop is a stop-loss that follows price in the direction of the profit but never moves back. The Supertrend line behaves exactly like that: in an uptrend it can only rise or stay flat. So it protects open profits without you having to move the stop by hand, however you got into the trade.
The period and the factor set how tight the stop runs. A low factor keeps it close to price and takes small moves early; a high factor gives the trade more room and allows larger pullbacks. Because the line is built from the ATR, it is at its core a volatility-based stop; how to calculate such a stop directly is shown in the ATR guide, and how to turn the stop distance into a position size in the guide to position sizing.
Filters: moving average, RSI and MACD
A second filter in front reduces the number of signals. With a moving average as the filter, a long setup needs both: the Supertrend shows an uptrend and the close is above the average. My 200-day filter test above shows the trade-off: fewer trades, smaller drawdowns in SPY and QQQ but a larger one in GLD, and in this sample a lower return in all three.
A momentum check can catch signals that look right but have no force behind them. With the RSI, a simple rule is enough: a long flip counts only with the RSI above 50, a short flip only below 50. The MACD works more coarsely: the signal counts when the MACD line is on the same side of zero as the Supertrend direction. More than one trend filter and one momentum filter rarely helps; each extra filter removes signals until hardly any are left.
End of day or day trading?
The Supertrend fits end-of-day trading, because the signal only forms at the close anyway. You check your charts once in the evening and place the order for the next day. You do not need to watch the market all day, which matters for anyone with a job. On the daily chart, a lot of short-term noise also disappears in the close.
In day trading the indicator works too, but it needs an extra check. You must make sure the market is not in a range, otherwise the Supertrend produces a chain of false signals on small time frames. That is why a look at the higher time frame pays off: if you trade the 5-minute chart, check the hourly or daily chart first and trade only in its direction. This check takes seconds and avoids many trades against the bigger trend.
The Supertrend in TradingView
In TradingView the Supertrend is a built-in indicator; you need no external script. Click “Indicators” at the top, type “Supertrend” into the search and choose the built-in entry. The indicator appears directly on the price chart, without an extra pane below.
The gear icon next to the indicator name opens the settings. Under “Inputs” you find the two values that matter, the ATR length and the factor. The “Style” tab sets the colours and the background fill; on dark charts it is worth adjusting the colours for readability. The “Visibility” tab lets you show the indicator only on certain time frames, which keeps a multi-timeframe setup clean. If you run several indicators at once, check how many your plan allows per chart.
Common mistakes with the Supertrend
The mistakes made with this indicator repeat themselves. Most of them come from reading the line as more than it is: a description of the trend so far, not a forecast.
- Trading before the close: the line moves during the bar. Only the close decides; if you act earlier, you trade signals that may vanish.
- Trading on in a range: if the line runs flat and flips several times in a short time, the market is moving sideways. The indicator cannot show that; you have to see it yourself.
- Optimising the settings on the past: turning period and factor until the old chart looks perfect builds an overfit that falls apart in live trading.
- Reading it as a forecast: a colour change states what has happened, not what will happen.
- Oversized positions: even a clean signal does not justify a large position. With a hit rate around 37% in my test, losing streaks are normal; see our guide to risk management.
Advantages and disadvantages of the Supertrend
Both sides come from the same construction: one line, two states, built from the ATR. The points below draw on my test where a number is given; the rest describes how the indicator works.
What speaks for the Supertrend
- Gaps included: through the true range the indicator captures gaps that a plain high-low calculation misses.
- Easy to read: below or above price, green or red, no second scale below the chart.
- Signal and stop in one tool: the line gives the entry and a stop level at the same time.
- Adapts to volatility: when the swings grow, the line moves further away by itself.
- Smaller drawdowns long-only: in my test the long-only version cut the largest drawdown in all three ETFs, for example from 56.5% to 32.7% in SPY.
What speaks against the Supertrend
- False signals in sideways phases: in GLD the line flipped ten times between April and August 2025.
- Lagging by design: it reports a trend change only after the close; part of the move is already over.
- Only two states: it knows up or down; a trendless phase cannot be shown.
- Not a system on its own: 654 flip trades won 36.7% of the time with a mean of about zero, and long-only earned less than buy and hold in all three ETFs.
- Weak short side: short trades won only 24 to 29% of the time in my test.
Alternatives to the Supertrend
If the false signals bother you, related tools behave differently. All of them make a running trend visible, but they go about it in different ways, and none removes the basic trade-off between reaction speed and false signals.
- Parabolic SAR: dots instead of a line, accelerating in the trend. It also knows only two states and has the same range weakness.
- Moving averages: calmer and slower. Fewer signals and fewer false breakouts, but no stop level.
- Donchian Channel: a pure breakout indicator without a volatility calculation; it shows the highs and lows of a period instead of a trend direction.
- Ichimoku: trend, support and momentum in one picture, but much more complex and it takes time to learn.
- Heikin-Ashi charts: not an indicator but a smoothed way of drawing bars, often used together with the Supertrend to reduce noise.
If you trade purely on price action, you need none of these. I trade discretionarily myself and read structure and key levels directly on the chart; the guide to price action trading describes that approach. If you make only a few trades a month, a simple moving average may serve you just as well as a Supertrend.
My conclusion: a good trailing stop, a weak signal
The Supertrend is a good tool with a misleading name. What it does, it does cleanly: it shows the running trend direction clearly and gives you a stop level at the same time. Otherwise you would need two indicators for that.
What it cannot do is just as clear. In sideways phases it produces false signals in series, and it always follows the move. In my test the plain flip system on three ETFs came to a mean trade of about zero, the short side lost clearly, and even the long-only version earned less than buy and hold, although with smaller drawdowns.
In my experience its strongest role is not the entry but the trailing stop; that is a practical judgement, not a test result. In that role its construction plays to its strength: the line never moves back, adapts to volatility and needs no manual adjustment. For the entry, never use it alone; decide the direction first and keep the risk per trade small.
This article is market analysis, not investment advice. Past results of a rule test do not show future results.
Frequently asked questions about the Supertrend
What is the Supertrend indicator?
The Supertrend is a trend-following indicator that calculates a single line from the average true range and a factor. Below price the line shows an uptrend, above price a downtrend. A flip of the line at the close counts as the signal.
What are the best Supertrend settings?
The most common setting is an ATR length of 10 and a factor of 3, and it is the one I tested on daily charts. On small intraday time frames traders often use a factor around 2, on weekly charts 4 or more. In my test factor 4 did better than 3 and 2, but in one sample only, so test your own market before you change the default.
Does the Supertrend have a signal line?
No, it draws only one visible line. Internally it calculates two bands, but it shows only the active one. The line changes side and colour when the trend breaks; there is no second signal line as in the MACD.
How reliable are Supertrend signals?
On their own, not very. In my test 654 flip trades in SPY, QQQ and GLD won 36.7% of the time, and the mean trade was about zero after costs. Long trades did clearly better than short trades, and the long-only version had smaller drawdowns than buy and hold but also a lower return.
Why does the Supertrend give so many false signals?
Because it knows only two states, up and down. It cannot show a trendless phase as such. When volatility is low and price moves sideways, the line flips at every small move, as in GLD between April and August 2025, when it flipped ten times.
Can I use the Supertrend as a stop-loss?
Yes, and that is the use I find most convincing. In an uptrend the line can only rise or stay flat, so it works as a trailing stop that follows profits without manual work. The factor sets how much room the trade gets; a higher factor gives more room and allows larger pullbacks.
This English edition is based on our German edition on kagels-trading.de and has been adapted for international readers.
More Technical Indicators guides
- Judge a golden cross
Golden Cross: Definition and S&P 500 Test Results
How the 50-day and 200-day averages cross, and what 38 signals in the S&P 500 since 1950 did against the base rate and buy and hold.
- Judge a death cross
Death Cross: What 38 S&P 500 Signals Since 1950 Show
How deep the S&P 500 fell after 38 death crosses since 1950, how late the signal comes, and what shorting it on SPY did since 1993.
- Use moving averages
Moving Averages: SMA, EMA and a 76-Year 200-Day Test
SMA, EMA and WMA formulas with a worked example, common periods, and what the 200-day line showed on the S&P 500 since 1950.
- Read the Ichimoku Cloud
Ichimoku Cloud: The Five Lines and a US ETF Test
The five lines and the cloud, how traders read the Tenkan/Kijun cross, and what the cloud and the crosses did in SPY (since 1993), QQQ and GLD.
- Measure trend strength with the ADX
ADX Indicator: What Trend Strength Really Tells You
How +DI, −DI and the ADX are calculated, what 20 and 25 mean, and whether a high ADX meant the trend went on in SPY, QQQ and GLD.
- Read the RSI
RSI Indicator: Formula, Settings and a 75-Year Test
The RSI formula, overbought and oversold, and what RSI signals did on the S&P 500 since 1951 against the base rate.
- Read volatility with Bollinger Bands
Bollinger Bands: Settings, Squeeze and a 76-Year Test
Settings, the three typical chart situations, five strategies with rules, and what the bands and the squeeze showed on the S&P 500 since 1950.
- Set stops with the ATR
ATR Indicator: Average True Range for Stops and Size
True range and Wilder smoothing, stop distance and position size, and how ATR stops behaved on SPY from 1994 to 2026 against a fixed stop.
- Trade Donchian breakouts
Donchian Channel: Breakout Rules and a 20-Year ETF Test
Channel rules, the current-bar pitfall, the Turtle systems, and what 499 breakout trades in SPY, GLD and TLT from 2006 to 2026 showed.
- Read the Stochastic
Stochastic Oscillator: Settings, Signals and a 30-Year Test
The %K and %D formula, what 14, 3, 3 means, fast versus slow, and what 785 oversold signals in SPY, QQQ and GLD did against the base rate.
- Judge a divergence
Divergence Trading: Regular and Hidden Divergence Tested
Regular and hidden, bullish and bearish divergences, when they are confirmed, and what 447 RSI divergences detected in SPY, QQQ and GLD did against the base rate.
- Read the MACD
MACD Indicator: Histogram, Divergence and a 31-Year Test
Formula, histogram, crossovers and divergences, with a 31-year test on the S&P 500 and the DAX against the base rate.
- Use VWAP
VWAP Indicator: Formula, Anchored VWAP and TradingView Setup
The VWAP formula, trend day versus range day, Anchored VWAP and the right settings in TradingView.