
Volatility Stop Loss: ATR Trailing Stops and 8 Methods


Contents
- Volatility stop loss in 30 seconds
- What is a volatility stop loss?
- How a volatility stop is built: measure, multiple, anchor
- Eight volatility stop methods compared
- Four volatility stops on one SPY trade in 2026
- Intraday or close: when should the stop trigger?
- Advantages and disadvantages of volatility stops
- How to use volatility stops sensibly
- My conclusion: the anchor matters as much as the multiple
- Frequently asked questions about volatility stops
- About the author
A volatility stop loss sets the distance to your stop from how much the market is moving right now, not from how much you would like to lose. That makes the stop wider in a busy market and tighter in a quiet one. Every version of the idea is built from the same three parts: a volatility measure, a multiple and an anchor price.
The framework in this guide goes back to Galen Woods, the price action trader behind Trading Setups Review. His article The Ultimate Guide to Volatility Stop-Losses sorts eight methods by those three parts. I explain each method, show four of them on the same SPY trade in 2026 and measured one detail that most guides skip: whether the stop should trigger during the day or only on the close. This article follows our editorial policy.
Volatility stop loss in 30 seconds
- Three parts: a volatility measure (usually the ATR or the standard deviation), a safety multiple and a price anchor. Distance = measure × multiple, placed below the anchor for a long trade.
- It adapts: the stop moves further away when the market gets more volatile and closer when it calms down. A fixed stop does neither.
- Eight methods: Chandelier Exit, Bollinger Bands, Keltner Channel, Kase’s DevStop, Kaufman’s volatility stop, Elder’s SafeZone, Bulkowski’s beta stop and the Parabolic SAR.
- The anchor matters: on SPY in April 2026 a Chandelier Exit was hit the day after entry, while the Keltner and Bollinger stops held for two months.
- Trigger choice: in my SPY test, waiting for the close avoided 16.4% of intraday stop-outs, but when the close did break, the worst loss was 4.49 R instead of 2.62 R.
What is a volatility stop loss?
A volatility stop loss is a stop whose distance from the price is a multiple of a volatility measure, such as the Average True Range, so that the stop adapts to how far the market currently moves.
The idea solves a balancing problem that every trader knows. A stop that is too tight is hit by normal market noise before the trade can work. A stop that is too wide risks more than the idea is worth. Volatility gives a neutral ruler for the distance: in a market that moves 10 dollars a day, a 3-dollar stop is noise, in a market that moves 2 dollars a day it is not. What a stop-loss order is and which order types carry it is covered in the guide to the stop-loss order.
How a volatility stop is built: measure, multiple, anchor
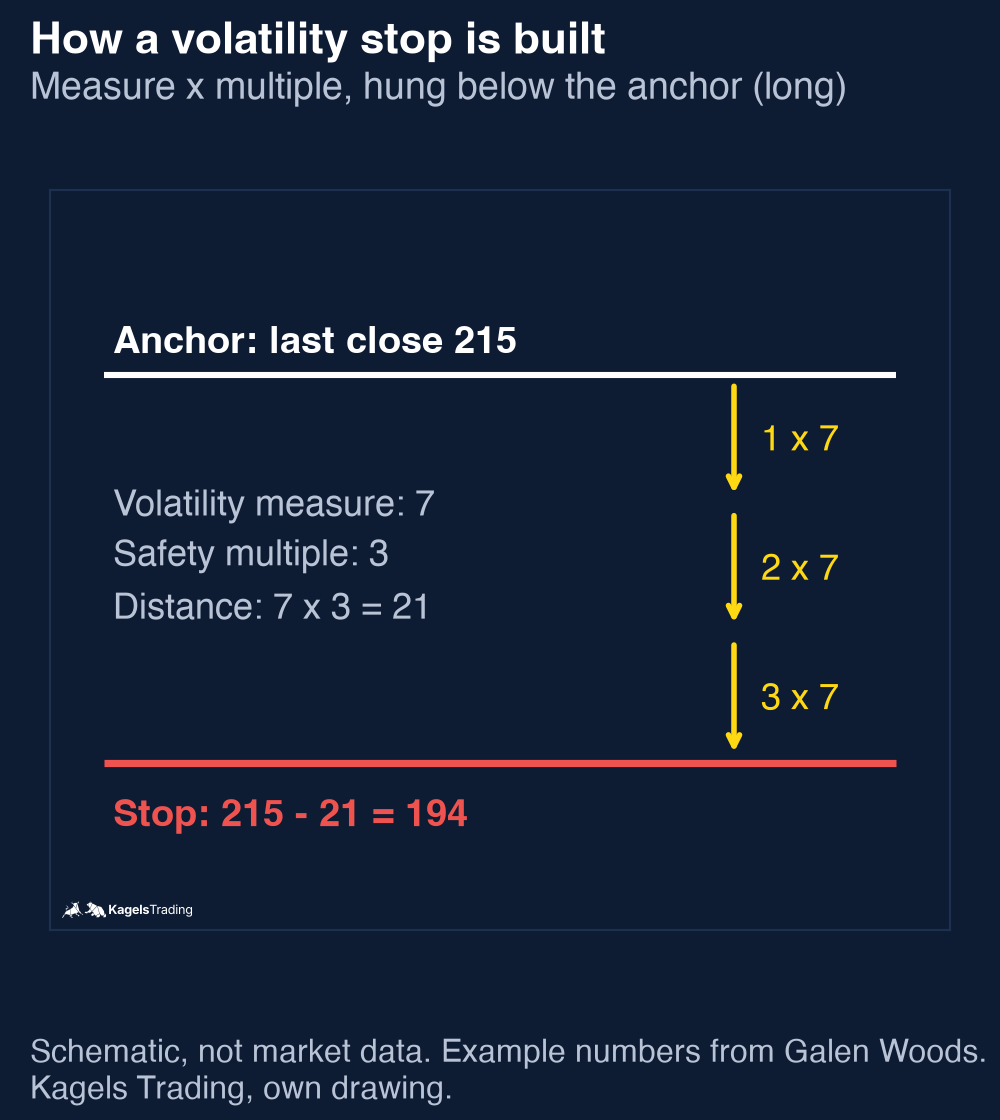
Galen Woods reduces every volatility stop to three inputs, and the arithmetic is simple. You take a volatility measure, multiply it by a safety multiple and project the result from an anchor price. His example: a measure of 7 times a multiple of 3 gives a distance of 21; from a last close of 215, the stop for a long trade sits at 194. For a short trade you add the distance instead.
 Click to enlarge
The volatility measure: ATR or standard deviation
Two measures dominate: the Average True Range and the standard deviation. The ATR, introduced by J. Welles Wilder in 1978, averages the true range, which counts the overnight gap from the previous close. The standard deviation measures how widely prices scatter around their average; it is the measure behind Bollinger Bands. How the ATR is calculated and why its smoothing matters is explained in the guide to the ATR indicator.
Both measures look backward, which is their built-in limit. They describe the volatility of the last weeks, not of tomorrow. A forward-looking view comes from the options market: the VIX shows the volatility that traders expect for the S&P 500 over the next 30 days. It does not set a stop for a single stock, but it shows when the historical measure may be about to go stale.
The safety multiple
The multiple is the only input that is truly your choice, and it decides how aggressive the stop is. A low multiple gives a tight stop: you value risk control over room to breathe. A high multiple gives the trade more room and costs more when the stop is hit. Multiples of 2 and 3 are common starting points for ATR stops.
A good multiple fits the type of trade. A long trend-following trade needs room and suits a higher multiple; a breakout that should work quickly suits a lower one. With position sizing the planned loss in dollars can stay the same either way: a wider stop simply means fewer shares.
The price anchor
The anchor is the price from which you measure the distance, and the same distance gives very different stops from different anchors. Common anchors are the close, the high or low of a bar, or a moving average. For a long trade, measuring from the bar’s high gives a tighter stop than measuring from its low.
The close is a sensible default for a stop that is recalculated after every bar. Traders who want a smoother line use a moving average as the anchor, which is what the Keltner Channel does. The Chandelier Exit hangs its distance from the highest high of a whole period, which matters a lot right after a trend change, as the SPY example below shows.
Eight volatility stop methods compared
The eight methods are combinations of the same three parts, so a table shows them side by side. Default settings are the common ones from the sources named in each section; every platform may use slightly different defaults.
| Method | Measure × multiple | Anchor (long) |
|---|---|---|
| Chandelier Exit | 3 × ATR(22) | 22-bar high |
| Bollinger Bands | 2 × std. dev. (20) | 20-bar average |
| Keltner Channel | 2 × ATR(10) | 20-bar EMA |
| Kase DevStop | Average 2-bar range + 1, 2.2 or 3.6 std. dev. | Trend high |
| Kaufman stop | 2 × average high-low range | Current low |
| Elder SafeZone | Multiple × average dip below prior low | Prior low |
| Bulkowski stop | Beta, distance from a table | Current price |
| Parabolic SAR | Acceleration factor 0.02 to 0.20 | Trend extreme |
Chandelier Exit
The Chandelier Exit hangs a multiple of the ATR from the highest high of the lookback period, like a chandelier from the ceiling. According to StockCharts’ ChartSchool, Charles Le Beau developed it and Alexander Elder featured it in his books. The standard formula for a long trade is the 22-day high minus 3 × ATR(22); for a short trade, the 22-day low plus 3 × ATR(22).
Because the anchor is the highest high, the Chandelier trails the trend well but can sit very close to the price after a decline. Several of the following methods are attempts to improve it. Its close relative on the chart is the Supertrend, which also draws an ATR-based line that only moves in the direction of the trend.
Bollinger Bands as a stop
Bollinger Bands are not designed as a stop, but their lower band is a natural candidate for a long trade. The bands sit 2 standard deviations around a 20-period simple average. The 2 is a convention, not a probability: John Bollinger’s own rules warn against reading the bands as statistical odds, because prices are not normally distributed and the sample of 20 bars is small.
If you use the band as a stop, let it move only in the direction of your trade. The bands widen quickly when volatility rises, so the lower band can fall while your trade is still fine. A stop that follows it down gives back the room you had. In the SPY example below the Bollinger stop stayed flat for weeks for exactly this reason.
Keltner Channel as a stop
The Keltner Channel works like Bollinger Bands but uses the ATR instead of the standard deviation. In the version on StockCharts, the lower line is the 20-day EMA minus 2 × ATR(10). That makes it a Chandelier-style stop with a smoother anchor: a moving average instead of the highest high. The lower band serves as the stop for a long trade.
Kase’s DevStop
Cynthia Kase’s DevStop starts from the observation that the average range is not enough; how much the range varies matters too. In her article Setting Stop-Losses Using Price Volatility (The Technical Analyst, July/August 2005) she uses the true range over two bars (TRD), because single-bar ranges are too small. The stop distance is the average TRD plus a multiple of its standard deviation, over n bars.
Kase draws several lines at once: a warning line at the average, and stops at 1, 2.2 and 3.6 standard deviations above it. The odd numbers are her correction for skew: ranges are not normally distributed, so the two- and three-deviation levels were raised by about 10% and 20%. In her example the long stop trails from the highest high since the trend began, so the anchor is a price extreme, not an average.
Kaufman’s volatility stop
Perry Kaufman’s version uses the plain high-low range instead of the true range. Thomas Bulkowski summarizes it on his stops page, citing Kaufman’s book A Short Course in Technical Trading: average the daily high-low range of the prior month, multiply it by 2 and subtract the result from the current low. Bulkowski adds that in his own testing a multiple of 2 worked best, after 1.5 earlier. For a short trade the distance goes above the recent high.
Elder’s SafeZone stop
Alexander Elder’s SafeZone stop, from his book Come Into My Trading Room, measures noise in the direction that hurts. The Chandelier’s ATR treats moves up and down alike. SafeZone, as it is usually described, looks at how far each bar’s low dips below the low of the bar before, averages these dips over a lookback and places the stop a multiple of that average below the prior low. The idea is related to Wilder’s directional movement, which the ADX indicator is built on.
I have not checked Elder’s book for the exact rules, so take this as the concept, not his formula. Software versions differ in how they average and which multiple they use. SafeZone is rarely built into charting platforms; if you code it yourself, take the rules from the book and test them first.
Bulkowski’s beta-adjusted trailing stop
Thomas Bulkowski’s beta-adjusted trailing stop uses a stock’s beta as the volatility measure. Beta compares a stock’s moves with the overall market: above 1 is more volatile than the market, below 1 less. Bulkowski introduced the stop in Technical Analysis of Stocks and Commodities magazine in January 1997, according to his stops page.
The method needs no multiple, because the distance comes from a table. Bulkowski derived stop distances for combinations of beta and price from backtests. Without his table, which is not freely published, you would have to build your own from backtesting, which is hard to do well. It is a useful idea for stock portfolios, less for futures or forex.
Parabolic SAR
The Parabolic SAR is the only method in the list that includes time: the longer a trend runs, the faster the stop catches up. J. Welles Wilder introduced it in his 1978 book New Concepts in Technical Trading Systems. According to StockCharts, the acceleration factor starts at 0.02 and rises by 0.02 each time the trend makes a new extreme, up to a maximum of 0.20.
The Parabolic SAR does not use the ATR or the standard deviation. Its distance comes from the extreme point of the trend and the acceleration factor; volatility enters only indirectly through how far the price runs. SAR stands for stop and reverse: Wilder designed it to flip from long to short when the stop is hit. You do not have to trade the reversal, but the idea that a hit stop can also be a signal is worth knowing.
Four volatility stops on one SPY trade in 2026
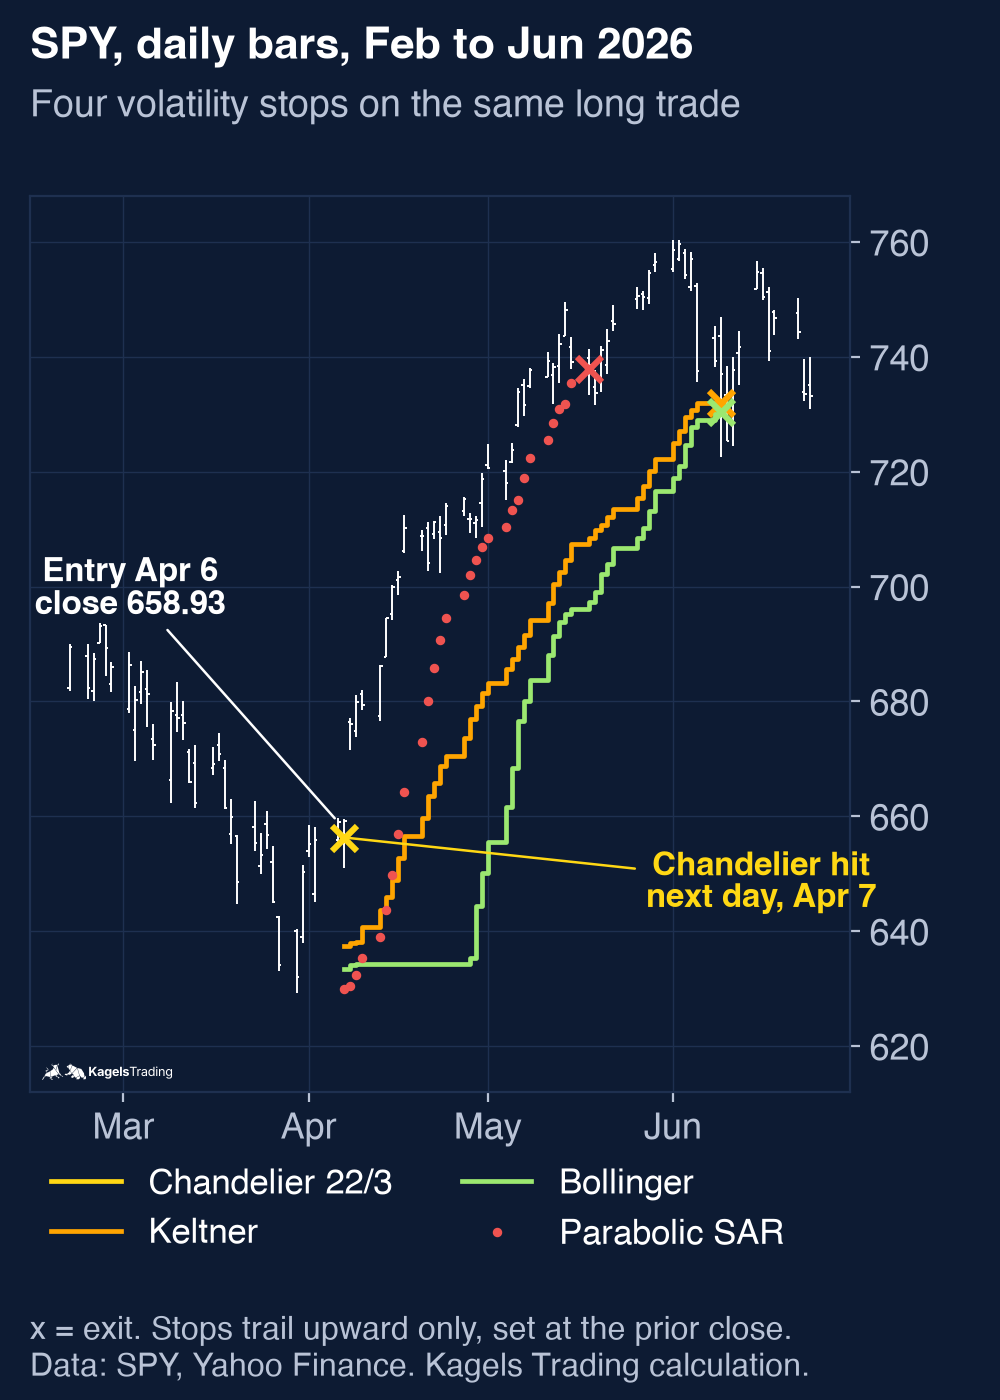
To see how much the choice of method matters, I put four stops on the same hypothetical trade. After the low of March 30, 2026, SPY first closed above its 20-day EMA on April 6 at 658.93 dollars. I took a long position at that close and let each stop trail upward from there. The settings are the standard ones from the table above; all four are built into common charting platforms. The Parabolic SAR I started fresh at the entry from the March low; the caption gives the details.
 Click to enlarge
On the entry day the four stops sat at very different distances. The ATR(14) was 10.22 dollars. The Chandelier Exit stood at 656.31, only 0.40% or 0.26 ATR below the close. The Keltner stop was 3.26% below (2.11 ATR), the Bollinger stop 3.87% (2.50 ATR) and the Parabolic SAR 4.50% (2.90 ATR).
The Chandelier Exit was hit the very next day, and the reason is its anchor. Its 22-day high was still the March 5 high of 685.53, before the decline. That high minus 3 × ATR(22) of 9.74 gave 656.31, just below the entry. On April 7 SPY dipped to 651.06 and then closed at 659.22, above the entry. An intraday stop was out with a loss of 2.62 dollars per share; a stop on the close would have stayed in.
The other three stops caught most of the rally. The Parabolic SAR accelerated with the trend and was hit on May 18 at 737.96, a gain of 79.03 dollars or 11.99%. The Keltner and Bollinger stops were both hit on June 9, at 731.91 (plus 11.08%) and 730.37 (plus 10.84%). This is one trade in hindsight. It does not rank the methods; it shows how much the anchor and the multiple decide where a stop really sits.
Intraday or close: when should the stop trigger?
Galen Woods points to a detail with a large effect: the price that triggers your stop. Most traders let the stop trigger as soon as the market trades at the level during the day. Some swing traders only act if the day closes beyond the stop, to avoid being shaken out by an intraday spike. The cost is less control: the close can be far beyond the stop. I wanted to know how large both effects are on SPY, and I wrote the rules down before calculating.
My test: 32 years of SPY stops
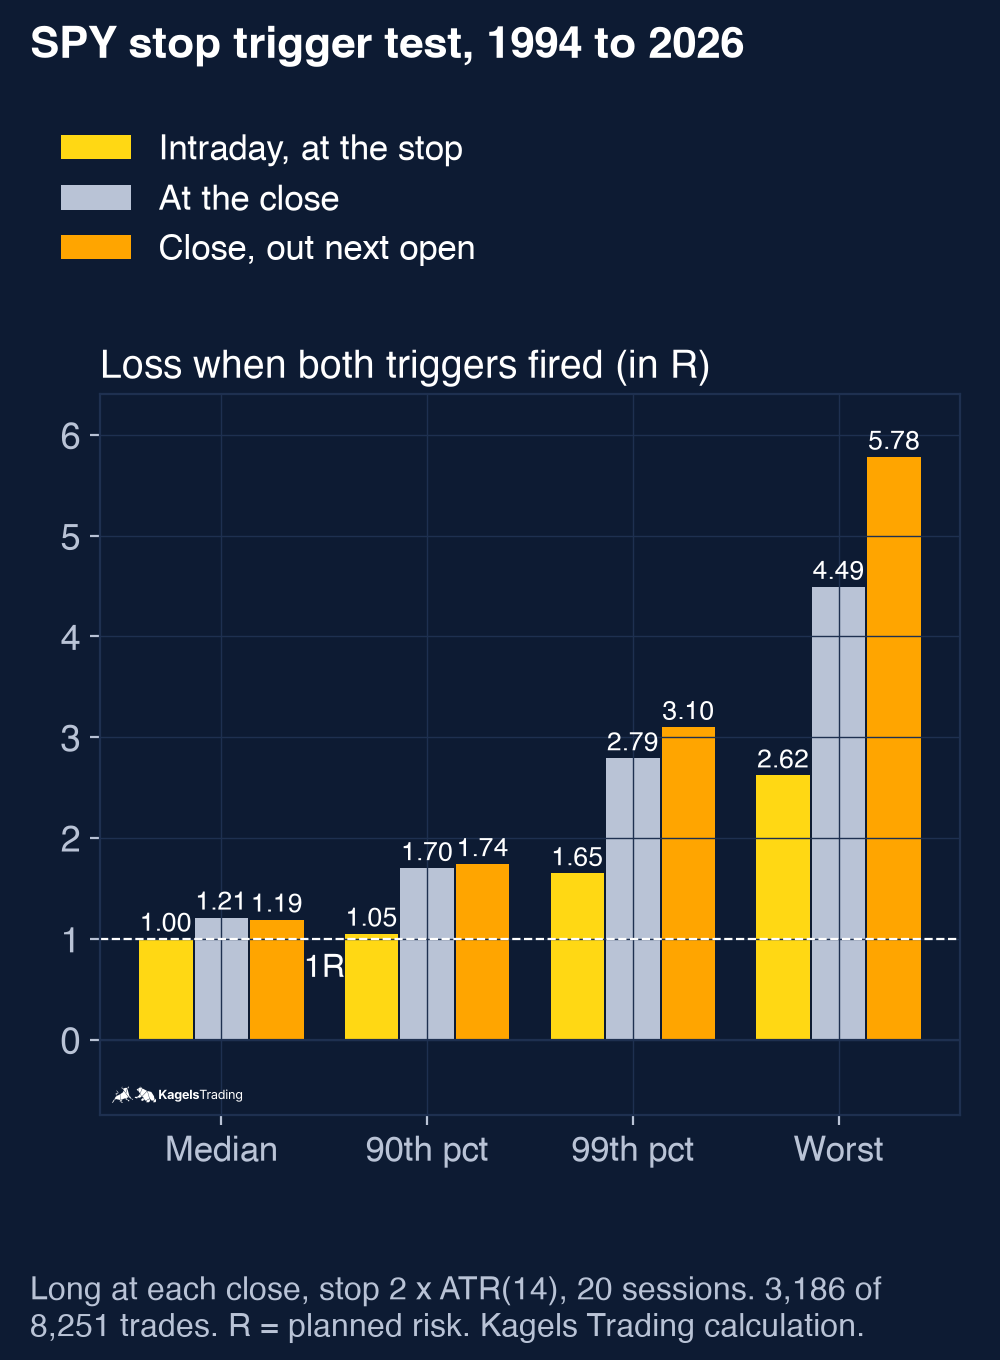
For every trading day from January 3, 1994 to October 14, 2026, I took a hypothetical long position at SPY’s close and placed a fixed stop 2 × ATR(14) below it. I then followed the next 20 sessions. The intraday trigger fires on the first low at or below the stop and exits at the stop, or at the open if SPY gapped below it. The close trigger fires on the first close at or below the stop. I measured the loss in R, the planned distance to the stop. A loss of 1 R is exactly the plan.
The intraday trigger fired in 46.2% of the 8,251 trades, the close trigger in 38.6%. So 625 of the 3,811 intraday stop-outs, or 16.4%, never closed below the stop within the 20 sessions. These intraday-only stop-outs are what a close trigger avoids; whether those trades would have made money is not part of the test. On 14.1% of the intraday stop-outs, SPY opened below the stop, so even the intraday exit came at a worse price than planned.
 Click to enlarge
When both triggers fired, the close trigger lost more, and much more in the bad cases. The median intraday exit lost 1.00 R, the 99th percentile 1.65 R, the worst case 2.62 R. Exiting at the close lost 1.21 R in the median, 2.79 R at the 99th percentile and 4.49 R in the worst case: a position opened on January 12, 2018, which closed below its stop on February 5, 2018, the day of a sharp sell-off. The intraday exit of the same trade lost 1.44 R.
A close trigger is also harder to execute than it looks. You only know the close when the market is closed, so in practice you exit near the close or at the next open. I added the next-open exit after the first run, as a separate figure: median 1.19 R, 99th percentile 3.10 R, worst case 5.78 R. Leaving the exit to the next morning added overnight gaps to the risk.
This test measures stop-outs and losses, not profits. I do not know whether the 625 intraday-only stop-outs would have gone on to make money; that would need a full trading test with exits and costs. The 20-session windows overlap, so the days are not independent, and SPY is one market with its own gaps. What the numbers do show is the trade-off: a close trigger avoids some intraday stop-outs and in exchange lets the price run further beyond the stop. Neither rule guarantees a maximum loss, because a stop order becomes a market order and gaps skip the level.
Advantages and disadvantages of volatility stops
Volatility stops are a tool for one job, placing a stop where the chart gives no clear level. The lists sum up their strengths and weaknesses.
What speaks for volatility stops
- Always available: a support level or a chart pattern is not always there; a volatility stop can be calculated on any bar.
- Good for trailing: a trailing stop should keep moving even when no new swing low forms; a volatility stop does that.
- Adapts to the market: the distance follows the current volatility instead of a fixed number of points.
- Objective: the rules are clear and easy to program, which suits systematic traders.
What speaks against volatility stops
- Parameters decide a lot: a multiple of 1 and a multiple of 4 are completely different stops, and an optimized setting may not hold in the future.
- Looks backward: the measure assumes that tomorrow’s volatility looks like the recent past; around major news that fails.
- Blind to the chart: the formula does not know where support is; a stop just above an obvious level is easy to hit.
- No guarantee of the price: a stop order becomes a market order, and gaps can fill it far beyond the level, as 14.1% of the intraday exits in my test show.
How to use volatility stops sensibly
A volatility stop works best as one input next to the chart, not as a replacement for it. Four rules help in practice.
Check the chart first
If your volatility stop sits just above a support level that the market is likely to test, do not follow the formula blindly. Move the stop a safe distance below the support: use the support level as the anchor, or raise the multiple. Where a swing low or support gives the clearer level, it takes priority, and the volatility only sets the buffer behind it. How to find such zones is shown in the guide to support and resistance.
Combine it with pattern and time stops
A pattern you traded already tells you where the idea is wrong. If you entered on a chart pattern, place the stop where the pattern fails, and add one ATR of room if the market is choppy. A time stop closes a trade that has not moved after a set number of bars; it frees capital and matters especially for options traders, whose positions lose value with time.
Decide on your target separately
A trailing volatility stop suits long trends, not every trade. For a fast intraday trade, a limit order at a fixed target often does better than waiting for a trailing stop to be hit. How to set one is explained in the guide to the take-profit order.
Size the trade from the stop
A volatility stop controls where you get out, not how much you lose; that is the job of the position size. Divide the amount you are willing to risk by the stop distance to get the number of shares. A wider stop then means a smaller position, and the planned loss stays the same. The bigger picture is in the guide to risk management.
My conclusion: the anchor matters as much as the multiple
A volatility stop is a sound way to place a stop where the chart gives no clear level, as long as you understand all three parts. Most discussions are about the multiple. My SPY example shows that the anchor matters just as much: the same idea, an ATR distance, was hit the next day from a 22-day high and held for two months from a moving average.
The trigger decides how much a bad day costs. In 32 years of SPY data, waiting for the close avoided one in six intraday stop-outs. In the worst case it turned a planned loss of 1 R into 4.49 R, or 5.78 R with an exit at the next open. If you use a close trigger, size your position for that tail, not for the median.
This article is market analysis, not investment advice. The test and the example describe the past and do not show future results.
Frequently asked questions about volatility stops
What is a volatility stop loss?
A volatility stop loss is a stop whose distance from the price is a multiple of a volatility measure, such as the ATR. It moves further away when the market is more volatile and closer when it is calm, so normal noise is less likely to hit it.
How do I calculate an ATR stop loss?
Multiply the ATR by your multiple and subtract the result from your anchor price for a long trade. With an ATR of 7 and a multiple of 3, the distance is 21; from a close of 215 the stop is at 194. For a short trade you add the distance. Most traders start with a multiple of 2 or 3 and the ATR(14).
What is the Chandelier Exit?
The Chandelier Exit is a trailing stop that hangs 3 × ATR(22) below the highest high of the last 22 bars. Charles Le Beau developed it. Because its anchor is the highest high, it follows a running trend closely, but right after a decline it can sit very near the price, as it did on SPY in April 2026.
Is the Parabolic SAR an ATR stop?
No, the Parabolic SAR does not use the ATR. It moves toward the price by an acceleration factor that starts at 0.02 and rises to at most 0.20 as the trend makes new extremes. It is a volatility stop only in a loose sense, because a fast trend pulls it up faster.
Should my stop trigger intraday or on the close?
An intraday trigger acts sooner; a close trigger can avoid some intraday stop-outs. In my SPY test with a 2 × ATR stop, a close trigger avoided 16.4% of the intraday stop-outs, but when it fired, the worst loss was 4.49 R instead of 2.62 R. Neither rule guarantees a maximum loss. Choose the close trigger only if your position size can carry that tail.
Which multiple should I use for a volatility stop?
There is no single correct multiple; 2 to 3 times the ATR are common starting points. A lower multiple suits fast trades, a higher one suits long trends. Test the setting on your market and time frame, and keep the planned loss constant through the position size.
This US edition is based on our German edition on kagels-trading.de and has been adapted for US readers.
More Risk Management guides
- Manage your trading risk
Risk Management in Trading: Rules, Math, Psychology
The 1% rule, stops, risk/reward, daily loss limits, leverage caps and the psychology of losing streaks, with the math behind each rule.
- Understand a stock market crash
Stock Market Crash: Causes, Patterns and Lessons
What caused 1929, 1987, 2000, 2008 and 2020, how deep the S&P 500 fell, how long recovery took, and the lessons for your own risk.
- Calculate your position size
Position Sizing in Trading: Formula, Calculator, Examples
The formula, a free calculator, the 1% rule explained correctly, and examples for stocks, forex and futures.
- Read your account equity
Account Equity vs Balance: Margin and Free Margin Explained
Equity against balance, margin, free margin and margin level, with a worked example and the close-out rules for cash, US margin and CFD accounts.
- Avoid a margin call
Margin Call: What It Is, How It Happens and How to Avoid It
When a margin call comes, what your broker does next, whether you can owe money, and four rules that keep your account away from it.
- Size your risk per trade
Kelly Criterion for Traders: Formula, Calculator, Risks
The Kelly formula for traders with a calculator, and a simulation of why full Kelly is far too much.
- Calculate your risk-reward ratio
Risk-Reward Ratio: Formula, Calculator, Break-Even Win Rate
The formula, a free calculator, why 1:2 and 2:1 can mean the same trade, and the win rate each ratio needs to break even.
- Check a profit factor
Profit Factor in Trading: Formula, Calculator, Good Values
The formula, a free calculator, what a good value is, and why 61 trades showed 2.22 while 356 trades showed 1.37.
- Check if you have an edge
Trading Edge: How to Calculate, Test and Keep One
The expectancy formula, the win rate each reward-to-risk ratio needs, and the tests that separate a real edge from luck.
- Avoid costly mistakes
Trading Mistakes: 13 Costly Errors and How to Avoid Them
The 13 mistakes that cost accounts the most, the biases behind them, overtrading and revenge trading, and a checklist for your next trade.
- Build a trading mindset
Trading Mindset: How to Think Like a Disciplined Trader
Why traders sell winners too early and hold losers too long, what overtrading costs, and five habits that help you follow your plan.
- Keep a trading journal
Trading Journal: How to Record and Review Your Trades
What to write before and after each trade, a completed example with a win and a loss, a weekly review and a template to copy.
- Choose a journal
Best Trading Journal Software 2026: 6 Tools Compared
Six journals compared on price, free plans, refunds, automatic broker sync, costs and export, with a decision guide.
- Check TradeZella
TradeZella Review 2026: Pricing, Features and Limitations
The three plans since July 2026, what Essential leaves out, the no-refund terms, imports, export and what users report.
- Check TraderSync
TraderSync Review 2026: Pricing, Broker Sync and Limits
Plans and dated prices, broker imports and autosync, Market Replay, Cypher and the no-refund policy.
- Check Tradervue
Tradervue Review 2026: Imports, Reports and Costs
Silver or Gold, why net P&L needs Gold, few automatic imports, US-only stocks, the no-refund sign-up terms and how to cancel.
- Check Edgewonk
Edgewonk Review 2026: Features, Costs and Limitations
One feature set billed monthly or yearly, the refund period, MetaTrader auto sync, the psychology tools and our own test journal.
- Check TradesViz
TradesViz Review 2026: Pricing, Broker Sync, Terms
The free stock plan, Pro and Platinum prices checked November 10, 2026, which US brokers sync automatically, the no-refund terms and user reviews.