
Mark Minervini: SEPA, Trend Template and VCP Explained


Contents
- Mark Minervini in 30 seconds
- Who is Mark Minervini?
- Minervini’s returns: what the numbers show and what they do not
- What is the SEPA strategy?
- The Trend Template: eight criteria for a confirmed uptrend
- The VCP pattern: when the swings shrink before the breakout
- Risk management: the part most readers skip
- Mark Minervini’s books at a glance
- Trade Like a Stock Market Wizard in detail
- What you can take from Minervini and what you cannot
- Verdict: a set of rules worth more than its return figures
- Frequently asked questions about Mark Minervini
- About the author
Most traders know Mark Minervini from his book. The more interesting question is what he actually describes in it: a fixed set of rules that sends every stock through the same eight checks before it even gets onto the watchlist. That set of rules brought him a record of 334.8% in the million-dollar stock division of the US Investing Championship in 2021, a mark that stood until 2024.
This article explains the SEPA method, the Trend Template and the VCP pattern so that you can follow them on a chart of your own. It also gives an honest view of which parts of his approach you can use without his data sources and which parts depend on them. At the end you will find a review of his first book, Trade Like a Stock Market Wizard.
Every return figure in this article is marked as either contest-verified or self-reported. Where popular versions differ from the sources, we say so. This article follows our editorial policy. It is for education, not investment advice, and past results do not predict future returns.
Mark Minervini in 30 seconds
- Two-time US Investing Champion: Minervini won the contest in 1997, with 155% by his own account, and in 2021 with 334.8%. The second win broke the division record of 119.1% by a wide margin; J Law beat it in 2024.
- SEPA stands for Specific Entry Point Analysis: it is his selection system. It combines fundamental filters with chart timing and only allows stocks in a confirmed uptrend.
- The Trend Template checks eight conditions: moving averages, the 52-week range and relative strength. All eight must be met at the same time.
- The VCP pattern shows shrinking pullbacks before the breakout: typically two to four contractions, each one shallower than the one before, while volume dries up.
- His risk management is stricter than his stock selection: losses are cut early, and position size follows the maximum loss he accepts, not his conviction.
Who is Mark Minervini?
Mark Minervini is an American stock trader, author and two-time winner of the US Investing Championship who uses his own SEPA method to buy growth stocks in confirmed uptrends.
Minervini often names his influences. Besides William O’Neil, the founder of Investor’s Business Daily, the speculator Jesse Livermore comes up again and again. Both put the major trend first, and the Trend Template turns that idea into eight measurable criteria.
Minervini bought his first stock in 1983 and did not follow the usual education path. By his own account he left school after the eighth grade and taught himself the craft over years. He became widely known through Jack Schwager’s book Stock Market Wizards (2001), the third book of the Market Wizards series. Schwager called his performance “nothing short of astounding”.
Today he runs the platform Minervini Markets 360, where members get access to his trading decisions under the name Minervini Private Access. He also teaches his method in workshops and the Master Trader Program. These are paid offers, and this article is not an endorsement.
One point matters for the picture: Minervini is not a day trader. His method is built for buying single US growth stocks and holding them for weeks to months, mainly on the long side. If you trade indices or currencies intraday, you can take his selection criteria from his system, but not his trading rhythm. His style is closer to swing trading.
Minervini’s returns: what the numbers show and what they do not
The US Investing Championship is a real-money contest in which traders’ account returns over a calendar year are compared and checked by the organizer. Our guide to the US Investing Championship explains the divisions and how results are verified.
Minervini won the contest twice, and the organizer confirms both wins. The second came in 2021 in the million-dollar stock division: 334.8% in one year, published by the organizer. For 1997, the organizer confirms the win but publishes no figure; the 155% return and the $250,000 stake come from Minervini’s own author biography. The previous record was 119.1%, set by George Tkaczuk in 2020. In 2024 J Law broke Minervini’s record with 353.9%.
Another figure is quoted far more often, and it needs context. According to his publisher, Minervini achieved a total return of 33,500% over five consecutive years, about 220% a year on average. This figure is self-reported and was not checked by a contest in the same way as the two championship results. It is therefore a claim by the author, not proof.
For judging his method, that is still not a reason to dismiss it. Both wins are confirmed by the organizer, and the 2021 return of 334.8% was published by it. Together they show two things: the approach works exceptionally well in strong markets, and it has worked in different decades. What the numbers do not show are the years in between. A contest year is a snapshot, not a 30-year track record.
What is the SEPA strategy?
SEPA stands for Specific Entry Point Analysis and is Minervini’s selection system, which first filters stocks by fundamental and technical criteria and only allows an entry at a narrowly defined point.
The name says what matters: Specific Entry Point Analysis means the analysis of one particular entry point. Not the stock alone decides, but the combination of stock and timing. Minervini has registered SEPA as a trademark.
SEPA rests on five building blocks that all have to fit together. One strong block is not enough as long as another is missing:
- Trend: the stock must be in a confirmed uptrend. This is the filter the Trend Template checks, and it rules out the great majority of candidates.
- Fundamentals: earnings and sales should grow, ideally at an accelerating rate and above expectations. Minervini looks for companies whose numbers turned before the big price move.
- Catalyst: there has to be a trigger that attracts institutional money. That can be a new product, an approval, a contract or a clear earnings surprise.
- Entry: he buys at a defined point, usually on the breakout from a tight consolidation. If you buy too early, you sit in a base that is not finished yet.
- Exit: before the purchase, it is clear where the position will be closed. Minervini treats this point as part of the selection, not as a later decision.
- ChartTrendThe stock must be in a confirmed uptrend; the Trend Template checks it.
- Company dataEarningsEarnings and sales grow, ideally faster than before.
- NewsCatalystA trigger such as a new product or an earnings surprise draws institutional money.
- ChartEntryBuy at a defined point, usually the breakout from a tight base.
- PlanExitThe stop is fixed before the purchase.
All five must fit. If one block is missing, Minervini does not take the trade.
The core of the approach is a look backwards. Instead of asking which stock looks cheap, Minervini studied the best-performing winning stocks of the past and looked for what they had in common before their rise. Those common traits became his filter criteria. For the trend logic he uses the stage model that Stan Weinstein described in 1988, which divides a stock’s price history into four stages. Our guide to stage analysis explains it.
The Trend Template: eight criteria for a confirmed uptrend
The Trend Template is Minervini’s filter of eight technical conditions that a stock must meet at the same time before he accepts it as a candidate in a confirmed uptrend.
This filter is the most useful part of his work in practice, because it can be expressed entirely in numbers. Every condition can be checked objectively, and there is no room for interpretation. The criteria use three moving averages and the position of the price within its 52-week range.
- Price above the 150-day and the 200-day moving average: the current price trades above both long-term averages. That removes every stock in a downtrend.
- 150-day line above the 200-day line: the middle line lies above the long one. That shows the more recent price action is stronger than the older one.
- The 200-day line is rising: it must have pointed up for at least one month, preferably for four to five months. A flat line is not enough.
- 50-day line above both longer lines: the short average lies above the middle and the long one. This stacking is the classic picture of an intact trend.
- Price above the 50-day line: in the short term, too, the stock must not have fallen below its average.
- At least 30% above the 52-week low: the stock has clearly lifted off its bottom. That is the value in Trade Like a Stock Market Wizard; many later versions of the template use 25%. The book adds that many market leaders are 100% to 300% above their low.
- Within 25% of the 52-week high: the closer to the high, the better. Minervini deliberately buys strength, not the pullback.
- Relative strength rating of at least 70: the stock must be among the strongest 30% of the market, preferably with a rating in the 80s or 90s.
The relative strength rating measures how a stock’s price has performed compared with all other stocks in the market and expresses the result as a rank from 1 to 99.
Here is the biggest practical hurdle. The relative strength rating Minervini refers to comes from the data of Investor’s Business Daily and is part of its paid products. If you do not have them, you cannot read the exact value off a free chart.
Do not confuse this value with the RSI, the Relative Strength Index. The RSI is an oscillator that weighs up and down moves of the same stock and only looks at its own history. Minervini’s rating compares one stock with the whole market. Both have a similar name and measure completely different things. Without a rating, you can help yourself by comparing the percentage change over six to twelve months with an index such as the S&P 500.
The other seven criteria are easy to reproduce. Any stock screener that allows filters on moving averages and the 52-week range covers the rest of the Trend Template, for example the TradingView screener. How the three averages work is explained in our guide to moving averages.
The VCP pattern: when the swings shrink before the breakout
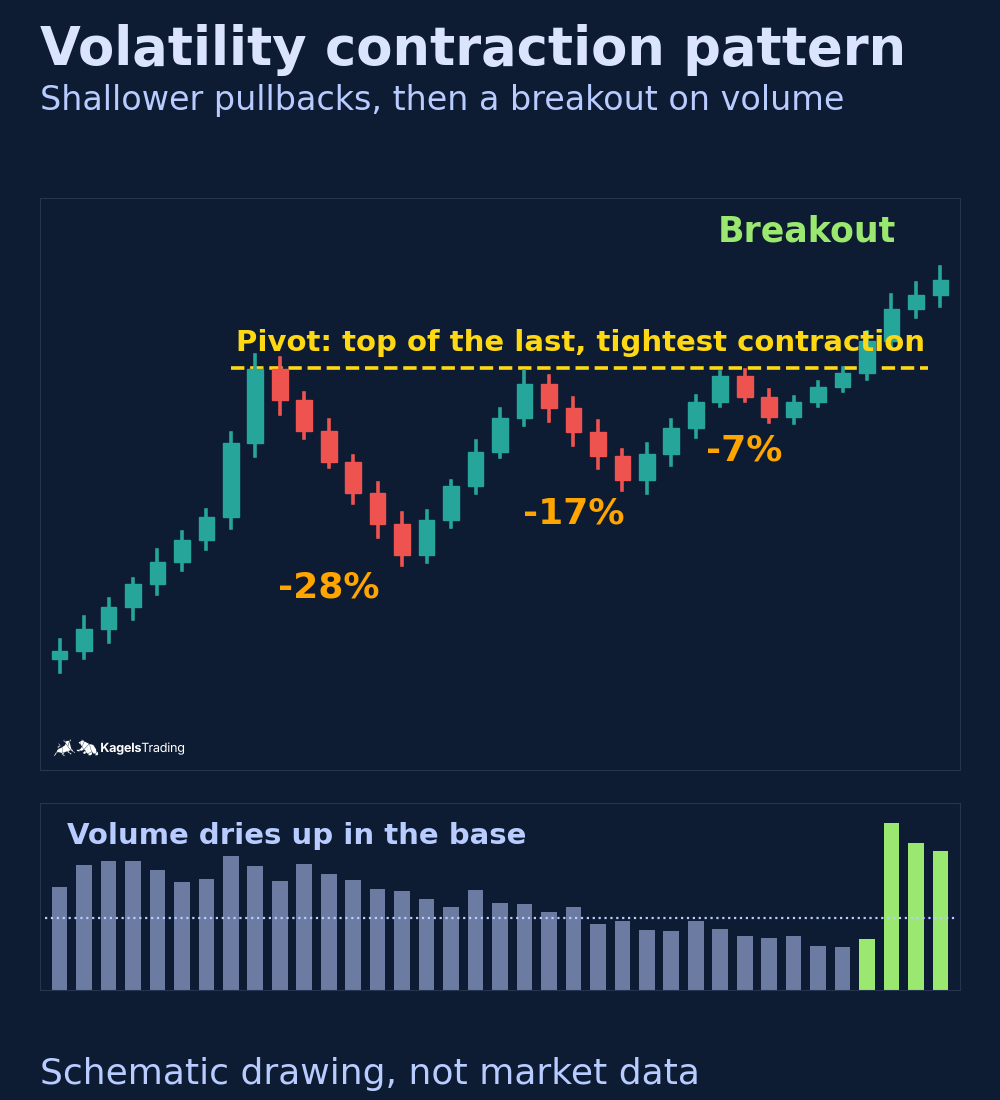
The Volatility Contraction Pattern, or VCP, is a chart pattern in which a stock goes through several consolidations whose pullbacks get shallower each time before it breaks out to the upside.
While the Trend Template does the preselection, the VCP gives the timing for the entry. The idea behind it is a statement about supply: with each pullback, impatient holders sell their shares. If the next pullback is shallower, fewer sellers are left. At some point a small supply meets normal demand, and the price breaks free.
Two to four contractions in a row are typical, sometimes more. Each pullback is shallower than the one before. The exact values are not set in stone; what matters is the direction. At the same time, trading volume should fall during the consolidations.
Minervini confirms the breakout itself with volume. He wants to see volume pick up clearly on the day of the breakout; a common rule of thumb among growth stock traders is 40% to 50% above average volume. Without that push, there is no sign that institutional buyers are behind the move, and the risk of a false breakout rises sharply. Our guide to volume analysis shows how to read this.
 Click to enlarge
Source: Kagels Trading, own drawing.
If you look for the pattern in practice, you will soon notice its kinship with the cup and handle. The handle is basically the last contraction: a short, flat pause just below the breakout level. The classic breakout trading logic with volume confirmation is the same as well. The VCP is therefore no exotic construct, but a more precise description of what many traders trade anyway.
Risk management: the part most readers skip
Minervini devotes two chapters of his book to handling losses, and that is no accident. His position on this is more uncompromising than his stock selection. If you take only his entry criteria and leave out the rest, you have not understood the method, you have cut it in half.
Position size is the amount you trade, calculated from the maximum loss you accept and the distance between the entry price and the stop loss.
The central idea: position size follows from the distance to the stop, not from conviction. If the stop is far away, the position gets smaller. The maximum loss per trade stays constant, however good the setup looks. This calculation is why a high hit rate is not even necessary. Our guide to position sizing shows the calculation step by step.
He adds an attitude that is rarely stated so clearly: a loss is no proof of a mistake but a normal part of the business. The mistake is to move the stop or to add to a losing position. If you know the typical trading errors, you will find almost all of them on Minervini’s warning list, and his rules for exiting a trade follow the same logic. The broader picture is in our guide to risk management.
Mark Minervini’s books at a glance
Minervini has published four books. They build on each other, but they are not equally useful for every reader or every trading style:
- Trade Like a Stock Market Wizard (2013): the foundation of the SEPA method and the basis of the review below.
- Think & Trade Like a Champion (2017): the follow-up, with a focus on execution and discipline.
- Momentum Masters (2015): a roundtable of four traders, Minervini with David Ryan, Dan Zanger and Mark Ritchie II.
- Mindset Secrets for Winning (2019): a book about mental strength that goes beyond trading.
If you want to go deeper, Think & Trade Like a Champion is the natural next book. It builds on the first one with more detail on entries, exits and position management. More recommendations are in our list of the best trading books.
Trade Like a Stock Market Wizard in detail
Trade Like a Stock Market Wizard was published by McGraw-Hill in March 2013. Its subtitle promises super performance in stocks in any market, and it works with many chart examples and case studies.
The structure: from selection to risk
The thirteen chapters follow a clear line. After his background and basic attitude comes the core with SEPA, then the fundamental side, then the technical side, and the last two chapters, Risk Management Part 1 and Part 2, belong to risk management. The order is deliberate: first filter, then time, then protect.
Why Minervini rejects the P/E ratio as a buy signal
The book takes apart a common assumption. A low price to earnings ratio is no reason to buy for Minervini, and a high one is no reason to sell. Growth stocks almost always carry a high P/E, because the market prices in future earnings, so traditional valuation says little about the biggest winners.
He is just as clear in his criticism of buying cheaply after a price slump. A clear break in the trend points, in his view, to investors revaluing the stock, not to a bargain. In most cases the price falls further or stays flat for years.
The four stages of a stock
The book then introduces the stage model that goes back to Stan Weinstein. According to it, stocks go through four stages: basing, uptrend, topping and downtrend.
Stage 2 is the advancing phase of a stock, in which institutional buyers carry the price above rising moving averages, and it is the only stage in which Minervini buys.
So he buys only in stage 2, the confirmed uptrend. One observation by Minervini stands out: the change of stage usually coincides with a change in the fundamentals. That is the link between the two halves of his method.
Charts, the primary base and the limits of theory
The technical chapters deal with the chart. Minervini begins with a reckoning with the efficient market hypothesis and explains why charts are indispensable for him. He pays special attention to the primary base: the first larger consolidation of a young company after its IPO, which often marks the start of a long advance.
Readability
The book is written clearly and assumes no prior knowledge of financial statement analysis. Minervini is known for vivid comparisons, and they make the dry parts easy to follow. For readers who are just starting out, that makes it more accessible than most books on stock selection.
What you can take from Minervini and what you cannot
Not every part of the approach works without his data and his time. These points work well in practice:
- The Trend Template as a prefilter: seven of the eight criteria can be reproduced with any decent screener. This filter alone shrinks a candidate list drastically and keeps you out of downtrends.
- Volume confirmation on the breakout: a look at volume on the breakout day costs nothing and filters out part of the false breakouts.
- Stop logic before the entry: size the position only once the exit point is fixed. That works in any market and any time frame.
In these places it gets difficult:
- The relative strength rating: the original value is part of a paid data service. You can calculate your own against an index, but it will not give the same values.
- Fundamentals in Minervini’s depth: following quarterly growth in earnings and sales over several periods takes time and needs a good data provider.
- Thinly traded stocks: the system was built for liquid US stocks. In thinly traded names, volume signals and breakouts are much less reliable.
- The time it takes: Minervini trades full time. If you trade on the side, you will not manage his daily market routine in this form.
One basic reservation remains: Minervini’s approach is a fair-weather method for rising markets. He trades only long and goes to cash in weak phases. If you expect this system to deliver profits in a bear market, you have misunderstood it. The skill then lies in not trading.
Verdict: a set of rules worth more than its return figures
The lasting value of Minervini’s work lies neither in the 334.8% of 2021 nor in the much-quoted 33,500%. It lies in the fact that someone has published a fully spelled-out stock selection that can be checked point by point. The Trend Template is one of the few rule sets where two traders working independently arrive at the same result.
Christian Möhrer first read the book in the English original. He considers it one of the few works that combine fundamental and technical selection cleanly without turning one side into an afterthought. His caveat: keep the self-reported returns separate from the method. The method stands without them.
The book is worth it for stock traders who focus on the US market with a horizon of weeks to months. It is not worth it for day traders, for pure index investors and for anyone looking for a method for falling markets.
Frequently asked questions about Mark Minervini
Who is Mark Minervini?
Mark Minervini is an American stock trader and author who has won the US Investing Championship twice. He won in 1997, with 155% by his own account, and in 2021 with 334.8%. He is known for his SEPA method and for Jack Schwager’s book Stock Market Wizards.
What is Mark Minervini’s SEPA strategy?
SEPA stands for Specific Entry Point Analysis and is his system for selecting stocks. It combines fundamental filters with chart timing and only allows purchases in confirmed uptrends. It rests on five building blocks: trend, fundamentals, catalyst, entry and exit.
What is the Trend Template?
The Trend Template is a filter of eight technical conditions that a stock must meet at the same time. It checks the price against the 50-, 150- and 200-day moving averages, the order of these lines, the distance to the 52-week high and low and a relative strength rating of at least 70.
What does VCP mean in trading?
VCP stands for Volatility Contraction Pattern. It is a chart pattern in which the pullbacks get shallower from wave to wave, typically over two to four contractions. The shrinking supply announces a breakout, which Minervini wants to see confirmed by clearly rising volume.
What books has Mark Minervini written?
Minervini has published four books. They are Trade Like a Stock Market Wizard (2013), Momentum Masters (2015, with three other traders), Think & Trade Like a Champion (2017) and Mindset Secrets for Winning (2019).
What were Minervini’s real returns?
The verified results are his two championship wins, with 334.8% confirmed by the organizer for 2021. The much-quoted total return of 33,500% over five consecutive years comes from his own account and is not backed by a contest in the same way.
Can you use Minervini’s strategy without an IBD subscription?
Largely yes, with one limitation. Seven of the eight Trend Template criteria can be checked with an ordinary screener. The relative strength rating from Investor’s Business Daily is a paid value, so you have to approximate it yourself against an index.
This US edition is based on our German edition on kagels-trading.de and has been adapted for US readers.
More Famous Traders guides
- See who really performed best
Best Traders in the World, Ranked by Documented Returns
A ranking built only from documented annual returns, from Jim Simons to Warren Buffett, and why the famous 120% figures are missing.
- Understand trading championships
World Cup Trading Championship: Winners, Rules, Criticism
How the real-money World Cup Trading Championship works, what it costs to enter, record winners, German champions and its flaws.
- Meet the record holder
Larry Williams: The 11,376% Record Holder, Fact-Checked
Larry Williams and his 11,376% year: his COT approach, the Oops pattern, the volatility breakout and the criticism.
- Meet the Prince of the Pit
Richard Dennis: The Prince of the Pit and the Turtle Traders
Richard Dennis from $400 to a fortune, the Turtle experiment, his losses in 1987 and 1988 and what is really documented.
- Learn the Turtle rules
Turtle Trading: The Original Rules of Richard Dennis
The key original Turtle trading rules: entries, position size with N, the 2N stop, adding units and the exits.
- Understand the stock contest
US Investing Championship: Rules, Winners and Records
The real-money US Investing Championship: divisions, verification, recent winners and records, with dates.
- Read the classic interviews
Market Wizards: Jack Schwager's Books and Their Lessons
Jack Schwager's Market Wizards books: which traders each one features and the lessons they share.
- Meet the oldest legend
Jesse Livermore: Rules, Books and Lessons of a Legend
Jesse Livermore from his own 1940 book and the 1923 novel about him: rules, bankruptcies and lessons.
- Meet the first Market Wizard
Michael Marcus: How the First Market Wizard Traded
Michael Marcus: from early wipeouts to $80 million on a company account, and the rules he took from it.
- Meet the trend-following pioneer
Ed Seykota: Trend Following Pioneer From Market Wizards
Ed Seykota: early computerized trend following, his risk rules and what Market Wizards documents.
- Learn short-term setups
Linda Raschke: Trading Rules, Setups and Books
Linda Raschke: Holy Grail, Turtle Soup and the 3-10 oscillator, and where her famous 50 rules come from.
- Trade the opening range
Toby Crabel: Opening Range Breakout and His Numbers
Toby Crabel: opening range breakout, short-term price patterns and what is known about his record.
- Understand Buffett's investing approach
Warren Buffett: Portfolio and Investing Strategy
Berkshire's disclosed holdings, Buffett's investment principles and the limits of following a reported portfolio.
- Meet the 1987 crash trader
Paul Tudor Jones: Strategy Behind the 1987 Crash Trade
Paul Tudor Jones: the short before Black Monday, global macro, the 200-day rule, 5 to 1 and what the legend leaves out.
- Understand All Weather
Ray Dalio: All Weather, Bridgewater and Lessons for Traders
Ray Dalio: what the All Weather portfolio really is, Bridgewater, his debt warnings and what traders can use.