
Contango vs Backwardation: Futures Curves Explained


Contents
- Contango and backwardation in 30 seconds
- What is contango?
- What is backwardation?
- Contango vs backwardation: the difference
- Spot price, futures price and convergence
- Why contango happens: the cost of carry
- Why backwardation happens: tight supply now
- Rolling a futures position: roll yield in both curves
- Commodity ETFs and roll yield
- Extreme contango: oil in 2015 and April 2020
- Trading the curve: calendar spreads
- How to read a futures curve yourself
- Contango, hedgers and the COT report
- Conclusion: the curve is part of the trade
- Frequently asked questions about contango and backwardation
- About the author
A futures market can price the same barrel of oil at $103 for December and $82 for a year later. That gap is not a mistake. It is the shape of the futures curve, and it shapes what a position earns or loses over time each time you roll it into a later month. The two names for that shape are contango and backwardation.
This guide explains both terms with real curves from 28 October 2026. On that day gold was in contango, WTI crude oil in steep backwardation and natural gas showed a seasonal curve. I have traded futures since 1980, and roll dates and curves are part of my daily routine. Contract specifications come from CME Group and definitions from the CFTC, both checked on 29 October 2026. The example prices are closes of CME-listed contracts as reported by Yahoo Finance. This article follows our editorial policy and is for education, not investment advice.
Contango and backwardation in 30 seconds
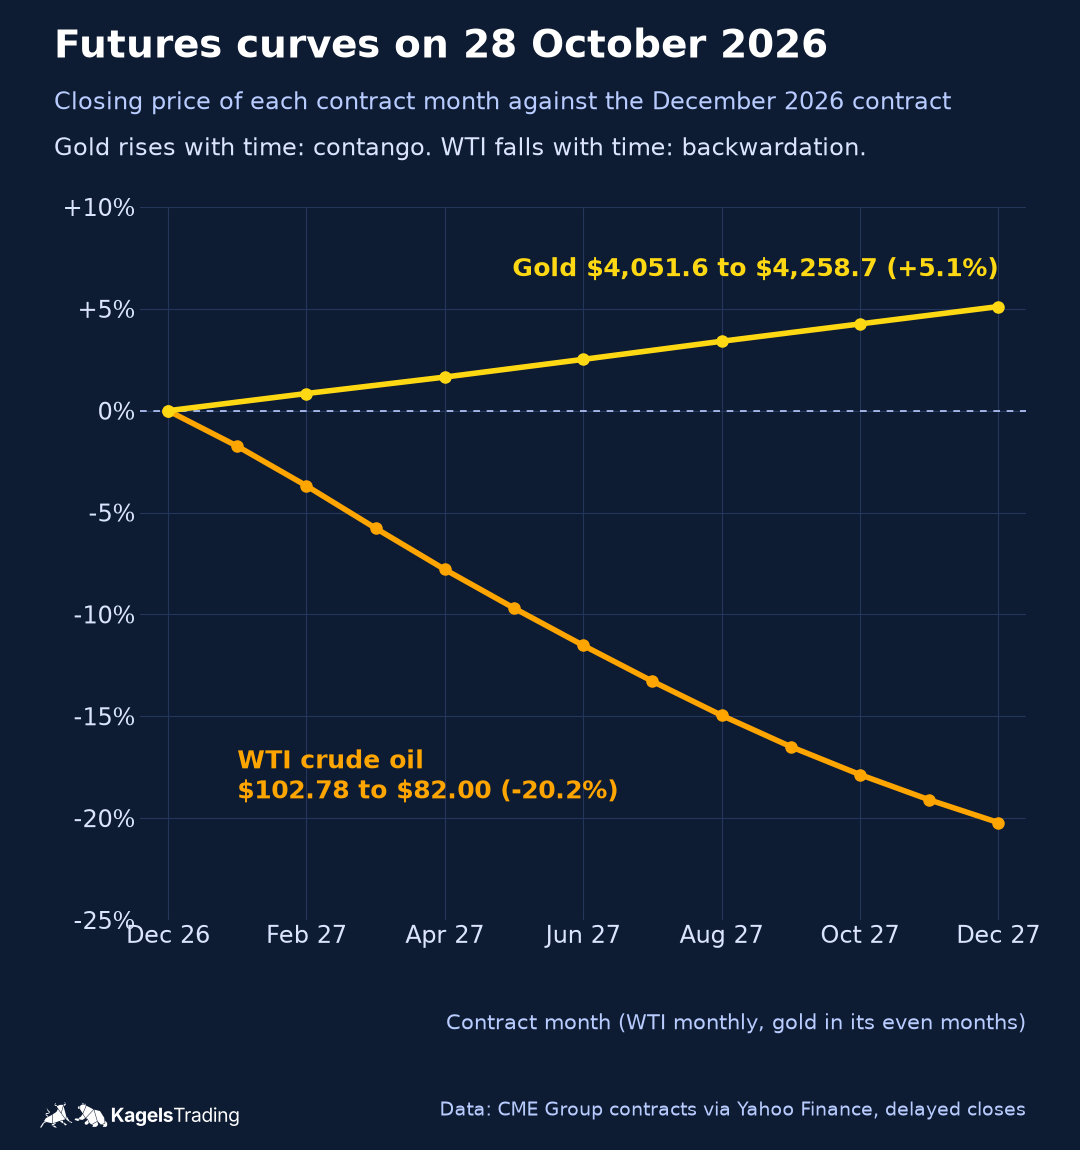
- Contango: later contract months cost more than the nearest one. The curve slopes up. Gold on 28 October 2026: December 2027 was 5.1% above December 2026.
- Backwardation: later months cost less. The curve slopes down. WTI crude oil on the same day: December 2027 was 20.2% below December 2026.
- The cause: contango usually reflects the cost of carry (financing, storage, insurance). Backwardation usually means buyers pay extra to have the goods now.
- What it means for you: a long position that rolls in contango re-enters at a higher price each time. If prices stay flat, that gap turns into a loss as the new contract converges towards spot. In backwardation the effect works in its favour. Futures-based commodity ETFs face the same effect.
What is contango?
Contango is a market situation in which futures prices for later delivery months are progressively higher than the price for the nearest delivery month.
The word describes the slope of the curve, not the direction of the price. The CFTC defines contango as prices in succeeding delivery months that are progressively higher than in the nearest month, according to its glossary. Many traders also use it when a futures price is above the spot price, the price for immediate delivery. Both views say the same thing: waiting for the goods costs more than having them now. A market in contango can still fall, and the whole curve falls with it.
What is backwardation?
Backwardation is the opposite of contango: futures prices are progressively lower in the more distant delivery months.
In backwardation the market pays a premium for the present. The nearest contract, or the spot goods, cost more than later deliveries. This usually happens when supply is tight right now: buyers who need the commodity this month bid up the near contract, while later months are not needed as urgently. The CFTC glossary lists inverted market as a related term.
Contango vs backwardation: the difference
Both terms describe the same curve with opposite slopes. The table puts the price structure, the usual cause and the effect on a roll side by side.
| Feature | Contango | Backwardation |
|---|---|---|
| Later months vs nearest month | More expensive | Cheaper |
| Shape of the futures curve | Rising | Falling |
| Typical cause | Cost of carry, ample supply | Tight supply, strong demand now |
| Rolling a long position | Re-enters higher: negative roll yield if spot holds | Re-enters lower: positive roll yield if spot holds |
| Rolling a short position | Positive roll yield if spot holds | Negative roll yield if spot holds |
| Example on 28 Oct 2026 | Gold, copper | WTI crude oil |
A change from one state to the other often tells you more than the state itself. When a curve that was in contango flattens and turns into backwardation, buyers are paying more for prompt delivery. That points to a tighter supply situation, and it often shows up in the curve before it shows up in the news.
 Click to enlarge
Source: Yahoo Finance, CME contract quotes.
Spot price, futures price and convergence
A commodity has two prices: one for now and one for later. The spot price (also cash price) is the price for immediate delivery and payment on the spot market. A futures contract fixes the price today for delivery on a later date. The difference between the two is the basis, which the CFTC defines as the difference between the cash price and the price of the nearest futures contract.
Near expiry, the futures price moves towards the spot price. The CFTC calls this convergence: the tendency of physical and futures prices to approach one another, usually during the delivery month. The logic is simple. On the last trading day, buying a contract for delivery now and buying the goods now are almost the same deal, and arbitrage keeps the two prices close.
Convergence is a tendency, not a guarantee. Delivery location, quality grades and storage limits can keep a gap open until the end. The most extreme example came in April 2020, covered below.
Why contango happens: the cost of carry
Contango is mostly the price of carrying a commodity until delivery. The CFTC defines the cost of carry as the cost of storing a physical commodity or holding a financial instrument over a period of time. For a metal that means financing the purchase, storage in an approved warehouse and insurance. If you buy the metal today and sell it for later delivery, the futures price has to pay for those costs, or nobody would hold the inventory.
Gold shows a clean carry curve because it does not spoil and is rarely scarce. On 28 October 2026, the December 2026 gold contract closed at $4,051.6 per troy ounce and the December 2027 contract at $4,258.7. That is about 5.1% more for delivery one year later, the market’s price for financing, storing and insuring the metal for a year. Copper looked similar: December 2027 was about 5.8% above December 2026.
Supply and season matter as well. A well-supplied market has no urgent buyers for the nearest month, so the near contracts trade at a discount to later ones. In farm markets the harvest adds a seasonal pattern: old crop and new crop can trade at very different prices. And in energy, heating demand makes winter months more expensive than spring months.
Why backwardation happens: tight supply now
Backwardation appears when the market needs the commodity today more than tomorrow. If inventories are low, a refinery or a manufacturer that needs supply this month will pay up for the nearest contract. Holders of physical stock then prefer to sell now rather than store, and the curve slopes down.
WTI crude oil was a textbook example on 28 October 2026. The December 2026 contract closed at $102.78 per barrel, January 2027 at $100.99 and December 2027 at $82.00, about 20% below the nearest month. Every one of the 13 monthly contracts was cheaper than the one before it. For the chart reading behind the oil price itself, see our crude oil price forecast.
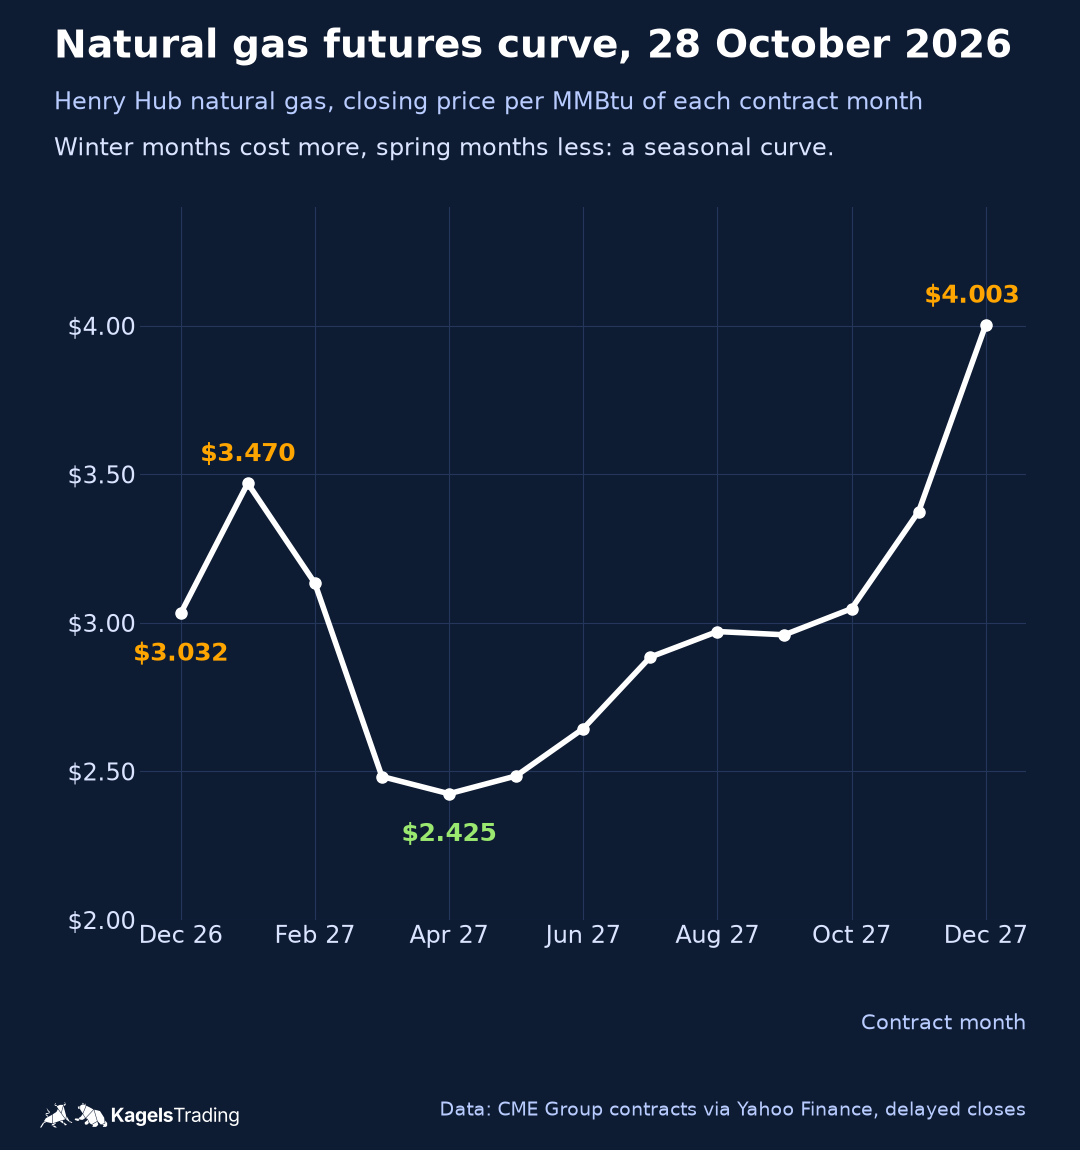
Some curves are neither simply up nor down. Natural gas is the best example. On the same day, Henry Hub gas cost $3.032 per MMBtu for December 2026, $3.470 for January 2027, only $2.425 for April 2027 and $4.003 for December 2027. The curve rises into winter, falls in spring when heating demand ends and storage is refilled, and rises again into the next winter. Whether a gas trader is “in contango” depends on which two months are compared. Our natural gas price forecast follows the front contract.
 Click to enlarge
Source: Yahoo Finance, CME contract quotes.
Rolling a futures position: roll yield in both curves
Every futures contract expires, so a position you want to keep has to be rolled. You close the expiring contract and open the same position in a later month. Most traders do not want delivery of 1,000 barrels of oil or 100 ounces of gold, and brokers enforce that. Interactive Brokers, for example, may liquidate a position in an expiring physically delivered contract during its close-out period without further notice, and publishes the deadlines per contract.
- YouCheck the datesLook up the last trading day, the first notice day and your broker's close-out deadline.
- YouPick the next monthChoose the contract with the higher volume and open interest, not simply the next one.
- MarketClose and reopenSell the old contract and buy the new one, or trade both legs as one calendar spread.
- YouWatch the new entryIn contango you re-enter higher, in backwardation lower. If spot holds, convergence turns that gap into a drag or a tailwind.
First notice day is the first day on which notices of intent to deliver can be received (CFTC). Physically delivered contracts often require you to act before it.
In contango, a long position re-enters at a higher price at every roll. With the closes of 28 October 2026, a long rolling from December 2026 gold ($4,051.6) into February 2027 ($4,085.8) would buy the new contract $34.2 per ounce above the old one: a gap of $3,420 on one standard gold contract (GC, 100 troy ounces) and $342 on one Micro Gold contract (MGC, 10 troy ounces). The roll does not debit this amount. Closing the old contract books its profit or loss against your original entry, and the new contract starts at its own price. If spot stays unchanged, the February contract tends to drift down towards the spot price as delivery approaches, which shows the negative roll yield; a rising spot price can offset that drag, but it does not remove it. Fees and the bid-ask spread of both trades come on top. A short position faces the mirror image.
In backwardation, the same mechanics work for the long. A long rolling from December 2026 WTI crude oil ($102.78) into January 2027 ($100.99) would re-enter $1.79 per barrel lower, a gap of $1,790 on one CL contract of 1,000 barrels. If spot prices hold, the cheaper contract tends to drift up towards spot, a positive roll yield. This is not free money. The lower price for later delivery reflects the value the market puts on oil available now, and the curve does not tell you where spot prices will trade. If spot falls towards the later contracts, the long loses on the price what the curve seemed to offer.
The gap that matters is the one on the day you roll, not on the day you read this. Spreads move every day. Plan the roll a few days ahead, watch the spread between the two months and avoid the last hours before your broker’s deadline, when the remaining liquidity is thin. Micro contracts make the same mechanics smaller; our guide to micro futures shows how to size them from the stop. For the hours in which these contracts trade, see futures market hours.
Commodity ETFs and roll yield
A fund that holds futures has to roll them too, and in contango that costs return. FINRA explains this in its Regulatory Notice 10-51: the gain or loss from the difference between the expiring contract and the more distant contract the fund buys is the roll yield. In a market in contango, where more distant contracts are more expensive, rolling means selling low and buying high, a negative roll yield.
That is why a futures-based ETF can trail the commodity it tracks. If the spot price moves sideways for a year while the curve stays in contango, the fund re-enters at a higher price at every roll while its contracts drift down towards spot, so its value drifts lower. In backwardation the effect reverses. Before you buy a commodity ETF, read in its prospectus whether it holds the physical commodity or futures, and which months it rolls into.
For long-term investors this is the main reason to avoid holding commodity futures for years. A strategy that always holds the nearest WTI crude oil contract rolls about twelve times a year, because CME lists a contract for every month; other schedules use fewer rolls. In a lasting contango, every one of those rolls adds to the drag.
Extreme contango: oil in 2015 and April 2020
When storage fills up, contango can become very steep. From the end of 2014, rising inventories put the crude oil futures curve into steep contango, according to the EIA. Near-term deliveries were priced lower than long-term deliveries, which paid traders to buy oil, store it and sell it forward. From September 2015 to March 2016, the United States added 34 million barrels of working crude oil storage capacity, the largest expansion the EIA had recorded since it began tracking the data in 2011.
This trade is called cash-and-carry arbitrage. A trader buys the physical commodity at the spot price and sells a futures contract at the same time. If the futures price is above the spot price plus all carrying costs, the difference is locked in. In practice it needs storage, financing and delivery capacity, so it belongs to commercial firms. One CME copper contract alone is 25,000 pounds of metal.
In April 2020 the contango broke the price itself. Demand collapsed during the pandemic and storage at Cushing, Oklahoma, the delivery point for WTI, was filling up: the EIA reported 60 million barrels in storage on 17 April 2020 against a working capacity of 76 million. On 20 April, the expiring May 2020 contract fell from $17.73 to settle at minus $37.63 per barrel, according to the CFTC. The June contract closed at $20.43 the same day, according to the Congressional Research Service. Holders of the May contract who had no storage had to pay others to take their delivery obligation.
The lesson for private traders is about dates, not about oil. Know when your contract stops trading and when delivery begins, and roll or close well before. A position that is still open in the last days of an expiring contract can face prices that have little to do with the chart.
Trading the curve: calendar spreads
A calendar spread trades the gap between two months instead of the price. The CFTC defines it as the purchase of one delivery month of a futures contract and the simultaneous sale of a different delivery month. CME’s course on futures spreads calls it an intramarket spread and notes that hedgers use calendar spreads to roll positions from one month to the next.
Your result depends on whether the gap widens or narrows. On 28 October 2026, December 2026 WTI was $20.78 above December 2027, which is $20,780 per spread of one CL contract each. A trader who expects the backwardation to ease buys the far month and sells the near month, and profits if the gap narrows, whether oil rises or falls. A trader who expects tighter supply does the opposite. This is an illustration of the mechanics, not a trade idea.
Spreads can carry less risk and less margin than outright positions, but not zero risk. CME notes that spreads can be less risky than outright futures and tend to have lower margin requirements. The actual margin depends on the contracts and on your broker. A spread can still move sharply when supply changes suddenly, as the oil market showed in 2020. Trade spreads with the same position sizing rules as any other trade; our guide to risk management covers them.
Spreads between different markets follow the same idea. An intermarket spread pairs two related futures in the same month, such as gold against silver. A commodity product spread such as the soybean crush (soybeans against soybean meal and oil) mirrors a processing margin, according to CME.
Besides calendar spreads, traders also spread one metal against another. The best-known example is the gold to silver ratio, traded with gold and silver futures.
How to read a futures curve yourself
You need only one list: the closing price of every contract month of one market. Put the months in order, plot the prices, and the slope tells you whether the market is in contango, backwardation or a mixed shape. Exchange product pages list the quotes for each month, and data sites such as Barchart show all contract months on one page; see our Barchart review.
Three things are worth reading from the curve before a trade. First, the slope between the month you hold and the month you would roll into: it shows whether you would re-enter higher or lower, and so whether roll yield works against you or for you. Second, changes in the shape: a contango curve that flattens or a backwardation that deepens points to a shift in supply. Third, kinks: a single month far off the line is often a seasonal effect, as in natural gas, or thin liquidity in a distant month.
Use liquid months for decisions and treat distant months with care. Prices of far contracts can rest on few trades. Compare like with like: the same type of price (settlement or close) and the same date for every month.
Contango, hedgers and the COT report
The curve shows the price of time, the COT report shows who holds the positions. Producers, merchants and processors use futures to hedge their physical business. They are the firms that can store a commodity when contango pays for it and sell forward when the curve allows it. The CFTC’s weekly Commitments of Traders report shows how these commercial traders and the speculators are positioned in each US futures market.
Reading both together gives you context, not a signal. A steep contango with large commercial short positions can reflect producers locking in later prices. A backwardation in which speculators are heavily long can mean a crowded trade. Our guide to the COT report shows how to read the groups, calculate net positions and avoid common date mistakes.
Conclusion: the curve is part of the trade
Contango is the normal state of many storable commodity markets, not an enemy. The cost of carry makes later delivery more expensive. Backwardation signals that the market wants the goods now. Both are visible in a few minutes if you look at all contract months of one market.
For your trading, three practical rules follow. First, plan your rolls and know your broker’s deadline instead of letting it close your position for you. Second, think twice before holding commodity futures or futures-based ETFs for years in a contango market, because a negative roll yield adds up. Third, once you have the experience, calendar spreads let you trade the curve itself, often with lower margin, but with real risk. I wish you every success in the markets.
Frequently asked questions about contango and backwardation
What is contango in simple terms?
Contango means that a commodity costs more for later delivery than for delivery now. The futures price is above the spot price, and later contract months are more expensive than the nearest one. The premium mainly pays for financing, storage and insurance until delivery.
What is the difference between contango and backwardation?
In contango the futures curve rises, in backwardation it falls. Contango usually reflects the cost of carry in a well-supplied market. Backwardation usually signals tight supply or strong demand right now. A switch from one to the other often points to a change in the supply situation.
Is contango bullish or bearish?
Neither: contango describes the curve, not the direction. A market in contango can rise or fall, and the whole curve moves with it. What contango tells you is that holders are paid for storage and that a long position faces a negative roll yield. A switch into backwardation is often read as a sign of tighter supply.
Is contango good or bad for traders?
It depends on your side of the trade. A long position that rolls in contango re-enters at a higher price each time, which turns into a loss if prices stay flat; a short position benefits in the same case. Spread traders trade the gap itself. Contango is mainly bad for long-term buy-and-hold positions in futures or futures-based ETFs.
Why do commodity ETFs lose money in contango?
Futures-based ETFs must roll their contracts before expiry. They sell the expiring contract and buy a more expensive later one, which tends to lose value towards spot if prices hold. FINRA calls the result a negative roll yield. Repeated every month or quarter, this drag can make the fund trail the spot price, even when the commodity moves sideways.
When should I roll a futures contract?
Roll before your broker’s close-out deadline, and usually when volume moves to the next month. For physically delivered contracts, that deadline can fall before the first notice day. Check the contract specifications and your broker’s table, and roll into a month with high volume and open interest.
What are first notice day and last trading day?
First notice day is the first day on which notices of intent to deliver can be received, according to the CFTC. If you are still long after it, you can be assigned delivery. The last trading day is the final day the contract trades on the exchange; the exact rule is in each contract’s specifications at CME.
This English edition is based on our German edition on kagels-trading.de and has been adapted for international readers.
More Markets and Brokers guides
- Open your first account
What Is a Brokerage Account? A US Beginner's Guide
How to open and fund a US brokerage account, cash vs margin, what it costs and what SIPC and FDIC really cover.
- Know what trading really costs
Trading Costs: Every Fee You Pay and How to Cut It
Spread, commissions, SEC and FINRA fees, market data, margin interest and tax, with yearly totals for three trading styles.
- Choose a broker
Interactive Brokers Review 2026: Fees and Platforms
Fees, platforms, investor protection and real futures commissions from a client since 1996.
- Choose an options broker
tastytrade Review 2026: Options Fees, Margin and Safety
tastytrade from an options trader's own account and its October 2026 fee schedule: fees, the 6.75% margin rate, safety and FINRA fines.
- Check an offshore broker
PU Prime Review 2026: FCA Warning, Licences and Costs
Which PU Prime company you contract with, what the FCA warning means, and what 1:1000 leverage and the deposit bonus do to your account.
- Check an EU CFD broker
Tradeview Review 2026: Tradeview Europe, MFSA and Costs
What the Malta licence of Tradeview Europe covers, how it differs from the Cayman company, and what the three MetaTrader 5 accounts cost.
- Check ZuluTrade
ZuluTrade Review 2026: Costs, Regulation and US Status
Who runs the copy trading platform, what it costs through your broker, why the US was missing from its sign-up form and what the CFTC fined its US company for.
- Check CopyX
CopyX Review 2026: Is TAG Markets Copy Trading Legit?
Who runs the TAG Markets copy trading platform, which regulators warn about it, why US residents are excluded and how fast the 12x Amplify account eats your deposit.
- Choose a US forex broker
OANDA Review 2026: Fees, TradingView and US Rules
OANDA from its own pages and NFA records: spreads and fees, TradingView and the demo, FIFO and three penalties.
- Check a commission-free app broker
Webull Review 2026: Fees, Margin Rates and Safety
Webull from its own fee schedule and FINRA records: what is free, margin rates and Premium, overnight trading, crypto and three fines.
- Understand your price
Market Makers: Who Sets Your Price and How They Profit
How market makers earn on the spread, who sets prices at German trading venues and what the EU ban on payment for order flow changed.
- Size up a bull market
Bull Market: How Long It Lasts and How to Spot the End
When a rise becomes a bull market, how long the 27 completed S&P 500 bull markets since 1928 lasted and gained, and where the current one stands.
- Read bond market stress
MOVE Index: The VIX of the Bond Market, Explained
What the MOVE index measures, which readings signal stress, how it differs from the VIX and where its limits are.
- Read stock market fear
VIX Index: What the Fear Gauge Measures and Normal Levels
What the VIX measures, which levels have been normal since 1990, how closely it tracks the S&P 500 and how VIX futures, options and ETPs work.
- Read the risk mood
Risk-On vs Risk-Off: Meaning, Assets and Indicators
What risk-on and risk-off mean, which assets rise and fall in each mode, five market shocks since 2008 and the VIX, DXY and AUD/JPY signals.
- Read market sentiment
Fear and Greed Index: How It Works, Tested Since 2021
How CNN builds its Fear and Greed Index from seven measures, what the zones mean and how the S&P 500 moved after readings below 20.
- Size up a bear market
Bear Market: How Long It Lasts and How to Spot One
When a decline becomes a bear market, how long the 27 S&P 500 bear markets since 1928 lasted, how long the recovery took and why Bitcoin had three since 2025.
- Trade an index CFD
Index CFDs at Interactive Brokers: Symbols, Costs and Trading
All 13 IBKR index CFDs, margin, stop and close-out worked through for IBDE40, financing, UK hours and the TradingView limit.
- Size an index future
Micro Futures: MES vs MNQ, Tick Values and Risk
MES and MNQ tick values, a worked sizing example from the stop with costs and slippage, and why margin is not your risk.
- Choose between futures and CFDs
Futures vs CFDs: Regulation, Order Execution and Costs
Who your counterparty is, EU, UK and US rules, how stops are triggered on CME and at CFD providers, and booked costs in a DAX example.
- Understand the IBKR Exposure Fee
IBKR Exposure Fee: What It Is and How to Reduce It
Why Interactive Brokers charges a daily fee on high-risk accounts, why weekends count, where to find it and how to reduce it, with a real 1.12 euro notice.
- Understand the spot market
Spot Market Explained: Definition and Settlement Times
What a spot market is, why two days is a minimum and not a limit, and when stocks settle at T+1 in the US, EU, UK and Switzerland.
- Choose a silver future
Silver Futures: SI vs Micro Silver vs 100-oz SIC
SI, Micro Silver and the 100-ounce SIC compared by tick value, risk per contract, margin and December 2026 deadlines.
- Read the chip sector
SOX Index: Holdings, Weighting and How to Use It
What the SOX holds, how Nasdaq caps the weights, its largest declines since 2004 against the Nasdaq-100 and which ETFs really track it.
- Read the biotech sector
Nasdaq Biotechnology Index: Holdings, Weighting and Risks
What the NBI holds, how Nasdaq caps the weights, its long declines since 2003 against the Nasdaq-100 and which ETFs really track it.
- Read the transport sector
Dow Jones Transportation Average: Stocks and Dow Theory
The 20 stocks in the Dow transport index, why the share price sets their weight, declines since 1992 and what Dow Theory can and cannot tell you.
- Read the French market
CAC 40 Index Explained: All 40 Stocks, Weights and Trading Hours
All 40 CAC 40 stocks, how Euronext caps the weights at 15 percent, trading hours in Eastern Time and how it differs from the DAX.
- Research stocks
InvestingPro Review: Screener, ProPicks AI and WarrenAI
What the InvestingPro screener, ProPicks AI and WarrenAI do, what Pro and Pro+ cost and who needs which plan.
- Judge a stock-picking newsletter
Motley Fool Stock Advisor Review: Cost and Track Record
What Motley Fool Stock Advisor costs after the first year, how the advertised return is calculated, refund and renewal terms, and who it suits.
- Use the free news portal
Investing.com Review: Free Tools, Data and Limitations
What the free Investing.com portal does well, where the quote prices come from and when InvestingPro is worth paying for.
- Use Forex Factory
Forex Factory: Calendar, Forums and Tools Explained
How to read and set up the Forex Factory calendar, and what its forums, trades feed, news, broker guide and Trade Explorer offer.
- Find real AI revenue
AI Stocks 2026: How Listed Companies Earn From AI
Which listed companies earn from AI in cloud, software, infrastructure and chips, disclosed AI revenue against hope, plus AI ETFs and risks.
- Compare AI data center suppliers
AI Infrastructure Stocks: 10 Data Center Suppliers Compared
Ten suppliers for power, cooling, servers and optics compared on free cash flow, customer concentration and next dates, with filters and a two-stock comparison.
- Follow an IPO
Anthropic Stock: IPO Price, Valuation and How to Invest
Where the Anthropic IPO stands, how the valuation compares with revenue and how to get exposure before and after the listing.
- Invest in OpenAI before the IPO
OpenAI Stock: Can You Buy It, and Who Owns OpenAI?
Why there is no OpenAI stock yet, who owns OpenAI, where the IPO stands and how much OpenAI you get through Microsoft or SoftBank.
- Understand a stock split
Stock Splits Explained: Forward and Reverse Splits
What forward and reverse splits change and what they do not, the dates that matter, what happens to options and the $1 listing rule.
- Analyze a company
Fundamental Analysis: 12 Ratios, a Worked Example, 5 Steps
Twelve ratios with formulas and rules of thumb, worked through Microsoft's 2026 annual report, a five-step process and the fundamentals of forex, commodities and crypto.
- Value a stock
Value Investing: Intrinsic Value, Margin of Safety, Traps
Intrinsic value against price, a worked DCF with a sensitivity table, Coca-Cola as a real example, the value premium since 1926 and value traps.
- Value a new listing
SpaceX Stock (SPCX): Valuation, Risks and How to Buy
How to buy SpaceX stock, what the company is worth after the IPO and which risks the lock-up calendar brings.