
VIX Index: What the Fear Gauge Measures and Normal Levels


Contents
- The VIX in 30 seconds
- What is the VIX?
- How is the VIX calculated?
- Which VIX levels are normal?
- VIX and S&P 500: how close is the link?
- Why can you not trade the VIX directly?
- How to trade volatility: VIX futures, options and ETPs
- Contango, roll costs and the VIX futures curve
- VVIX: the volatility of volatility
- VIX products that were closed or delisted
- Can you buy VIX products in the US and in Europe?
- Other volatility indices
- When does the VIX trade? Hours in ET and CET
- Using the VIX: sentiment and hedging
- Advantages and disadvantages of the VIX
- Conclusion: use the VIX as information first
- Frequently asked questions about the VIX
- About the author
The VIX is the best-known number for nervousness on Wall Street. It does not measure how much the US stock market has moved in the past. It measures how much traders expect the S&P 500 to move over the next 30 days, and that expectation is built into the prices of S&P 500 options. When those options get more expensive, the VIX rises, which is why it is called the fear gauge.
This guide shows what the index tells you and what you can do with it in practice. You will see which readings have been normal since 1990, how closely the VIX really moves against the S&P 500, and how VIX futures, options and ETPs work. The numbers come from our own analysis of Cboe’s daily data. This article follows our editorial policy.
The VIX in 30 seconds
- The VIX measures the expected 30-day swing of the S&P 500. Cboe calculates it from the prices of S&P 500 options and updates it every 15 seconds during its calculation hours.
- Readings below 20 are the normal case, not the exception. On 62.9% of all trading days from January 1990 to September 3, 2026, the index closed below 20; the median close was 17.58.
- The intraday record is 89.53 on October 24, 2008. The highest close came in the Covid crash, 82.69 on March 16, 2020; the lowest intraday reading was 8.56 on November 24, 2017.
- You cannot buy the VIX itself, only products based on it. Futures, options and exchange-traded products follow VIX futures, not the index, and many of them lose value in calm markets.
- The link to stocks is strong but not perfect. Daily changes had a correlation of minus 0.70 with the S&P 500; on days when the S&P 500 fell more than 2%, the VIX rose 97.5% of the time.
What is the VIX?
The Cboe Volatility Index (VIX) measures the 30-day volatility of the S&P 500 that the options market expects. It is calculated from the prices of S&P 500 puts and calls and quoted in annualized percent.
The VIX looks forward, not back. Historical volatility measures how strongly prices have actually moved. The VIX instead reads the implied volatility that traders pay for in option premiums. A high reading therefore says the market is paying a lot for protection, not that prices have already fallen.
Who created the VIX and what changed in 2003
The VIX started as an academic idea, not an exchange product. Finance professor Robert E. Whaley described the concept in 1993 in the Journal of Derivatives, in a paper titled “Derivatives on Market Volatility: Hedging Tools Long Overdue”. Cboe adopted it as an index the same year.
The 1993 VIX was a different index from today’s. It used options on the S&P 100, then the most actively traded index options, and a different formula. In 2003 Cboe switched to the S&P 500 and to the current method, which Cboe describes on its historical data page. Cboe has recalculated the new VIX back to 1990.
The old calculation lived on for years as the VXO. Cboe kept it under that name as the continuation of the original index. Today the VXO appears only as older data at Cboe, and the Federal Reserve Bank of St. Louis lists the series as discontinued with its last values in September 2021. If you quote VIX readings from before 2003, check which of the two series you are looking at.
How is the VIX calculated?
Cboe combines the prices of many S&P 500 puts and calls into one number. It uses a wide range of strike prices and takes the midpoint between the bid and ask of each option. Only options that expire on a Friday count, both the standard monthly series and the weeklies.
The options must have more than 23 and fewer than 37 days to expiration. Cboe weights the two expirations around that window so the result always describes a constant 30-day horizon. The full formula is in the Cboe VIX methodology. Because the mix of strikes and expirations changes all the time, the portfolio behind the index changes too.
Cboe calculates the spot VIX in two windows each trading day. According to the VIX options specifications, the windows are 2:15 a.m. to 8:25 a.m. CT and 8:30 a.m. to 3:15 p.m. CT. In New York that is 3:15 a.m. to 9:25 a.m. and 9:30 a.m. to 4:15 p.m. Eastern Time. Option dealers’ hedging can add to these swings, a mechanism explained in our guide to gamma exposure.
What a VIX of 20 means
A VIX of 20 means the options market prices an annualized swing of about 20% in the S&P 500. To scale it to one month, divide by the square root of 12: 20 divided by 3.46 gives about 5.8% for the next 30 days. The number describes the expected size of a move, roughly one standard deviation, and says nothing about its direction.
Which VIX levels are normal?
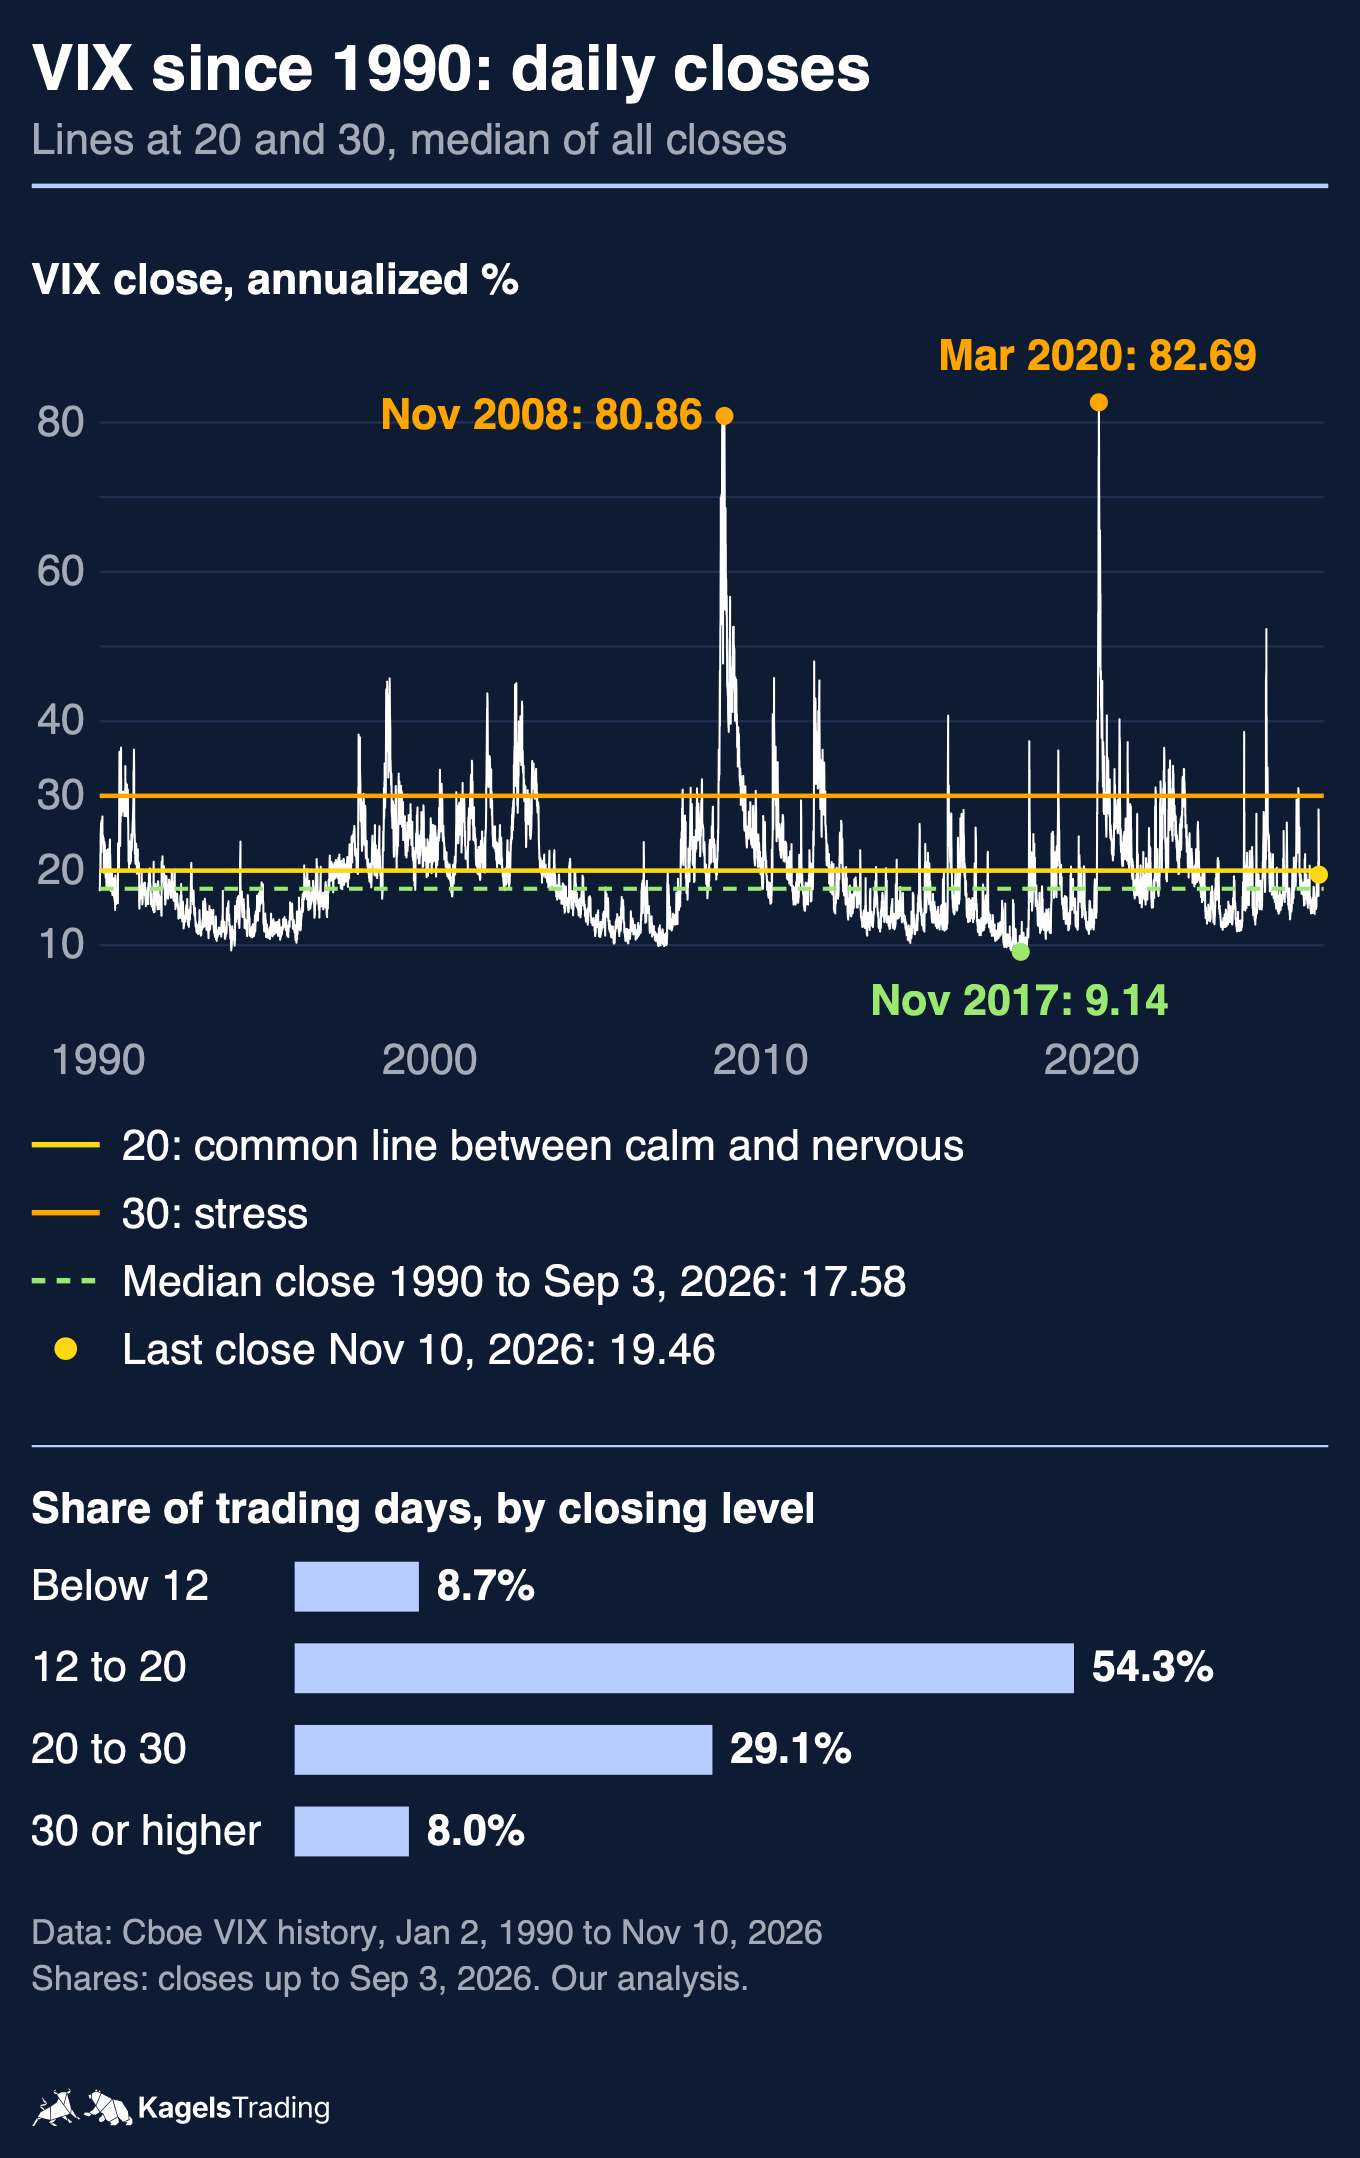
A number means little until you know its usual range. Most explanations name the line at 20 and stop there. We counted instead: 9,265 trading days of Cboe closing data from January 2, 1990 to September 3, 2026.
 Click to enlarge
A VIX below 20 is the normal state of the market. On 62.9% of trading days the index closed below 20. The median was 17.58 and the mean 19.43, because a few panic spikes pull the average up. Closes of 30 or higher came on only 8.0% of days, closes above 40 on 2.2%.
| VIX close | What it signals | Share of days |
|---|---|---|
| Below 12 | Very calm market | 8.7% |
| 12 to 20 | Normal range | 54.3% |
| 20 to 30 | Elevated nervousness | 29.1% |
| 30 or higher | Stress and panic | 8.0% |
VIX closes from January 2, 1990 to September 3, 2026, 9,265 trading days. Source: Cboe VIX history, our analysis.
Record readings are rarer than headlines suggest, and two different records exist. The highest intraday reading was 89.53 on October 24, 2008, in the middle of the financial crisis. The highest close came later: 82.69 on March 16, 2020, during the Covid crash. The difference matters, because a short panic spike is not the same as a full trading day in fear. The lowest intraday reading was 8.56 on November 24, 2017, the lowest close 9.14 on November 3, 2017.
Recent years show how fast the index can jump. On August 5, 2024, the VIX touched 65.73 intraday, and on April 7, 2025, it reached 60.13. In 2026 the intraday high so far was 35.30 on March 9 and the low 13.80 on September 4. On November 5, 2026, the VIX closed at 28.18, up from 16.61 the day before, and by November 10 it was back at 19.46.
VIX and S&P 500: how close is the link?
Every article says the VIX moves against the S&P 500; few say how closely. We compared the daily changes of both over the same period, 9,231 pairs of trading days since 1990. The S&P 500 closes come from Yahoo Finance.
The correlation of daily changes was minus 0.70, strong but far from perfect. By decade it ranged from minus 0.63 (1990 to 1999) to minus 0.79 (2010 to 2019), and since 2020 it has been minus 0.72. In practice, the two moved in opposite directions on 77.8% of days, so on more than one day in five they did not.
The bigger the stock market drop, the more reliable the link. On all days when the S&P 500 closed lower, the VIX rose 76.5% of the time. On the 326 days with a loss of more than 2%, it rose on 97.5% of them. For a hedge, that is the number that matters: the VIX reacts most reliably when protection is needed.
The VIX spikes up and drifts down. The median rise on an up day was 3.69% and the median fall on a down day 3.51%, which is almost symmetrical. The asymmetry sits in the extremes: the largest one-day jump was 115.6% on February 5, 2018, while the largest one-day fall was 35.8% on April 9, 2025.
A return to calm takes longer than the word spike suggests. Since 1990 there were 25 episodes in which the VIX closed above 30. The median time until it closed below 20 again was 52 trading days, about two and a half months. Each episode runs from the first close above 30 to the first close below 20, so repeated spikes in between count once. The shortest lasted 5 trading days, the longest 321, from September 2008 to December 2009. These episodes show why a short-volatility trade based on a quick return to calm can stay under pressure for months.
The bond market has its own volatility gauge, and the ratio says something about the mood. The MOVE index measures expected swings in US interest rates. Divided by the VIX, it had a median of 4.8 in the Yahoo Finance data since November 2002; on November 10, 2026, the ratio was about 4.75 (MOVE 92.43, VIX 19.46). A ratio well above its own normal range points to relatively higher rate volatility than equity volatility; it does not compare the risk of bonds and stocks directly. Volatility often follows the calendar: the economic calendar shows which releases move markets.
Why can you not trade the VIX directly?
The VIX is a calculation, not a basket of securities you can buy. The S&P 500 is made of stocks that change only now and then. The VIX is built from a portfolio of options that shifts constantly to keep the 30-day horizon. Copying it would mean rebalancing all day, and the costs would eat any result.
Every tradable VIX product therefore follows something else, mostly VIX futures. A future prices where traders expect the VIX to be at a future expiration, which can be far from today’s spot value. That gap is the main reason why VIX products often behave differently from the index you see on the screen.
How to trade volatility: VIX futures, options and ETPs
Several products let you trade expectations about volatility. They all depend on the same chain: S&P 500 options make the VIX, and VIX futures set the price of most of what you can actually trade. Without VIX products, you can also trade volatility on a single stock or index with options strategies such as the strangle, explained in our overview of options strategies.
VIX futures
VIX futures have traded since March 26, 2004, the first day of the Cboe Futures Exchange. Cboe marked that start in its 20-year anniversary release. Each contract has a multiplier of $1,000, so one VIX point is worth $1,000 per contract, according to the contract specifications. Each future reflects the market’s view of the VIX at its expiration.
Mini VIX futures are one tenth the size of the standard contract. Cboe launched them in August 2020, as its launch report notes. Smaller contracts let traders size a hedge or a view on volatility more precisely. You need a futures account, and the rules on margin and risk are the same as for any other future.
VIX options
Options on the VIX followed in 2006. They are cash-settled and European-style, so they cannot be exercised early. Their price follows the VIX future for the same expiration, not the spot index, which surprises many first-time buyers.
The final value is set by a special opening quotation of S&P 500 options on the expiration morning. That settlement value can differ clearly from the VIX close of the day before. If you are new to calls and puts, start with our options guide for beginners before trading options on volatility.
VIX ETPs: ETFs and ETNs
Exchange-traded products give stock-account access to VIX futures. The best known is the VXX (iPath Series B S&P 500 VIX Short-Term Futures ETN). It is an exchange-traded note, an unsecured debt obligation of Barclays Bank, whose value tracks an index that rolls daily from the first to the second monthly VIX future; if the issuer fails, holders face credit risk, as the Barclays pricing supplement explains. VIXY follows the same short-term index as a fund that holds futures; VIXM and VXZ use mid-term futures, which move less.
| Ticker | Product | Target |
|---|---|---|
| VXX | iPath Series B S&P 500 VIX Short-Term Futures ETN | Short-term VIX futures |
| VIXY | ProShares VIX Short-Term Futures ETF | Short-term VIX futures |
| VIXM | ProShares VIX Mid-Term Futures ETF | Mid-term VIX futures |
| VXZ | iPath Series B S&P 500 VIX Mid-Term Futures ETN | Mid-term VIX futures |
| UVXY | ProShares Ultra VIX Short-Term Futures ETF | 1.5 times the daily return of short-term futures |
| SVXY | ProShares Short VIX Short-Term Futures ETF | Minus 0.5 times the daily return of short-term futures |
All six had quotes on November 11, 2026 (Yahoo Finance). Targets: ProShares volatility ETFs and the issuers’ product pages.
Leveraged and inverse versions reset every day and are built for short holding periods. UVXY seeks 1.5 times the daily return of its futures index, and SVXY seeks minus 0.5 times; ProShares cut SVXY from minus 1 times to minus 0.5 times at the close on February 27, 2018. Over longer periods, their results can differ widely from that multiple, as the SEC’s information on leveraged and inverse ETFs explains.
Holding VIX products too long has hurt retail investors before. In a staff statement of November 16, 2020, SEC examiners described VIX-related ETPs that were “intended for short-term use, but were not used as designed”. The issue was the holding period: clients kept products designed for days for months.
Contango, roll costs and the VIX futures curve
The prices of VIX futures for different expirations form a curve, the term structure. When later expirations trade higher than nearer ones, the curve is in contango; that is the usual state in calm markets. When near-term futures trade above later ones, it is in backwardation, which tends to appear when fear is high. Our guide to contango and backwardation explains the mechanics for all futures.
Contango costs long VIX products money every day. The short-term futures index behind products like the VXX keeps moving its exposure from the cheaper front future into the more expensive second one. If nothing else happens, those futures drift down towards the lower spot VIX, and the index loses value. That roll cost explains why long VIX ETPs have lost most of their value over the long run despite the spikes.
You can watch the curve for free. Cboe shows the current VIX futures term structure on its VIX pages, including past dates, and the independent site VIX Central plots the futures curve against the spot VIX. Many traders watch for the moment the front of the curve flips from contango into backwardation, because it shows that short-term fear has overtaken the longer view. It is a sign of stress, not a reliable sell signal for stocks.
VVIX: the volatility of volatility
Cboe also measures how much the VIX itself is expected to move. The VVIX applies the VIX method to options on the VIX and shows the expected 30-day volatility of the VIX. Like the VIX, it is updated in real time during the calculation hours.
The VVIX helps price VIX options and shows how sure the market is about future VIX levels. A high VVIX means VIX options are expensive and traders expect large swings in volatility itself. Selling such options earns a volatility risk premium in most periods, at the price of heavy losses in rare spikes.
Readings above 140 are rare. In Cboe’s VVIX history since 2006, the index closed above 140 on only about 1.2% of trading days. The record close was 207.59 on March 16, 2020, ahead of 168.75 on August 24, 2015. The median close since March 2006 is about 91. Very high readings have often come near panic lows in stocks, but that is an observation, not a rule.
VIX products that were closed or delisted
Older articles still name VIX products that are no longer listed. That is not a detail: if you look for these tickers today, you find nothing or something unrelated. Before buying any volatility product, check the issuer’s current documents and the last trading day.
The best-known case is the XIV, an inverse VIX note. On February 5, 2018, the VIX had its largest one-day rise on record, from 17.31 to 37.32, an increase of 115.6%. The note’s value fell so far that the issuer Credit Suisse used its right to end it early, as etf.com reported. The day is known in the industry as Volmageddon.
Two notes from the same family were delisted in 2020. TVIX, which aimed for twice the daily return of short-term VIX futures, and the unleveraged VIIX, both from the VelocityShares range of Credit Suisse, left the exchange in July 2020. Credit Suisse said in its delisting announcement that the notes stayed outstanding and might trade over the counter. The lesson goes beyond single tickers: leveraged and inverse volatility products can lose almost everything between one close and the next opening, and a stop-loss order cannot protect against that.
Can you buy VIX products in the US and in Europe?
In the US, VIX ETPs trade like stocks in an ordinary brokerage account. Many brokers ask you to confirm that you understand leveraged and inverse products before your first trade, and some limit them. VIX futures need a futures account, VIX options an options approval at the right level.
Readers in the European Union face a different situation. US-listed products like VXX, SVXY and UVXY generally cannot be bought as new positions by retail clients in the EU. The reason is the PRIIPs regulation, which requires a key information document that US issuers do not provide. Access to VIX futures and options depends on the key information documents available for them, the broker’s permissions and the country; check this with your broker before planning a trade. Europe’s own volatility contracts trade at Eurex on the VSTOXX, the volatility index of the Euro Stoxx 50.
Other volatility indices
Cboe calculates volatility indices for many other markets. Examples are the VXN for the Nasdaq-100, the GVZ for gold and the OVX for crude oil. On Yahoo Finance you find them with a caret in front of the ticker, such as ^VVIX or ^VXN.
Each gauge answers the same question for its own market. On November 11, 2026, the VXN stood at about 28.6, well above the VIX, because the Nasdaq-100 is more concentrated in volatile tech stocks. Germany’s DAX has the VDAX-NEW, the eurozone the VSTOXX. For US interest rates, the role falls to the MOVE index mentioned above.
When does the VIX trade? Hours in ET and CET
VIX futures trade almost around the clock. The Cboe Futures Exchange lists them from Sunday 5:00 p.m. CT to Friday 4:00 p.m. CT, with a daily break from 4:00 to 5:00 p.m. CT. In New York time that is Sunday 6:00 p.m. to Friday 5:00 p.m. ET, with a break from 5:00 to 6:00 p.m. ET (11:00 p.m. to midnight CET in winter, CEST in summer). Our guide to futures market hours lists the other main contracts.
The spot index runs on shorter hours. Cboe calculates it from 3:15 a.m. to 9:25 a.m. ET and from 9:30 a.m. to 4:15 p.m. ET. For traders in central Europe the regular window is 3:30 p.m. to 10:15 p.m. local time for most of the year, CET in winter and CEST in summer.
Twice a year the gap between New York and Europe shrinks to five hours. The US moves its clocks earlier than Europe in March and later in autumn. In 2027 that affects March 15 to 26 and November 1 to 5; on those days US sessions start one hour earlier in European time.
Using the VIX: sentiment and hedging
The most common reason to trade the VIX is protection against a crash. Because the VIX usually rises when stocks fall, a long VIX position can offset part of a stock portfolio’s losses. A typical approach is to buy out-of-the-money VIX calls: if stocks crash, the calls can gain sharply; if nothing happens, they expire worthless and the premium is the cost of insurance.
A VIX hedge is never exact. The calls follow the VIX future, not the spot index, and in a slow decline the VIX may rise far less than in a sudden crash. The link works best for US stocks; a portfolio of other markets correlates less. The size of the hedge matters as much as the instrument, as our guide to risk management explains.
Many traders also read the VIX as a contrarian signal. Extreme readings have often come near market lows, when fear was greatest. CNN uses the VIX as one of seven parts of its Fear and Greed Index, and the put/call ratio is another popular gauge. A high VIX is a reason to pay attention, not a buy signal on its own: after the first close above 30 in September 2008, it took 321 trading days to close below 20 again.
Advantages and disadvantages of the VIX
The VIX is a strong source of information and a difficult trading instrument. These two sides are often mixed up. The overview below separates the information value from the trading risks and uses the figures measured in this article.
Advantages of the VIX as a tool
- It looks forward. Unlike historical volatility, it measures the options market’s expectation for the next 30 days.
- It gives you a measurable scale. With a median of 17.58 and 62.9% of days below 20, any daily reading can be put into context.
- It reacts when it matters. On days when the S&P 500 lost more than 2%, it rose 97.5% of the time.
- It is free. The index is published by Cboe and every major data provider, without an account or a data fee.
- It can be used for hedging. Futures and options can soften losses in a US stock portfolio.
Disadvantages and limits of the VIX
- You cannot buy the index itself. Only derivatives trade, and they follow it only roughly.
- It says nothing about direction. It measures the expected size of moves, not their sign; a high reading is not a sell signal.
- Long positions cost money in calm periods. When the futures curve is in contango, futures and ETPs lose value with every roll.
- Leveraged and inverse products can collapse overnight. XIV in 2018 is the warning.
- Calm takes time to return. After a close above 30, it took a median of 52 trading days to close below 20 again, and up to 321 days.
Conclusion: use the VIX as information first
The VIX answers a question no price chart answers: how turbulent the market expects the coming weeks to be. That makes it valuable as a sentiment gauge, whether or not you trade it. A reading of 15 says something different about the market than one of 35, and the figures here give you the scale: 62.9% of trading days since 1990 ended below 20.
Trading it is harder than many articles suggest. The index itself cannot be bought, and the derivatives follow it only roughly. In calm periods, long products lose value through the futures curve, and leveraged or inverse products can be wiped out in a day.
My advice: use the VIX as information first, not as a position. Keep it on your screen next to the economic calendar and options data; watching costs nothing and teaches a lot about the rhythm of the market. If you want to trade it, remember that the way back from a close above 30 to below 20 took a median of 52 trading days, and in some cases more than a year. This article is market analysis, not investment advice.
Frequently asked questions about the VIX
When does the VIX go up?
The VIX rises when demand for protection grows. When investors buy more S&P 500 options, especially puts, their prices rise, and those prices feed the calculation. That is why the index usually climbs when stocks fall: on days with an S&P 500 loss of more than 2%, it rose 97.5% of the time since 1990.
What is a good VIX level?
There is no good or bad level, but there is a normal range. From 1990 to September 2026, the VIX closed between 12 and 20 on 54.3% of trading days, and the median was 17.58. Readings above 20 point to elevated nervousness, and above 30 to stress.
What does a high VIX mean?
A high VIX means the options market expects large swings over the next 30 days. The usual threshold is 20. Since 1990 the VIX closed at 20 or higher on 37.1% of trading days and at 30 or higher on only 8.0%. A high reading says nothing about the direction of the expected move.
What does a low VIX mean?
A low VIX stands for calm expectations, and it is the normal case. On 62.9% of trading days since 1990 the VIX closed below 20. The lowest intraday reading ever was 8.56 on November 24, 2017. Low readings can last a long time, but they do not protect against a sudden spike.
Can you trade the VIX?
You cannot trade the index itself, only products based on it. In the US, VIX futures and VIX options trade at Cboe, and ETPs such as VXX, VIXY or SVXY trade like stocks. All of them follow VIX futures rather than the spot index, so their returns can differ widely from the number on the screen.
Are VIX products risky?
Yes, much riskier than a stock index fund. Long products lose value through roll costs in calm markets, and leveraged and inverse products can become almost worthless overnight. The inverse XIV collapsed on February 5, 2018, when the VIX rose 115.6% in one day.
What were the highest and lowest VIX readings?
The highest intraday reading was 89.53 on October 24, 2008. The highest close came during the Covid crash: 82.69 on March 16, 2020. The lowest intraday reading was 8.56 on November 24, 2017, and the lowest close 9.14 on November 3, 2017, according to Cboe’s historical data.
This US edition is based on our German edition on kagels-trading.de and has been adapted for US readers.
More Markets and Brokers guides
- Open your first account
What Is a Brokerage Account? A US Beginner's Guide
How to open and fund a US brokerage account, cash vs margin, what it costs and what SIPC and FDIC really cover.
- Choose a broker
Interactive Brokers Review 2026: Fees and Platforms
Fees, platforms, investor protection and real futures commissions from a client since 1996.
- Check an offshore broker
PU Prime Review 2026: FCA Warning, Licences and Costs
Which PU Prime company you contract with, what the FCA warning means, and what 1:1000 leverage and the deposit bonus do to your account.
- Check CopyX
CopyX Review 2026: Is TAG Markets Copy Trading Legit?
Who runs the TAG Markets copy trading platform, which regulators warn about it, why US residents are excluded and how fast the 12x Amplify account eats your deposit.
- Understand your price
Market Makers: Who Sets Your Price and How They Profit
How market makers earn on the spread, who sets prices at German trading venues and what the EU ban on payment for order flow changed.
- Read bond market stress
MOVE Index: The VIX of the Bond Market, Explained
What the MOVE index measures, which readings signal stress, how it differs from the VIX and where its limits are.
- Read market sentiment
Fear and Greed Index: How It Works, Tested Since 2021
How CNN builds its Fear and Greed Index from seven measures, what the zones mean and how the S&P 500 moved after readings below 20.
- Trade an index CFD
Index CFDs at Interactive Brokers: Symbols, Costs and Trading
All 13 IBKR index CFDs, margin, stop and close-out worked through for IBDE40, financing, UK hours and the TradingView limit.
- Size an index future
Micro Futures: MES vs MNQ, Tick Values and Risk
MES and MNQ tick values, a worked sizing example from the stop with costs and slippage, and why margin is not your risk.
- Read the futures curve
Contango vs Backwardation: Futures Curves Explained
What contango and backwardation mean, what rolling does to a position in each case, and real gold, oil and gas curves from 28 October 2026.
- Choose a silver future
Silver Futures: SI vs Micro Silver vs 100-oz SIC
SI, Micro Silver and the 100-ounce SIC compared by tick value, risk per contract, margin and December 2026 deadlines.
- Read the chip sector
SOX Index: Holdings, Weighting and How to Use It
What the SOX holds, how Nasdaq caps the weights, its largest declines since 2004 against the Nasdaq-100 and which ETFs really track it.
- Read the biotech sector
Nasdaq Biotechnology Index: Holdings, Weighting and Risks
What the NBI holds, how Nasdaq caps the weights, its long declines since 2003 against the Nasdaq-100 and which ETFs really track it.
- Read the transport sector
Dow Jones Transportation Average: Stocks and Dow Theory
The 20 stocks in the Dow transport index, why the share price sets their weight, declines since 1992 and what Dow Theory can and cannot tell you.
- Read the French market
CAC 40 Index Explained: All 40 Stocks, Weights and Trading Hours
All 40 CAC 40 stocks, how Euronext caps the weights at 15 percent, trading hours in Eastern Time and how it differs from the DAX.
- Research stocks
InvestingPro Review: Screener, ProPicks AI and WarrenAI
What the InvestingPro screener, ProPicks AI and WarrenAI do, what Pro and Pro+ cost and who needs which plan.
- Judge a stock-picking newsletter
Motley Fool Stock Advisor Review: Cost and Track Record
What Motley Fool Stock Advisor costs after the first year, how the advertised return is calculated, refund and renewal terms, and who it suits.
- Use the free news portal
Investing.com Review: Free Tools, Data and Limitations
What the free Investing.com portal does well, where the quote prices come from and when InvestingPro is worth paying for.
- Find real AI revenue
AI Stocks 2026: How Listed Companies Earn From AI
Which listed companies earn from AI in cloud, software, infrastructure and chips, disclosed AI revenue against hope, plus AI ETFs and risks.
- Compare AI data center suppliers
AI Infrastructure Stocks: 10 Data Center Suppliers Compared
Ten suppliers for power, cooling, servers and optics compared on free cash flow, customer concentration and next dates, with filters and a two-stock comparison.
- Follow an IPO
Anthropic Stock: IPO Date, Valuation and How to Invest
Where the Anthropic IPO stands, how the valuation compares with revenue and how to get exposure before and after the listing.
- Invest in OpenAI before the IPO
OpenAI Stock: Can You Buy It, and Who Owns OpenAI?
Why there is no OpenAI stock yet, who owns OpenAI, where the IPO stands and how much OpenAI you get through Microsoft or SoftBank.
- Understand a stock split
Stock Splits Explained: Forward and Reverse Splits
What forward and reverse splits change and what they do not, the dates that matter, what happens to options and the $1 listing rule.
- Value a stock
Value Investing: Intrinsic Value, Margin of Safety, Traps
Intrinsic value against price, a worked DCF with a sensitivity table, Coca-Cola as a real example, the value premium since 1926 and value traps.
- Value a new listing
SpaceX Stock (SPCX): Valuation, Risks and How to Buy
How to buy SpaceX stock, what the company is worth after the IPO and which risks the lock-up calendar brings.