
Bear Market: How Long It Lasts and How to Spot One


Contents
- Bear market in 30 seconds
- What is a bear market?
- Why is it called a bear market?
- How to spot a bear market
- Is there a bear market right now?
- How long does a bear market last?
- Bear markets in crypto
- How a bear market unfolds
- What is a bear market rally?
- How a bear market rally starts
- What is a bear trap?
- Bear market, correction or crash?
- The great bear markets in history
- Strategies that work in a bear market
- How to make money in a bear market
- Opportunities and risks in a bear market
- Conclusion: a bear market is a counting rule, not the end of the world
- Frequently asked questions about bear markets
- About the author
A bear market is the phase when everything at the stock exchange seems to go wrong at once. Prices fall for months, every rebound fails, and the news delivers new reasons to sell every day. In exactly this mood, investors make the most expensive decisions of their investing lives. Most of the time, it is a sale at the wrong moment.
This guide answers the questions that really matter in such a phase. You will learn when a decline officially becomes a bear market, how long it lasts on average and how long the recovery takes. For the numbers I counted the price history of the S&P 500 (with its historical predecessor before 1957) since 1928, the DAX since 1988 and Bitcoin since 2014 myself instead of copying them. You also get the strategies that work in falling markets and the traps that catch most people. This article follows our editorial policy.
Bear market in 30 seconds
- Definition: a bear market is a phase in which prices close at least 20% below their last high.
- Duration: of 27 bear markets in the S&P 500 since 1928, the median one lasted about 8 months; the average is 9.4 months.
- Loss: the typical bear market cost about 33%; the deepest by this count cost 62%, and the whole slide from 1929 to 1932 cost 86%.
- Recovery: from the low back to the old high took a median of about 1.8 years.
- Today: stocks have been in a bull market since October 12, 2022. Bitcoin, on the other hand, had three bear markets since January 2025.
What is a bear market?
A bear market is a lasting decline in a financial market in which prices close at least 20 percent below their last high.
The 20 percent mark is a convention, not a law. It is measured on closing prices, the price at the end of the trading day. Many sources also want the decline to last at least two months, so that a short panic sale does not count. How tense the market is shows in the Cboe Volatility Index (VIX): on 319 of the 327 days since 1990 when the S&P 500 lost more than 2%, the VIX rose, which is 97.6% of the cases.
The opposite is a bull market. There, prices rise at least 20 percent above their last low. Together the two phases form a market cycle that has repeated for decades, but never at the same pace. In French the bear phase is called baisse, the bull phase hausse, and you will meet both words in European texts.
A bear market is identified looking back, not predicted. Only when the 20 percent are reached is it certain that one is running. At that point, a large part of the decline is already behind you, not ahead of you. That is why the official confirmation almost always comes too late as a sell signal.
Why is it called a bear market?
The name describes how the animal attacks. A bear swipes its paw from top to bottom, which stands for falling prices. A bull thrusts its horns from bottom to top and stands for rising prices. There is no more symbolism behind it, and that is exactly why the image has lasted so long.
The phrase is older than the picture. In the London stock market of the 18th century, people mocked traders who “sold the bearskin before catching the bear”. This meant short sellers who sold shares they did not own yet. The bearskin jobber became the bear, and the bull joined later as the counterpart.
Several everyday trading words come from the animal. Bearish means positioned for falling prices. A bearish signal is a hint on the chart that speaks for a decline. Whoever is positioned as a bear earns money when prices fall.
How to spot a bear market
The first feature is the number; everything else is background music. A bear market exists when an index such as the S&P 500, the Dow Jones or the Nasdaq closes 20 percent below its last high. Followers of Dow theory also check whether the Dow Jones Transportation Average confirms the decline.
- Size: a price decline of at least 20 percent from the last high.
- Time: over several weeks to months, usually at least two months.
- Breadth: visible in a leading index, not just in a single stock.
Second, the mood turns, and you can measure it. Investors avoid risk, sell stocks and move into safe havens such as Treasury bonds or gold. Professionals call this risk-off. Trading volume often rises, because many want to get out at the same time.
Third, the decline often follows rising interest rates or comes with a recession. Of the 14 bear markets in the S&P 500 since 1947, nine overlapped with a US recession as dated by the National Bureau of Economic Research. Before the bear markets of 1973, 1980, 2000 and 2007, the Federal Reserve had raised rates.
A bear market is not limited to stocks. It can happen just as well in the bond market, in commodities or in cryptocurrencies. There the 20 percent rule triggers much more often, as the Bitcoin section below shows.
The most important limit: the start can only be dated in hindsight. Price drops and crises happen all the time, and prices also fall during a bull market. Whether a correction becomes a bear market is clear only once the 20 percent are broken. If you want to see earlier whether a trend is getting fragile, look at market breadth; the Hindenburg Omen measures exactly this kind of split.
Is there a bear market right now?
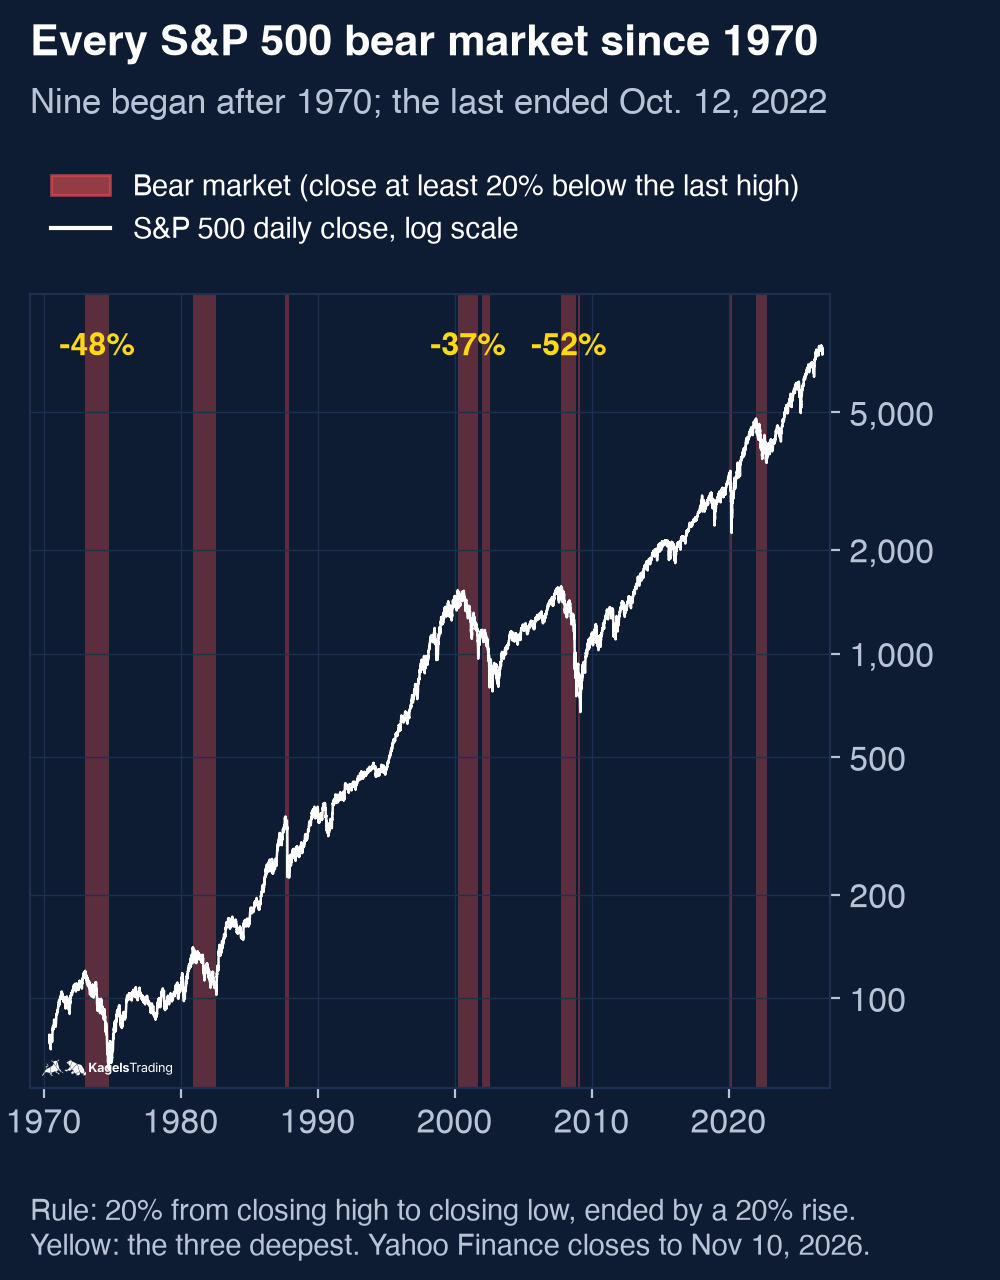
Not in stocks, the S&P 500 is in a bull market. The last bear market in the S&P 500 ended on October 12, 2022. It had started on January 3, 2022 at 4,796.56 points and ended at 3,577.03 points. That is a loss of 25.4 percent in a little over nine months.
A bull market has been running since then. On November 10, 2026, the S&P 500 closed at 7,520.93 points, about 110 percent above the 2022 low. Its record close so far came on October 6, 2026 at 7,818.93 points, so the index stood about 3.8 percent below it.
The bull market almost broke in the spring of 2025. Between February 19 and April 8, 2025, the index fell 18.9 percent on a closing basis and stayed about one percentage point short of the threshold. That was a correction, not a bear market, even if it did not feel like one to investors.
 Click to enlarge
Source: Prices from Yahoo Finance, calculation and chart by Kagels Trading.
The chart also shows why bear markets feel bigger than they are. The red bands take up much less room than the phases between them. Over long periods the market rose more often and for longer than it fell. The declines are steeper, though, and that is what sticks in memory.
Cryptocurrencies are in a different place. Bitcoin went through a heavy decline from October 2025 to February 2026 and another bear market from May to June 2026. Its own section follows below, with the current state of the Bitcoin forecast as a reference for the price levels.
How long does a bear market last?
For this question I ran through the S&P 500 closing prices since 1928. A bear market counts as every phase in which the index fell at least 20 percent from a closing high to its next closing low, and it ends when the index rises 20 percent from that low. This swing rule produces 27 bear markets. The S&P 500 itself started on March 4, 1957; the earlier closes come from the historical series the index provider reports for its predecessor, which began with 90 stocks, so treat the figures before 1957 as an approximation.
The median bear market lasted about 8 months, the average 9.4 months. The range is wide: the shortest, in 2020, was over after 33 days, the longest, from January 1973 to October 1974, lasted about 21 months. The median describes the typical case better than the average. Our stock market crash guide counts 12 episodes since 1929 instead, because it starts a new episode only after a new record close; other lists use other rules again.
In terms of loss, the typical bear market cost about 33 percent. The average is 35.1 percent, and the deepest by this count, from November 1931 to June 1932, cost 61.8 percent. Anyone who plans with the average plans past the extremes.
| Figure | Bear market | Bull market |
|---|---|---|
| Number since 1928 | 27 | 27 |
| Median duration | 8 months | 1.7 years |
| Median change | −32.9% | +80% |
| Extreme | −61.8% | +582% |
The comparison is the real message. In the median, bull markets lasted about two and a half times as long as bear markets, and their gains clearly outweighed the losses. That is no promise for the future, but it explains why long-term investors could sit out the declines.
The recovery matters just as much as the duration. From each low back to the high where that bear market began, the S&P 500 needed a median of about 1.8 years in this sample. The average is a little over four years, because the swings of 1929 and 1930 took 25 and 22 years: the index closed above its September 1929 high again only in September 1954. These two overlapping cases from the same collapse pull every average up, and many guides leave them out. All recovery times here are price index only, without dividends, inflation or costs, and they start at a low that is known only in hindsight.
Two different measures explain the two worst numbers on this page. The swing rule splits the slide from 1929 to 1932 into five bear markets, because the index rallied more than 20 percent several times on the way down; the deepest of them cost 61.8 percent. Measured from the September 1929 high to the final low in June 1932, the S&P 500 lost 86.2 percent.
The German DAX tells a similar story. Since 1988 I count 15 bear markets with a median of about 4.4 months and a typical loss of 32.6 percent. The two indices are not directly comparable, though: the headline DAX is a performance index that reinvests dividends, while the S&P 500 figures here are price only, and the DAX data start 60 years later.
Bear markets in crypto
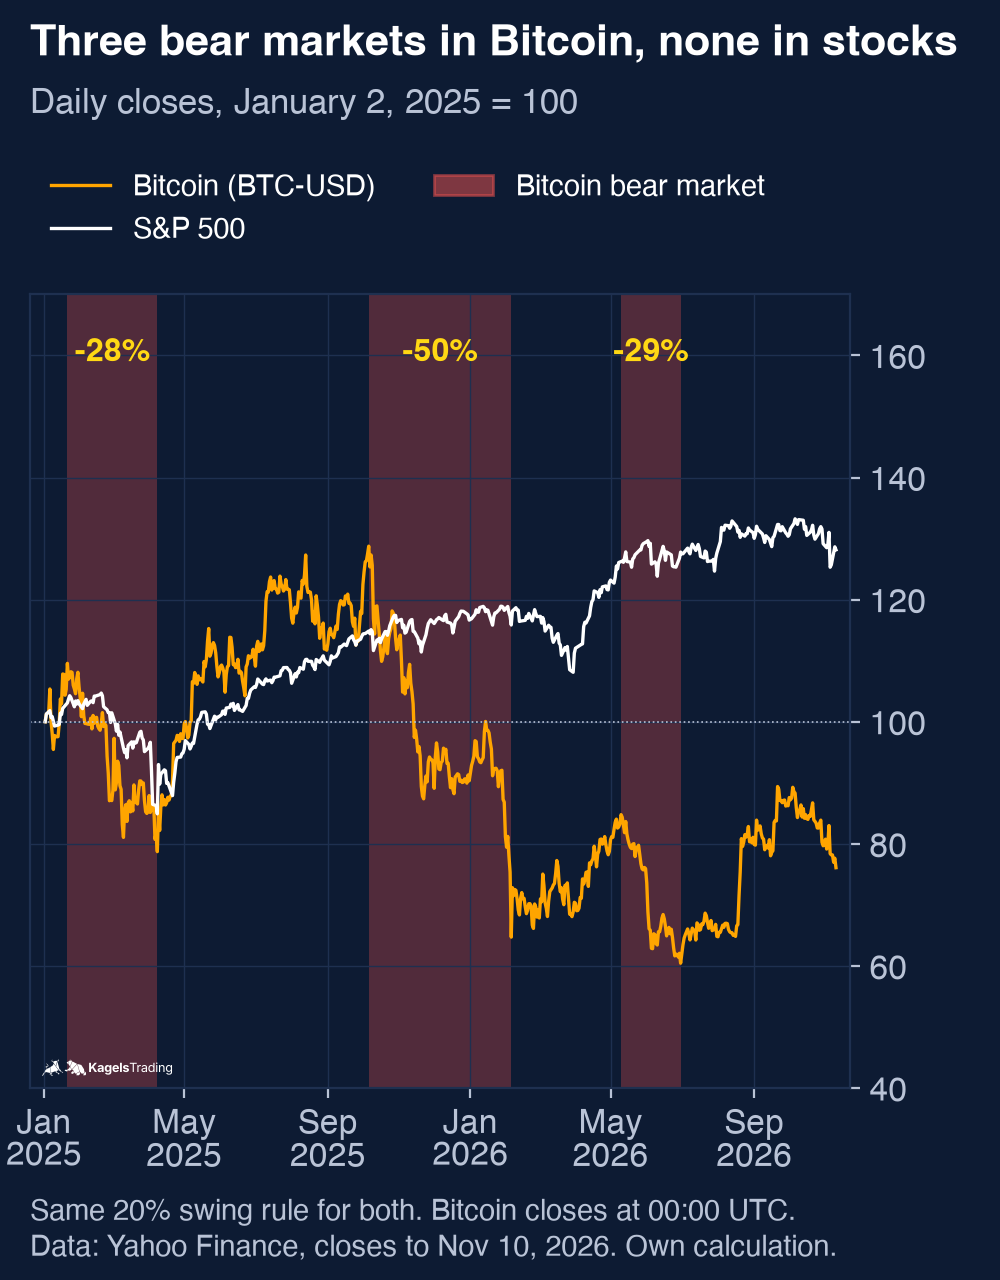
In cryptocurrencies, a bear market means something different than in stocks. The 20 percent rule is the same, but it triggers far more often, because prices swing much harder. Since 2014 I count 37 bear markets in Bitcoin with the same rule. Anyone who carries the terms from the stock market over one to one badly underestimates the risk.
 Click to enlarge
Source: Prices from Yahoo Finance, calculation and chart by Kagels Trading.
Bitcoin went through three bear markets since January 2025, the S&P 500 through none. The first cost 28.1 percent (January to April 2025), the second 49.7 percent (October 2025 to February 2026), the third 28.7 percent (May to June 2026). In November 2025 alone, Bitcoin fell from about $110,000 to about $90,000.
Since June 30, 2026, Bitcoin has been in an uptrend again by the swing rule. From the low of about $58,600 it rose to about $86,600 on September 21, 2026, which confirmed a new upswing. On November 10, 2026 it closed at about $73,700, about 15 percent below that high and still well above the low.
The practical lesson is uncomfortable. A portfolio of stocks and crypto can sit in two opposite market phases at the same time. The question “are we in a bear market?” can only be answered per asset class, not across the board.
How a bear market unfolds
Financial markets move in cycles, and a bear market is one station in them. First a bull market runs, carried by good news and rising expectations. At some point the trend tips. A second wave of selling then pushes prices below fair value and lays the ground for the next upswing.
There are two common models for the sequence. The first describes the market with Elliott waves, the second splits a bear market into seven phases. Both are frameworks for interpretation, not forecasting tools.
The bear market in Elliott wave theory
Elliott wave theory splits every market move into impulses and corrections. A full cycle has a five-wave impulse in the direction of the trend, followed by a correction. Inside the impulse, waves 1, 3 and 5 carry the trend, while waves 2 and 4 run against it. In the simplest picture, the correction after the impulse is labeled A, B and C, and a bear market is such a three-part decline; on a larger or smaller degree, the structure can look different.
The practical catch is clarity. Which wave is running can be identified cleanly only after it has ended. If you put the wave count on the live chart, you get different results on different time frames. As an explanation in hindsight the model is strong; as an entry signal it is weak.
The seven phases of a bear market
The second model describes a bear market through investor sentiment. It fits the burst of the dotcom bubble from March 2000, which dragged on for two and a half years.
- End of the boom: valuations are stretched, and the rise stops abruptly.
- First correction: prices fall clearly, and many still play the situation down.
- Early optimism: investors count on the central bank and expect one rate cut to be enough.
- Disillusion: an outside event makes the damage visible, in the example the attacks of September 11, 2001.
- Second false start: many think the worst is over. Short bear market rallies follow.
- Liquidation: whoever bought too early and took too much risk has to sell.
- Capitulation: sentiment hits bottom, and exactly there the market turns.
The last phase teaches the most. The turning point coincides with the moment when nobody wants to buy anymore. Whoever waits for good news before buying reliably misses it. The Fear and Greed Index is one way to put a number on this sentiment.
What is a bear market rally?
A bear market rally is a temporary price rise within a downtrend, after which the broader decline continues.
Whether it was a rally or a turn is clear only afterwards. If the decline goes on to new lows, the rebound was a rally; if it does not, the low was the end of the bear market. People usually speak of a bear market rally from a rise of about 5 to 10 percent. My counting rule treats a rise of 20 percent from the low as a new bull phase, even if a longer downturn later continues, as from September 2001 to January 2002; the low gets its date only once that rise is confirmed.
The slang name for it is dead cat bounce. The image is not nice, but it fits: even a dead cat bounces once if it falls from high enough. It means a recovery without a fundamental basis, often during a downtrend that is not over.
For traders a bear market rally is a chance, for investors a trap. Whoever trades short term with a clear exit can take the move. Whoever takes it for the trend change and buys for the long term buys right into the continuing decline.
How a bear market rally starts
It is usually triggered by bargain hunters. Speculators think the downtrend is over and buy to take a quick profit. Professionals call this bottom fishing. The demand lifts the price for a short time, although nothing has changed in the situation.
Technical reasons add to it. Whoever bet on falling prices has to close the short position at some point and buy back for that. This short covering strengthens the rise, although it expresses no positive expectation.
That is why the rebound is so convincing and so deceptive. It looks like the start of a bull market but feeds on closed positions and speculation. As soon as these purchases are used up, a second wave of selling often follows.
What is a bear trap?
A bear trap is a breakdown below a key level that fails right away and leaves the sellers with losses.
The sequence mirrors the bull trap. A price falls below an important support level, investors read this as a sell signal and get out or go short. Soon after, the price turns and climbs back above the level. Whoever sold has to buy back at a higher price. Traders who work with stop clusters know this pattern as a liquidity sweep, a dip that mainly collects stop orders.
A panic sale is something else. Both cost money, but for different reasons: the bear trap is a false technical signal, the panic sale an emotional decision after large paper losses. Whoever mixes the two looks for the solution in the wrong place.
Against the bear trap, confirmation helps; against panic, a plan. In the first case you wait to see whether the break holds instead of acting at once. In the second you set your risk before prices fall, including the position size and the exit.
Warren Buffett put the second lesson into words in October 2008, in the middle of the financial crisis. In his New York Times op-ed “Buy American. I Am.” he explained why he was buying US stocks while others panicked, under his simple rule: “Be fearful when others are greedy, and be greedy when others are fearful.” More on his approach is in my Warren Buffett profile.
Bear market, correction or crash?
The three terms are mixed up all the time, but they mean different things. The difference lies in the depth and the speed of the decline, not in how dramatic the headlines are.
| Term | Feature | Size |
|---|---|---|
| Pullback | normal swing within the trend | up to 10% |
| Correction | downward adjustment, trend intact | 10% to 20% |
| Bear market | downtrend over weeks to months | 20% or more |
| Crash | collapse within a few days | over 20% in days |
At its core, a correction is something healthy. It adjusts a price that had run away from reality and thereby lowers the risk of the investment. The most common cause is news that changes how a valuation is seen.
A crash is the opposite. It comes suddenly, its causes are unclear at first, and the risk-reward ratio does not automatically improve, because the companies themselves are hit too. It can take months until the damage becomes visible.
A crash and a bear market do not exclude each other. The collapse in March 2020 was both: a crash over 33 days and formally a bear market with a 33.9 percent loss. On the other hand, not every bear market starts with a crash; the one in 2022 dragged on for nine months.
Not every crisis reaches the stock market at all. Many political crises left little trace in the index. The crises with lasting market damage were mostly economic: the oil crisis of 1973, the dotcom bust, the housing crisis of 2007 to 2009.
The great bear markets in history
Since 1947 I count 14 bear markets in the S&P 500, nine of them began after 1970. Their duration by the swing rule ranges from 33 days to about 21 months. Nine of the 14 overlapped with a US recession; the others came in phases when the economy kept growing.
The table measures each episode from its high to its final low. That is the usual way to describe these crashes, and for 2000 to 2002 and 2007 to 2009 it gives larger declines than the swing rule, which splits both episodes in two. All figures are S&P 500 closes.
| Bear market | Period | Decline |
|---|---|---|
| Great Depression | 09/1929 to 06/1932 | −86.2% |
| Oil crisis | 01/1973 to 10/1974 | −48.2% |
| Black Monday | 08/1987 to 12/1987 | −33.5% |
| Dotcom bubble | 03/2000 to 10/2002 | −49.1% |
| Financial crisis | 10/2007 to 03/2009 | −56.8% |
| Covid crash | 02/2020 to 03/2020 | −33.9% |
| Rate hikes | 01/2022 to 10/2022 | −25.4% |
The crash of 1929
The crash of 1929 is still the worst bear market in stock market history. From the high in September 1929 to the low in June 1932, the S&P 500 lost 86.2 percent. The often quoted figure of “almost 80 percent” clearly understates the decline.
It was preceded by a speculative bubble on credit. Stocks were bought with borrowed money, and valuations ran ahead of earnings. A tight monetary policy and the lack of government intervention prolonged the Great Depression that followed.
The crash also produced a famous winner. Jesse Livermore was heavily short in 1929; later biographies put his profit at about $100 million, a figure without a contemporary record. In March 1934 he still filed for bankruptcy, which says more about bear markets than any statistic.
The dotcom bubble from 2000
On March 10, 2000, the Nasdaq Composite closed at its high of 5,048.62 points. By October 9, 2002 it had fallen to 1,114.11 points, a decline of 77.9 percent. Even established technology stocks lost more than 80 percent along the way.
The trigger was a valuation model without profits. Investors financed internet companies, many of which had no plan to make money. Companies such as Amazon and Microsoft survived; most did not.
The most common mistake about bubbles is in this case. People think they can recognize them while they form. In fact, a speculative bubble can almost always be named clearly only in hindsight.
The financial crisis of 2007 to 2009
Between October 2007 and March 2009, the S&P 500 lost 56.8 percent. By the interim low in November 2008 it was 51.9 percent; the real bottom came only in March 2009. The downturn was set off by a crisis in subprime mortgages, home loans to borrowers with weak credit.
The central bank response was without precedent. On December 16, 2008, the Federal Reserve cut its target for the federal funds rate to a range of 0 to 0.25 percent and kept it there until December 2015. On top came large bond purchases to push long-term rates down.
The Covid crash of 2020
The bear market of 2020 was the fastest in history. From the high on February 19 to the low on March 23, it took 33 days for a decline of 33.9 percent. The trigger was the Covid-19 pandemic, made worse by a simultaneous collapse in the oil market.
It was over just as quickly. As early as August 2020, the S&P 500 closed at a new record high again. The case shows that the speed and depth of a bear market say nothing about how long the recovery takes.
The rate hikes of 2022
The most recent bear market ran from January 3 to October 12, 2022. The S&P 500 lost 25.4 percent in a little over nine months. The trigger was the fastest series of rate hikes in decades: the Fed raised its target range from near zero in March 2022 to 5.25 to 5.50 percent by July 2023 to fight high inflation.
Unlike 2008 or 2020, there was no single moment of shock. Prices fell in steps over months, interrupted by several bear market rallies that were each taken for the turn. Exactly this pattern makes such phases so exhausting for investors.
Strategies that work in a bear market
First, the most important limit: nobody predicts a bear market reliably. This kind of market timing costs more than it earns over time. The following approaches therefore do not rely on prediction but on reaction.
Short selling
When you sell short, you sell a security you do not own. You borrow it, sell it at the current price and buy it back later at a lower price; the difference is your profit. In the US this needs a margin account and a borrow that your broker locates under the SEC’s Regulation SHO. If the price rises instead of falling, the loss is theoretically unlimited. That makes it the riskiest position on this list.
Hedging your portfolio
When you hedge, you protect an existing portfolio instead of selling it. A common way is a short position in an index future or index fund whose gains offset the losses in the portfolio. The advantage: you stay invested and do not have to find the right moment to get back in. The price is the cost of the hedge, which eats into returns in calm phases.
Put options
A put option gives you the right to sell a security at a fixed price until a set expiry date. A falling price generally helps a long put, but time decay and changes in implied volatility can offset that, and a put expires worthless if the underlying price is at or above the strike price at expiry. Unlike a short sale, the loss on the option itself is limited to the premium you paid, which makes the put the more conservative hedge. The basics are in options trading for beginners.
Focus on established companies
In downturns, companies with stable earnings tend to hold up better. Whoever picks stocks by this principle practices value investing: fundamental analysis estimates what a company is worth, and you buy below that value. Stable dividends and positive cash flow are the usual criteria.
Shifting between sectors
Not all industries fall equally hard. Defensive sectors such as consumer staples, health care and utilities have tended to hold up better in downturns than cyclical ones such as technology or autos. With sector ETFs you can do this without picking single stocks. Our check of the last three US recessions in the article on sector rotation shows it is a tendency: staples beat the S&P 500 all three times, utilities only once.
Inverse ETFs
An inverse ETF rises when its underlying falls. It mirrors the daily performance and is therefore also called a short ETF. The catch lies in the daily reset: over longer periods the return drifts away from the simple inverse, which FINRA has warned about since 2009. Suitable for short hedges, not as a permanent position.
Gold as a safe haven
Gold is seen as a refuge when stocks fall. It pays no interest and no dividend, but it benefits when investors put safety above return in a crisis. You cannot rely on it, though: in the 2008 financial crisis gold fell for a while as well, because investors sold it to meet margin calls elsewhere.
How to make money in a bear market
There are two very different paths, and they suit different people. One bets on falling prices, the other buys into the decline. Whoever mixes both without keeping them apart usually loses on both sides.
The active path means profiting from the decline. Short selling, put options and inverse ETFs are available for that. It needs a clear exit plan, because declines are faster and more abrupt than advances. Bear market rallies can turn a short position into a loss within days.
The passive path means buying cheaper. A bear market lowers the price of companies whose business runs unchanged. Whoever invests regularly automatically buys more shares for the same money in this phase. In the historical sample, the median from the low back to the old high was about 1.8 years, and for someone who bought earlier in the decline, the wait can be much longer.
What I do myself is neither one nor the other. I trade price action and do not ask whether the market falls or rises, but where the levels are at which this is decided. In a bear market these are the lower highs: as long as they hold, the downtrend is intact.
The most expensive mistake is the same on both paths. It is switching strategy in the middle of the decline. A long-term investor who starts to trade because prices fall makes the hardest decisions at the worst possible moment.
Opportunities and risks in a bear market
A bear market is the most unpleasant phase at the stock exchange, and still not only a loss. The following points sum up what can work for you and what costs you money, in five points each.
Opportunities in a bear market come from lower prices and a clear view of your own risk.
- Quality companies are cheaper without any change in their business.
- Regular investing buys more shares for the same money.
- History: the recovery from the low back to the old high took a median of about 1.8 years in the sample, price only.
- Hedges and short sales make falling prices tradable for active traders.
- Honesty: the phase shows how much risk you can really stand.
Risks in a bear market come from timing, false signals and your own emotions.
- Late signal: the start can only be dated in hindsight, so the signal always comes late.
- Bear market rallies look like the turn and cost money on both sides.
- Short sales carry a theoretically unlimited loss.
- Outliers: after 1929 the recovery took almost 25 years; the median hides such cases.
- Panic: selling at the low turns a paper loss into a real one.
Conclusion: a bear market is a counting rule, not the end of the world
A bear market is nothing more than a decline of at least 20 percent, identified after the fact. It tells you what happened, not what comes next. Whoever accepts this uses the term correctly: as a classification, not as a call to action.
The numbers from my count speak against panic. Of 27 bear markets since 1928, the typical one lasted about 8 months and cost about 33 percent. Bull markets lasted about two and a half times as long in the median. That is no guarantee, but it puts the size into perspective.
In practice this means: decide before, not during. Set how much decline you can stand and what you will do then, before prices fall. Whoever makes this decision only in the downturn makes it under the greatest possible pressure, and usually wrongly.
This article is market analysis, not investment advice. Past bear markets and recoveries do not show future results, and every number here depends on the counting rule described above.
Frequently asked questions about bear markets
What does bear market mean?
A bear market is a phase in which prices close at least 20 percent below their last high and the downtrend continues. It is measured on closing prices, usually over at least two months. In French and German texts the same phase is called baisse.
Are we in a bear market in 2026?
Not in stocks, but Bitcoin had three since 2025. The last bear market in the S&P 500 ended on October 12, 2022, and a bull market has been running since. Bitcoin is different: its last bear market ended on June 30, 2026.
How long does a bear market last on average?
Of 27 bear markets in the S&P 500 since 1928, the median one lasted about 8 months. The average is 9.4 months, and the range runs from 33 days to about 21 months. The recovery from the low back to the old high took a median of about 1.8 years.
When was the last bear market?
From January 3 to October 12, 2022. The S&P 500 fell from 4,796.56 to 3,577.03 points, a loss of 25.4 percent. The trigger was the fastest series of rate hikes in decades.
What is the difference between a bear market and a bull market?
In a bear market prices fall at least 20 percent below their last high; in a bull market they rise at least 20 percent above their last low. In the median, bull markets lasted about two and a half times as long as bear markets. The French terms are baisse and hausse.
How do I recognize a bear market rally?
A bear market rally is a rebound after which the decline continues to new lows. Typical rallies are 5 to 10 percent, and you can be sure only in hindsight. By the 20 percent rule used here, a rise of 20 percent from the low counts as a new bull phase.
What should I do as an investor in a bear market?
Most important is not to switch strategy in the middle of the decline. Long-term investors benefit from buying regularly, because they get more shares for the same money. Whoever trades actively needs a fixed exit point before entering a position.
This US edition is based on our German edition on kagels-trading.de and has been adapted for US readers.
More Markets and Brokers guides
- Open your first account
What Is a Brokerage Account? A US Beginner's Guide
How to open and fund a US brokerage account, cash vs margin, what it costs and what SIPC and FDIC really cover.
- Know what trading really costs
Trading Costs: Every Fee You Pay and How to Cut It
Spread, commissions, SEC and FINRA fees, market data, margin interest and tax, with yearly totals for three trading styles.
- Choose a broker
Interactive Brokers Review 2026: Fees and Platforms
Fees, platforms, investor protection and real futures commissions from a client since 1996.
- Check an offshore broker
PU Prime Review 2026: FCA Warning, Licences and Costs
Which PU Prime company you contract with, what the FCA warning means, and what 1:1000 leverage and the deposit bonus do to your account.
- Check an EU CFD broker
Tradeview Review 2026: Tradeview Europe, MFSA and Costs
What the Malta licence of Tradeview Europe covers, how it differs from the Cayman company, and what the three MetaTrader 5 accounts cost.
- Check CopyX
CopyX Review 2026: Is TAG Markets Copy Trading Legit?
Who runs the TAG Markets copy trading platform, which regulators warn about it, why US residents are excluded and how fast the 12x Amplify account eats your deposit.
- Choose a US forex broker
OANDA Review 2026: Fees, TradingView and US Rules
OANDA from its own pages and NFA records: spreads and fees, TradingView and the demo, FIFO and three penalties.
- Understand your price
Market Makers: Who Sets Your Price and How They Profit
How market makers earn on the spread, who sets prices at German trading venues and what the EU ban on payment for order flow changed.
- Size up a bull market
Bull Market: How Long It Lasts and How to Spot the End
When a rise becomes a bull market, how long the 27 completed S&P 500 bull markets since 1928 lasted and gained, and where the current one stands.
- Read bond market stress
MOVE Index: The VIX of the Bond Market, Explained
What the MOVE index measures, which readings signal stress, how it differs from the VIX and where its limits are.
- Read stock market fear
VIX Index: What the Fear Gauge Measures and Normal Levels
What the VIX measures, which levels have been normal since 1990, how closely it tracks the S&P 500 and how VIX futures, options and ETPs work.
- Read the risk mood
Risk-On vs Risk-Off: Meaning, Assets and Indicators
What risk-on and risk-off mean, which assets rise and fall in each mode, five market shocks since 2008 and the VIX, DXY and AUD/JPY signals.
- Read market sentiment
Fear and Greed Index: How It Works, Tested Since 2021
How CNN builds its Fear and Greed Index from seven measures, what the zones mean and how the S&P 500 moved after readings below 20.
- Trade an index CFD
Index CFDs at Interactive Brokers: Symbols, Costs and Trading
All 13 IBKR index CFDs, margin, stop and close-out worked through for IBDE40, financing, UK hours and the TradingView limit.
- Size an index future
Micro Futures: MES vs MNQ, Tick Values and Risk
MES and MNQ tick values, a worked sizing example from the stop with costs and slippage, and why margin is not your risk.
- Choose between futures and CFDs
Futures vs CFDs: Regulation, Order Execution and Costs
Who your counterparty is, EU, UK and US rules, how stops are triggered on CME and at CFD providers, and booked costs in a DAX example.
- Read the futures curve
Contango vs Backwardation: Futures Curves Explained
What contango and backwardation mean, what rolling does to a position in each case, and real gold, oil and gas curves from 28 October 2026.
- Understand the spot market
Spot Market Explained: Definition and Settlement Times
What a spot market is, why two days is a minimum and not a limit, and when stocks settle at T+1 in the US, EU, UK and Switzerland.
- Choose a silver future
Silver Futures: SI vs Micro Silver vs 100-oz SIC
SI, Micro Silver and the 100-ounce SIC compared by tick value, risk per contract, margin and December 2026 deadlines.
- Read the chip sector
SOX Index: Holdings, Weighting and How to Use It
What the SOX holds, how Nasdaq caps the weights, its largest declines since 2004 against the Nasdaq-100 and which ETFs really track it.
- Read the biotech sector
Nasdaq Biotechnology Index: Holdings, Weighting and Risks
What the NBI holds, how Nasdaq caps the weights, its long declines since 2003 against the Nasdaq-100 and which ETFs really track it.
- Read the transport sector
Dow Jones Transportation Average: Stocks and Dow Theory
The 20 stocks in the Dow transport index, why the share price sets their weight, declines since 1992 and what Dow Theory can and cannot tell you.
- Read the French market
CAC 40 Index Explained: All 40 Stocks, Weights and Trading Hours
All 40 CAC 40 stocks, how Euronext caps the weights at 15 percent, trading hours in Eastern Time and how it differs from the DAX.
- Research stocks
InvestingPro Review: Screener, ProPicks AI and WarrenAI
What the InvestingPro screener, ProPicks AI and WarrenAI do, what Pro and Pro+ cost and who needs which plan.
- Judge a stock-picking newsletter
Motley Fool Stock Advisor Review: Cost and Track Record
What Motley Fool Stock Advisor costs after the first year, how the advertised return is calculated, refund and renewal terms, and who it suits.
- Use the free news portal
Investing.com Review: Free Tools, Data and Limitations
What the free Investing.com portal does well, where the quote prices come from and when InvestingPro is worth paying for.
- Find real AI revenue
AI Stocks 2026: How Listed Companies Earn From AI
Which listed companies earn from AI in cloud, software, infrastructure and chips, disclosed AI revenue against hope, plus AI ETFs and risks.
- Compare AI data center suppliers
AI Infrastructure Stocks: 10 Data Center Suppliers Compared
Ten suppliers for power, cooling, servers and optics compared on free cash flow, customer concentration and next dates, with filters and a two-stock comparison.
- Follow an IPO
Anthropic Stock: IPO Date, Valuation and How to Invest
Where the Anthropic IPO stands, how the valuation compares with revenue and how to get exposure before and after the listing.
- Invest in OpenAI before the IPO
OpenAI Stock: Can You Buy It, and Who Owns OpenAI?
Why there is no OpenAI stock yet, who owns OpenAI, where the IPO stands and how much OpenAI you get through Microsoft or SoftBank.
- Understand a stock split
Stock Splits Explained: Forward and Reverse Splits
What forward and reverse splits change and what they do not, the dates that matter, what happens to options and the $1 listing rule.
- Analyze a company
Fundamental Analysis: 12 Ratios, a Worked Example, 5 Steps
Twelve ratios with formulas and rules of thumb, worked through Microsoft's 2026 annual report, a five-step process and the fundamentals of forex, commodities and crypto.
- Value a stock
Value Investing: Intrinsic Value, Margin of Safety, Traps
Intrinsic value against price, a worked DCF with a sensitivity table, Coca-Cola as a real example, the value premium since 1926 and value traps.
- Value a new listing
SpaceX Stock (SPCX): Valuation, Risks and How to Buy
How to buy SpaceX stock, what the company is worth after the IPO and which risks the lock-up calendar brings.