
Crude Oil Forecast: WTI and Brent, Levels and Scenarios


This analysis is from 11 October 2026. Prices have moved since, so the levels below may no longer apply until the next update.
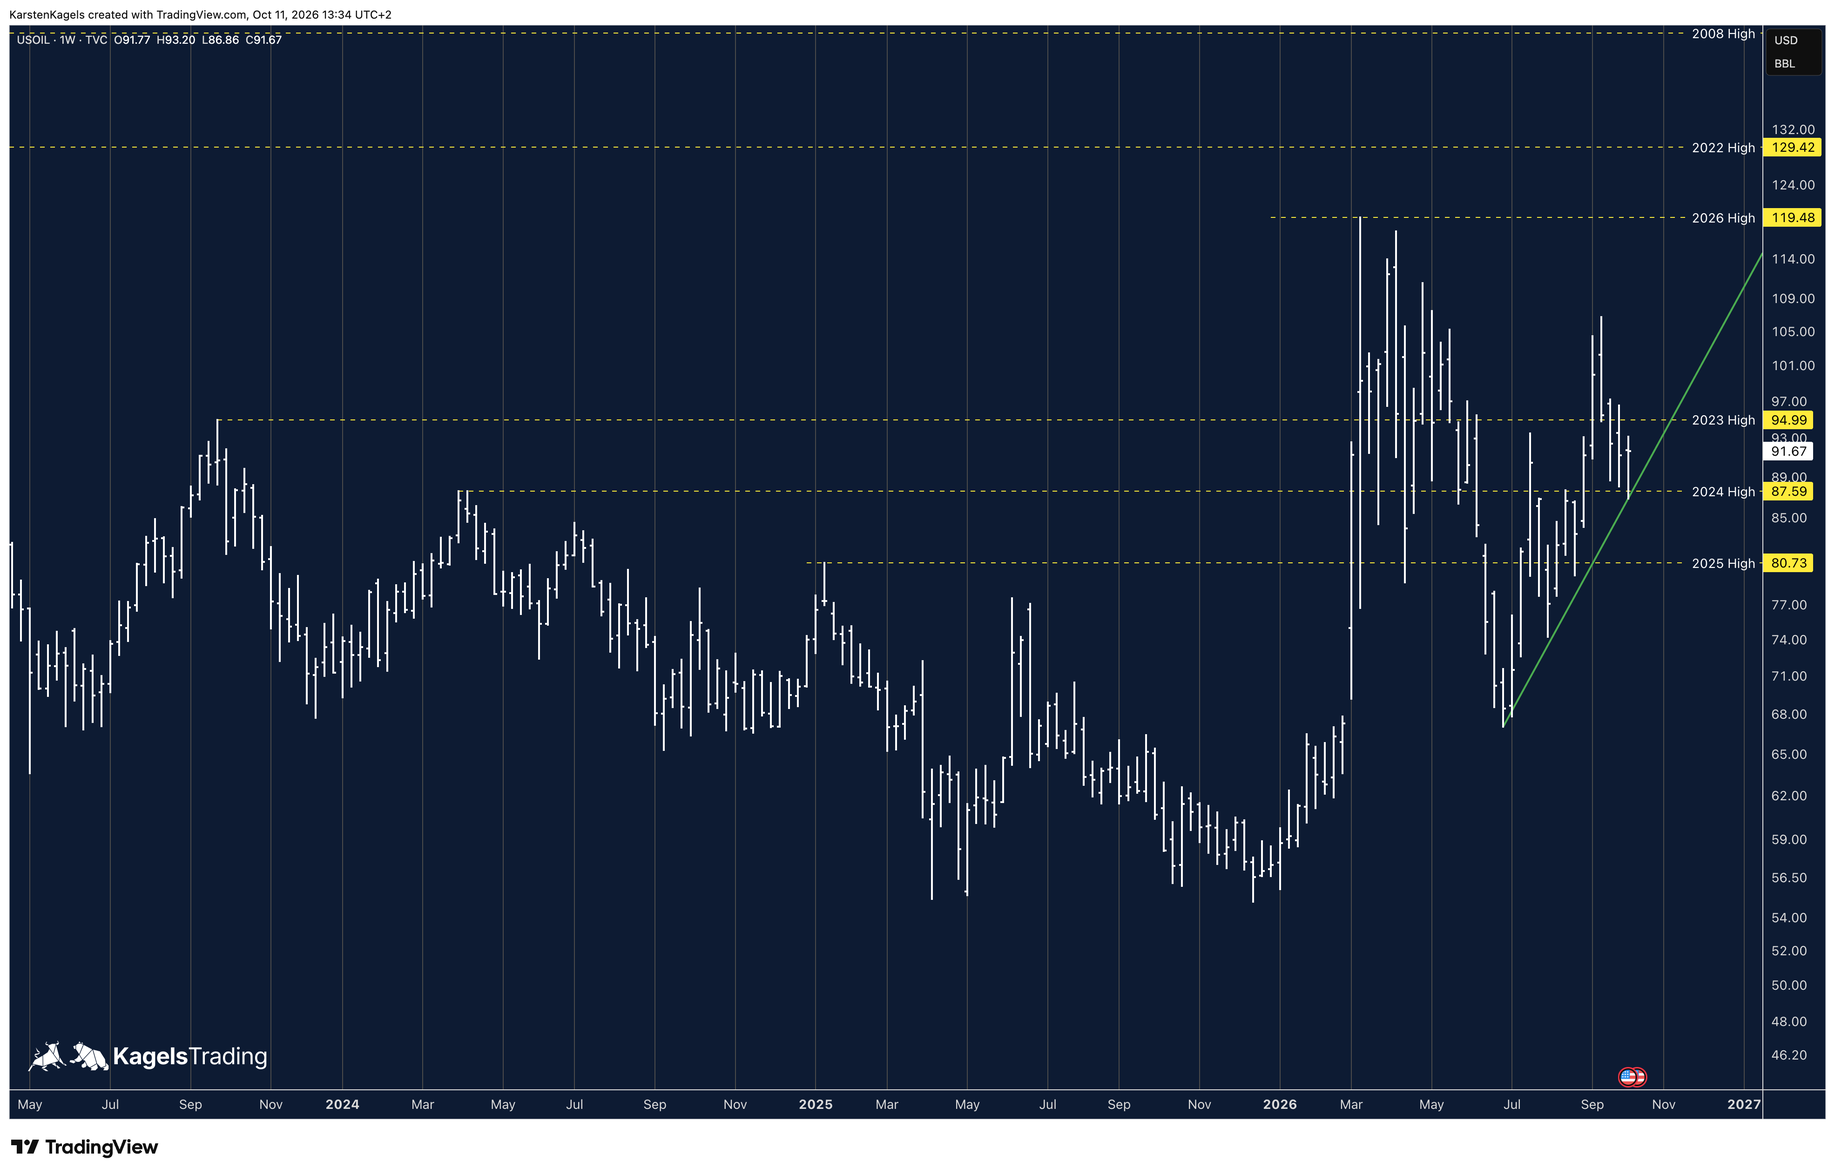
For four weeks the oil price corrected from the September high. Now the week has closed as a doji right at the 2024 high, with a close of $91.67. The support held and the uptrend since July is intact. To the upside the 2023 high stands in the way first.
Crude Oil forecast in 30 seconds
The situation
An uptrend taking a breather. After four weeks of correction the week closed as a doji at $91.67 (US Oil, 9 October).
The level that has to hold
The zone of the 2024 high at $87.59 and the September low at $86.13. Below it lies the 2025 high at $80.73.
Next target to the upside
The 2023 high at $94.99, then the September high at $106.75.
What comes next
US inventory data on Thursday, 15 October, OPEC+ on 1 November. Next review at the weekly close, earlier if a level breaks.
On this page
- Crude Oil forecast in 30 seconds
- The oil market in the week to 9 October: a doji at the 2024 high
- Three scenarios: which level decides
- The monthly picture: a correction from the high of the year, an uptrend since July
- Brent in the daily chart: an established uptrend, target the high of the year
- Why the charts now show US Oil and UK Oil
- What could move the price next
- The longer view: the yearly chart and the agencies
- Conclusion: uptrend intact, the support has held
- How this forecast is made
- Frequently asked questions about the crude oil forecast
- Please note
The oil market in the week to 9 October: a doji at the 2024 high
 Click to enlarge
The weekly chart shows where the oil price stands. From this week on, the charts run on the US Oil price (USOIL), which is WTI as most traders see it in CFD trading; until last week it was the CL1! future. The week opened at $91.77, rose to $93.20, fell to $86.86 and closed at $91.67.
Open and close are almost level, so the week is a doji. A doji is a candle without a real body: buyers and sellers held each other in balance over the week. After four weeks of correction from the September high, that can mean the selling pressure is easing; the next weeks have to confirm it.
The 2024 high has held. The weekly low at $86.86 was just below the 2024 high at $87.59, the close clearly above it again, so the level worked as support. The green medium-term uptrend line from the July low runs in the same area. A little lower lies the September low at $86.13.
Overall the picture looks good for rising prices again. The uptrend since July is intact and the support has held. The first hurdle to the upside is the 2023 high at $94.99.
At the weekly close a barrel of US Oil costs $91.67. A barrel holds 42 US gallons or 158.99 litres, so the crude oil equivalent is about $2.18 per gallon or $0.58 per litre. Those are not retail fuel prices, which add refining, transport, taxes and margin.
Resistance
- $94.99
Price at analysis$91.67
Support
- $87.59
- $86.13
Three scenarios: which level decides
The 2023 high above and the September low below decide. The price levels come from Karsten's charts; the closing conditions are an editorial guideline. They are reference levels, not order rules.
What counts is the daily close in the US Oil chart (USOIL). A daily close beyond the level named confirms a scenario, and a following daily close back on the other side takes it off the table. Intraday spikes without a close do not count; the weekly close comes on top as extra confirmation, it does not replace the rule.
Bullish: above the 2023 high
Applies if US Oil rises above the 2023 high at $94.99 on a daily close. Then the uptrend since July carries on, and the September high at $106.75 comes into view, after that the high of the year at $119.48. A following daily close back below $94.99 cancels this path.
Wait: between the September low and the 2023 high
As long as the daily closes stay between $86.13 and $94.99, neither side has won. That is the case right now. Until then this card applies; after a daily close beyond one of the two levels the bullish or the bearish card takes over. No setup is a valid result in this situation too.
Bearish: below the September low
Applies if US Oil falls below the September low at $86.13 on a daily close. Then the zone at the 2024 high is broken and the way to the 2025 high at $80.73 is clear. The green uptrend line runs in the same area and can break earlier. A following daily close back above $86.13 cancels this path.
Resistance
- $119.48
- $106.75
- $94.99
Support
- $87.59
- $86.13
- $80.73
The monthly picture: a correction from the high of the year, an uptrend since July
 Click to enlarge
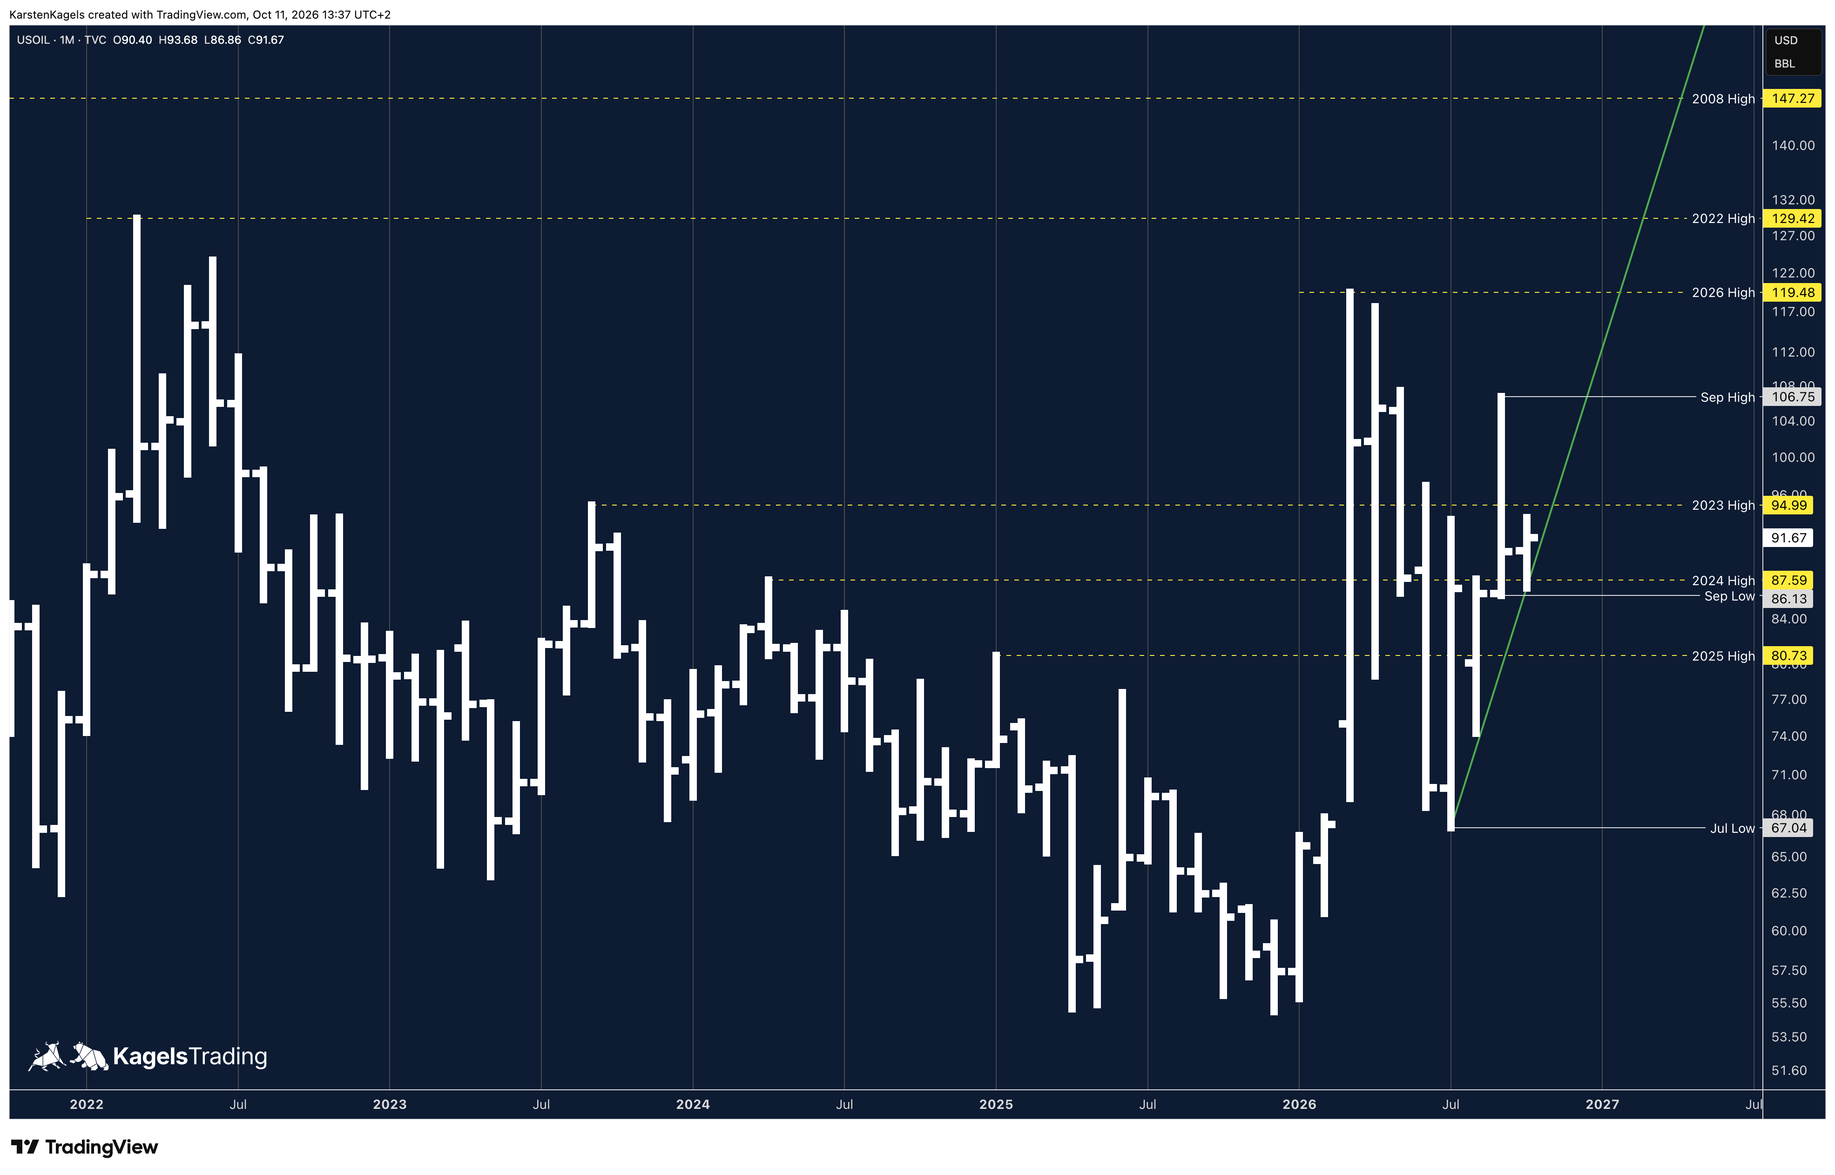
One time frame higher the big move of the year becomes visible. From the 2026 high at $119.48 in March the oil price corrected down to the July low at $67.04. Since then it has been rising again, in September up to $106.75.
So far October is holding above the September low. It opened at $90.40, its low is $86.86 and so above the September low at $86.13; at the weekly close it stands at $91.67. The monthly candle is only two weeks old and not finished.
The supports lie close together. The September low at $86.13 and the 2024 high at $87.59 together form the zone that has to hold. The most important resistance is the 2023 high at $94.99: if it is taken, the September high at $106.75 comes into view, and after that the high of the year.
Brent in the daily chart: an established uptrend, target the high of the year
 Click to enlarge
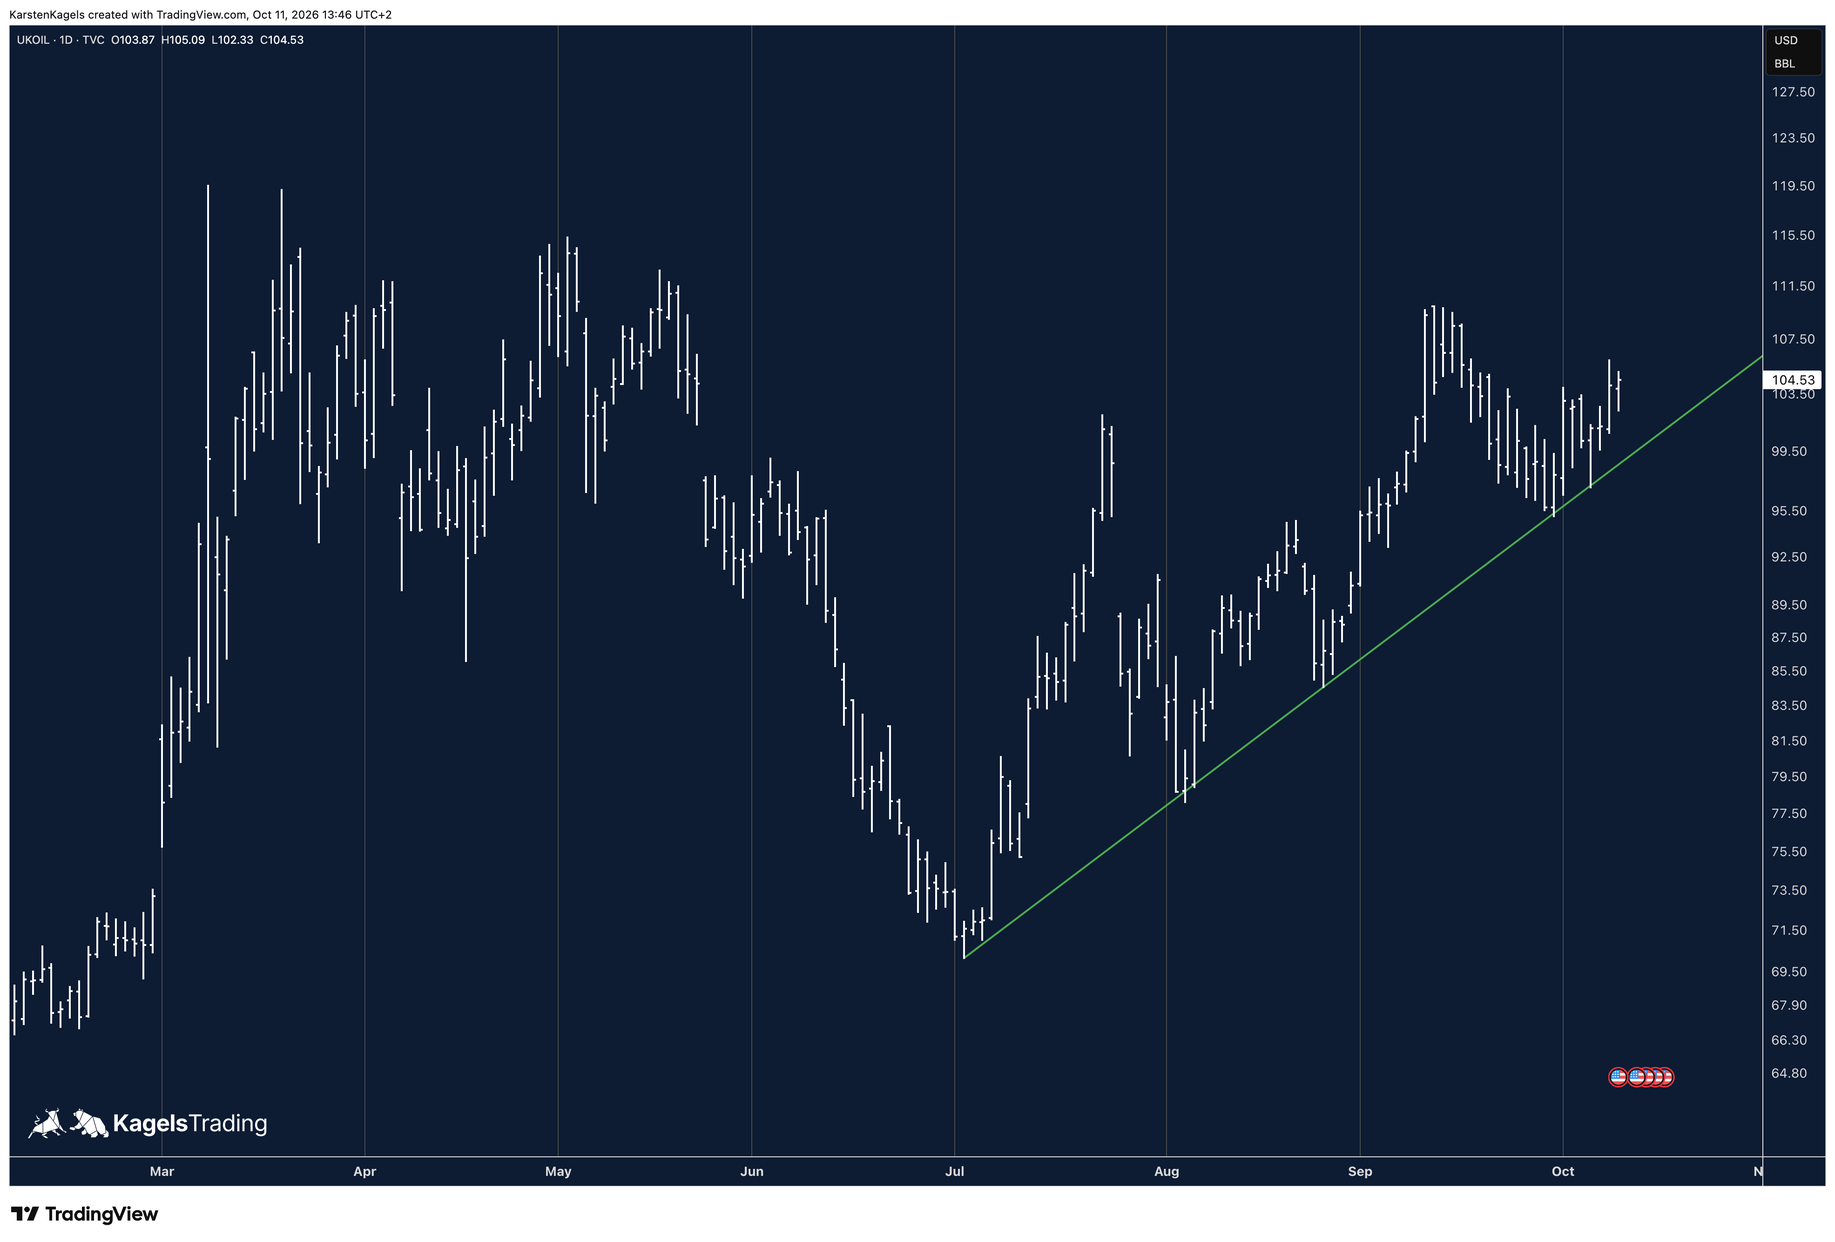
In Brent the uptrend is established. The North Sea grade, listed as UK Oil (UKOIL) in CFD trading, has been rising since the July low. The trend is confirmed by the green uptrend line, which was tested several times and held most recently at the end of September and the start of October. On Friday Brent opened at $103.87, rose to $105.09 and closed at $104.53.
The price target is the high of the year from March. On the daily chart it lies just below $120. As long as the trend line holds, this path stays open; if it breaks on a daily close, the picture has to be reassessed.
Brent trades well above WTI. At the weekly close almost $13 separated UK Oil and US Oil. Brent is the benchmark for the oil price in Europe, WTI for the United States; both move in the same direction, but each grade has its own levels.
Why the charts now show US Oil and UK Oil
From this week the forecast follows the CFD prices. US Oil (USOIL) and UK Oil are the prices of WTI and Brent as most private traders trade them through their CFD broker. The futures CL1! and BRN1!, on which the charts ran until now, always show the front contract; at the monthly rollover the chart shows a jump that is not a market move.
The WTI levels shift by only a few cents. The 2024 high was $87.67 in the future and is $87.59 on the US Oil chart, the 2023 high $95.03 against $94.99. Anyone comparing this forecast with a futures chart has to allow for that gap.
What could move the price next
Three dates are coming up soon. They are occasions to read the chart again, not a forecast of a particular reaction.
15 October, 12:00 pm New York time (18:00 CEST): the weekly US oil inventory data from the EIA. Because of Columbus Day on Monday, they come out on Thursday this time instead of the usual Wednesday (EIA release schedule).
1 November, OPEC+: the next meeting of the seven countries with voluntary production adjustments. On 4 October they kept the September production level for November as well (OPEC statement of 4 October 2026).
10 November, EIA Short-Term Energy Outlook: the next edition of the price and production estimates. The current one from 6 October raised the Brent estimate sharply (figures in the longer view below).
On top of that comes the news around the Iran war. In its October outlook the EIA assumes that oil flows from the Middle East through the Strait of Hormuz and over the alternative routes stay constrained through the fourth quarter; it puts the region's shut-in production in that quarter at an average of 4.5 million barrels a day. The attacks on the East-West pipeline in Saudi Arabia, one of the most important bypasses of the strait, showed in September how quickly that can change. New reports of attacks or negotiations are therefore a reason to check the scenarios again.
The longer view: the yearly chart and the agencies
 Click to enlarge
This part is written for readers who look beyond the day. It is reviewed at the start of the month, not daily.
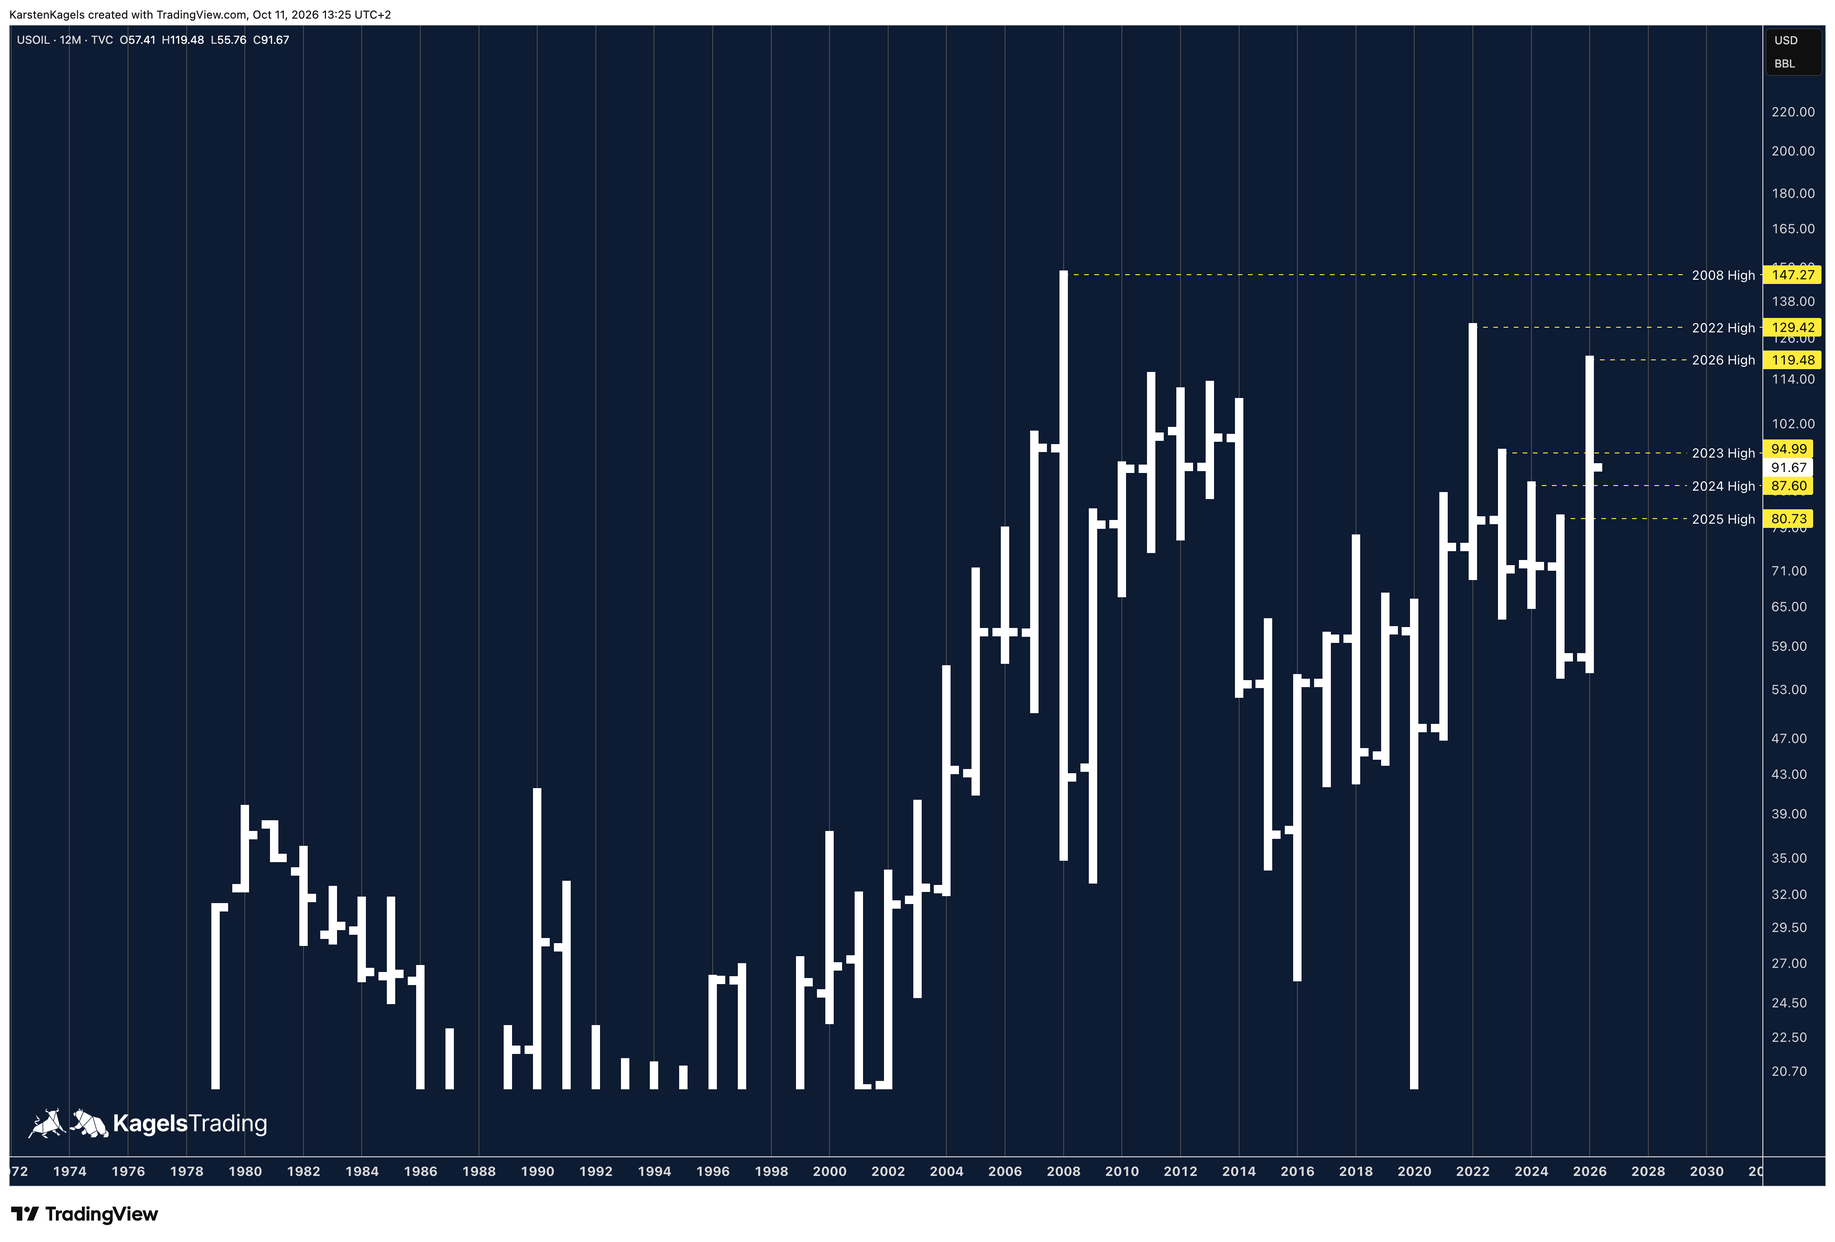
In the yearly chart the direction is clear: crude oil is in an uptrend. The year 2026 opened at $57.41 and, after the high of $119.48, stands at $91.67. The most important levels are the previous yearly highs: 2025 at $80.73, 2024 at $87.59 (rounded to $87.60 in the yearly chart), 2023 at $94.99, 2022 at $129.42 and the record high of 2008 at $147.27.
The longer-term price target is the 2026 high. As long as the uptrend holds, a return to $119.48 is the target; above it lie the 2022 high and the record high. That is a chart observation with a condition, not a promise: if the zone at the 2024 high breaks, the picture shifts.
Oil in 2026 so far: WTI opened the year at $57.41, fell to its low for the year at $55.76 on 7 January and reached $119.48 on 9 March. Until July the market unwound the risk premium, and since then it has been rising again.
The US Energy Information Administration has raised its price estimate sharply. In its Short-Term Energy Outlook of 6 October 2026 the EIA expects Brent spot prices to average $105 a barrel in the fourth quarter of 2026, $14 more than in September. For the whole of 2026 it expects $96, for 2027 $84 instead of $74 before. It names the attacks on oil infrastructure in the Gulf and the very tight diesel market as reasons. Those are spot-price averages, not price targets for the chart; the next edition comes out on 10 November.
Conclusion: uptrend intact, the support has held
The oil market has defended its support. After four weeks of correction the week closed as a doji at the 2024 high; the uptrend since July and the larger uptrend in the yearly chart are intact. In the daily chart Brent shows an established uptrend with the high of the year as its target.
The decision hangs on two levels. To the upside it is the 2023 high at $94.99: a daily close above it turns the focus to the September high at $106.75 and later to the high of the year at $119.48. To the downside it is the zone between $86.13 and $87.59; a daily close below the September low opens the way to the 2025 high at $80.73.
How this forecast is made
This page is built for traders. It names where the price stands, the next level that matters and the two possible paths, each with the condition that takes it off the table. It is updated at least at every weekly close and says openly when there is no clear picture. The page follows our editorial policy.
The charts are Karsten’s own, drawn on the CFD prices. WTI is US Oil (TVC:USOIL), Brent is UK Oil (TVC:UKOIL), both on TradingView; until 2 October 2026 the charts ran on the futures CL1! and BRN1!. The quoted levels are read from these charts, so they are chart readings and not official settlement prices, and each caption carries its own time and price. The charts of this update were exported on 11 October 2026 between 13:25 and 13:46 CEST and all show the Friday close. Energy markets move together, which is why the natural gas forecast belongs next to this page.
Frequently asked questions about the crude oil forecast
Will the oil price rise or fall?
The direction for tomorrow cannot be predicted, but you can say how to recognise it. The trend points up; the week to 9 October closed at $91.67 as a doji at the 2024 high (US Oil). A daily close above the 2023 high at $94.99 turns the focus to the September high at $106.75. A daily close below the September low at $86.13 makes the 2025 high at $80.73 the target. In between there is no confirmed signal. What counts each time is the daily close in the US Oil chart.
Will the oil price fall again?
In the short term that hangs on one zone. The September low at $86.13 and the 2024 high at $87.59 are the next support; in the week to 9 October they held. A daily close below $86.13 turns the focus to the 2025 high at $80.73. Over the longer run the EIA expects falling prices: after $105 in the fourth quarter of 2026, an average of $84 a barrel for Brent spot in 2027 (outlook of 6 October).
How will the oil price develop tomorrow and in the next few days?
As long as neither level breaks, the range is the frame, tomorrow included. The 2023 high at $94.99 caps the market, the zone between $86.13 and $87.59 carries it. Only a daily close beyond one of those levels decides the direction (as of the weekly close on 9 October 2026). The next occasions are the US inventory data on 15 October and the OPEC+ meeting on 1 November.
Why is the oil price rising or falling today?
After four weeks of correction the market has found its footing at the 2024 high. The week to 9 October closed almost at its opening price, buyers and sellers held each other in balance. In the short run three things move the price above all: news around the Iran war and the Strait of Hormuz, OPEC+ production policy, and the weekly US inventory data from the EIA. The dollar matters as well, because oil is settled in dollars.
Please note
The scenarios are a personal assessment based on experience, not a certainty. This is market analysis, not investment advice. Crude oil reacts to political news within minutes: keep your position sizes in line with your own risk management.
This forecast is translated from the German edition on kagels-trading.de.
How our forecasts are made and reviewed: How we work.