
MOVE Index: The VIX of the Bond Market, Explained


Contents
- The MOVE index in 30 seconds
- What is the MOVE index?
- How is the MOVE index calculated?
- What is a normal MOVE level, and what signals stress?
- MOVE index vs VIX: what is the difference?
- How does the MOVE index affect the stock market?
- What drives the MOVE index higher?
- Where can I see the MOVE index today?
- Strengths and limits of the MOVE index
- Conclusion: the MOVE shows expected volatility, not direction
- Frequently asked questions about the MOVE index
- About the author
In October 2008 the MOVE index stood at 264.6 points; on September 29, 2020 it closed at 36.6. Between panic and calm the US bond market swings by almost a factor of seven, and that is what this index measures: how strongly professionals expect US interest rates to move over the coming weeks.
Here you will learn how the MOVE is calculated, which readings are normal and where it differs from the VIX. The article also includes our own analysis of almost 24 years of data: how widely S&P 500 returns were spread after high MOVE readings.
The MOVE index in 30 seconds
- The MOVE index is a volatility index for the US bond market. It shows how much the yields of US interest rate instruments are expected to swing over the coming month, expressed in annualized basis points, which is why it is called the VIX of bonds.
- ICE calculates it from options with one month to expiry. They cover maturities of 2, 5, 10 and 30 years, and the 10-year counts double.
- On September 29, 2026, CNBC showed the MOVE at 106.60. Over the previous twelve months it ranged between 55.77 and 115.02.
- The median of our data series since November 2002 is 80.1. The highest reading in the series, 264.6, dates from the financial crisis in October 2008.
- MOVE and VIX often move together, but not always. On 795 days with a MOVE of 120 or more, the VIX was at 25 or higher on only 404 of them.
- Higher MOVE readings were followed by more dispersed stock returns. The standard deviation of S&P 500 returns over 21 trading sessions was about twice as high; our analysis does not show that the MOVE predicts direction.
What is the MOVE index?
The MOVE index is a volatility index for the US bond market. Based on current option prices, it shows how much the yields of US interest rate instruments are expected to swing over the coming month. It is quoted in basis points on an annualized basis.
Its full name is the ICE BofA U.S. Bond Market Option Volatility Estimate Index. The name MOVE goes back to its days at Merrill Lynch; today it is calculated by the exchange and data group ICE.
The index was developed by Harley Bassman, then a derivatives trader at Merrill Lynch. He wanted to make volatility tangible for his clients as a risk of its own, according to his biography. In August 2019 ICE took over the index, together with other volatility indices, from Bank of America Merrill Lynch, as The Bond Buyer reported.
It measures expected volatility in the market for US interest rates, not the price of a bond. A reading of 100 does not mean something rises by 100 percent. It means the market prices in large rate moves. Bond prices and yields move in opposite directions, so volatile yields also mean a volatile bond price.
How is the MOVE index calculated?
The MOVE is built from four options with one month to expiry, each struck at the money. According to a market report by the US asset manager NISA, they are written on interest rate swaps with maturities of 2, 5, 10 and 30 years. Their prices give the expected swing in yields, which is then averaged with fixed weights.
| Maturity | Weight | Stands for |
|---|---|---|
| 2 years | 20% | Expectations for the Fed |
| 5 years | 20% | Middle maturities |
| 10 years | 40% | Benchmark maturity of the bond market |
| 30 years | 20% | Long maturities |
The 10-year maturity has the largest weight, at 40 percent. It is seen as a key benchmark in the bond market, and mortgage rates and corporate bonds take their cue from it. The public sources do not give a reason for the weighting. The 2-year maturity reacts mainly to expectations for future rate decisions of the Fed.
There are two descriptions of what the options are written on. ICE’s current MOVE product page describes options on US interest rate swaps; its 2019 announcement of the acquisition described options on US Treasuries. We could not verify a dated methodology-change notice. Besides the one-month version, ICE also offers versions with three and six months.
MOVE expresses one-month implied yield volatility on an annualized basis, in basis points. One basis point is a hundredth of a percentage point. A reading of 100 corresponds to roughly 29 basis points of one-month standard deviation under square-root-of-time scaling. It is neither a one-year forecast nor a guaranteed trading range. In an interview with ICE, Harley Bassman translates a reading of 100 into roughly 6 basis points of daily movement.
What is a normal MOVE level, and what signals stress?
The median of all daily closes in our data series since November 2002 is 80.1. In the calm years from 2010 to 2019 it was only 69.9. Readings below 60 point to a very quiet rate market; readings above 120 have so far occurred mainly during crises or fast turns in interest rates.
The highest readings each fall into well-known stress periods. The table shows selected peaks and the low of the last 24 years from our downloaded Yahoo series. The events next to them happened at the same time; that alone does not prove a single cause.
| Date | Close | Background |
|---|---|---|
| Oct 2008 | 264.6 | Lehman collapse |
| Mar 9, 2020 | 163.7 | Covid crash |
| Sep 29, 2020 | 36.6 | Policy rate near zero |
| Oct 12, 2022 | 160.7 | Fed tightening |
| Mar 20, 2023 | 182.6 | Silicon Valley Bank failure |
| Apr 8, 2025 | 139.9 | New US tariffs |
| Mar 26, 2026 | 115.0 | High of the last 12 months |
The table uses daily closes from the downloaded Yahoo series. It covers 5,899 trading days from November 12, 2002 to September 21, 2026. For March 2023, ICE reports a higher value (see below), and sources give different days for the 2008 peak.
ICE reports a March 2023 high of about 198.7. That figure is in ICE’s monthly report for December 2023. Our downloaded Yahoo closing-price series gives a different peak, 182.6 on March 20. Because the feeds differ, we do not use that file to overturn the reported historical high.
On September 29, 2026 the MOVE stood above its long-term median. CNBC showed 106.60 at 4:17 p.m. ET that day, after a prior close of 101.82. In January 2026 it had marked the lowest reading of the previous twelve months at 55.77.
MOVE index vs VIX: what is the difference?
Both indices measure expected swings from option prices, but in different markets. The VIX looks at options on the S&P 500, as its provider Cboe describes it. It is quoted in annualized percent, the MOVE on the US rate market in annualized basis points. That is why the numbers cannot be compared directly: a VIX of 16 and a MOVE of 106 can both be normal at the same time. The chart below shows both indices since 2002, one above the other, with five selected stress periods.
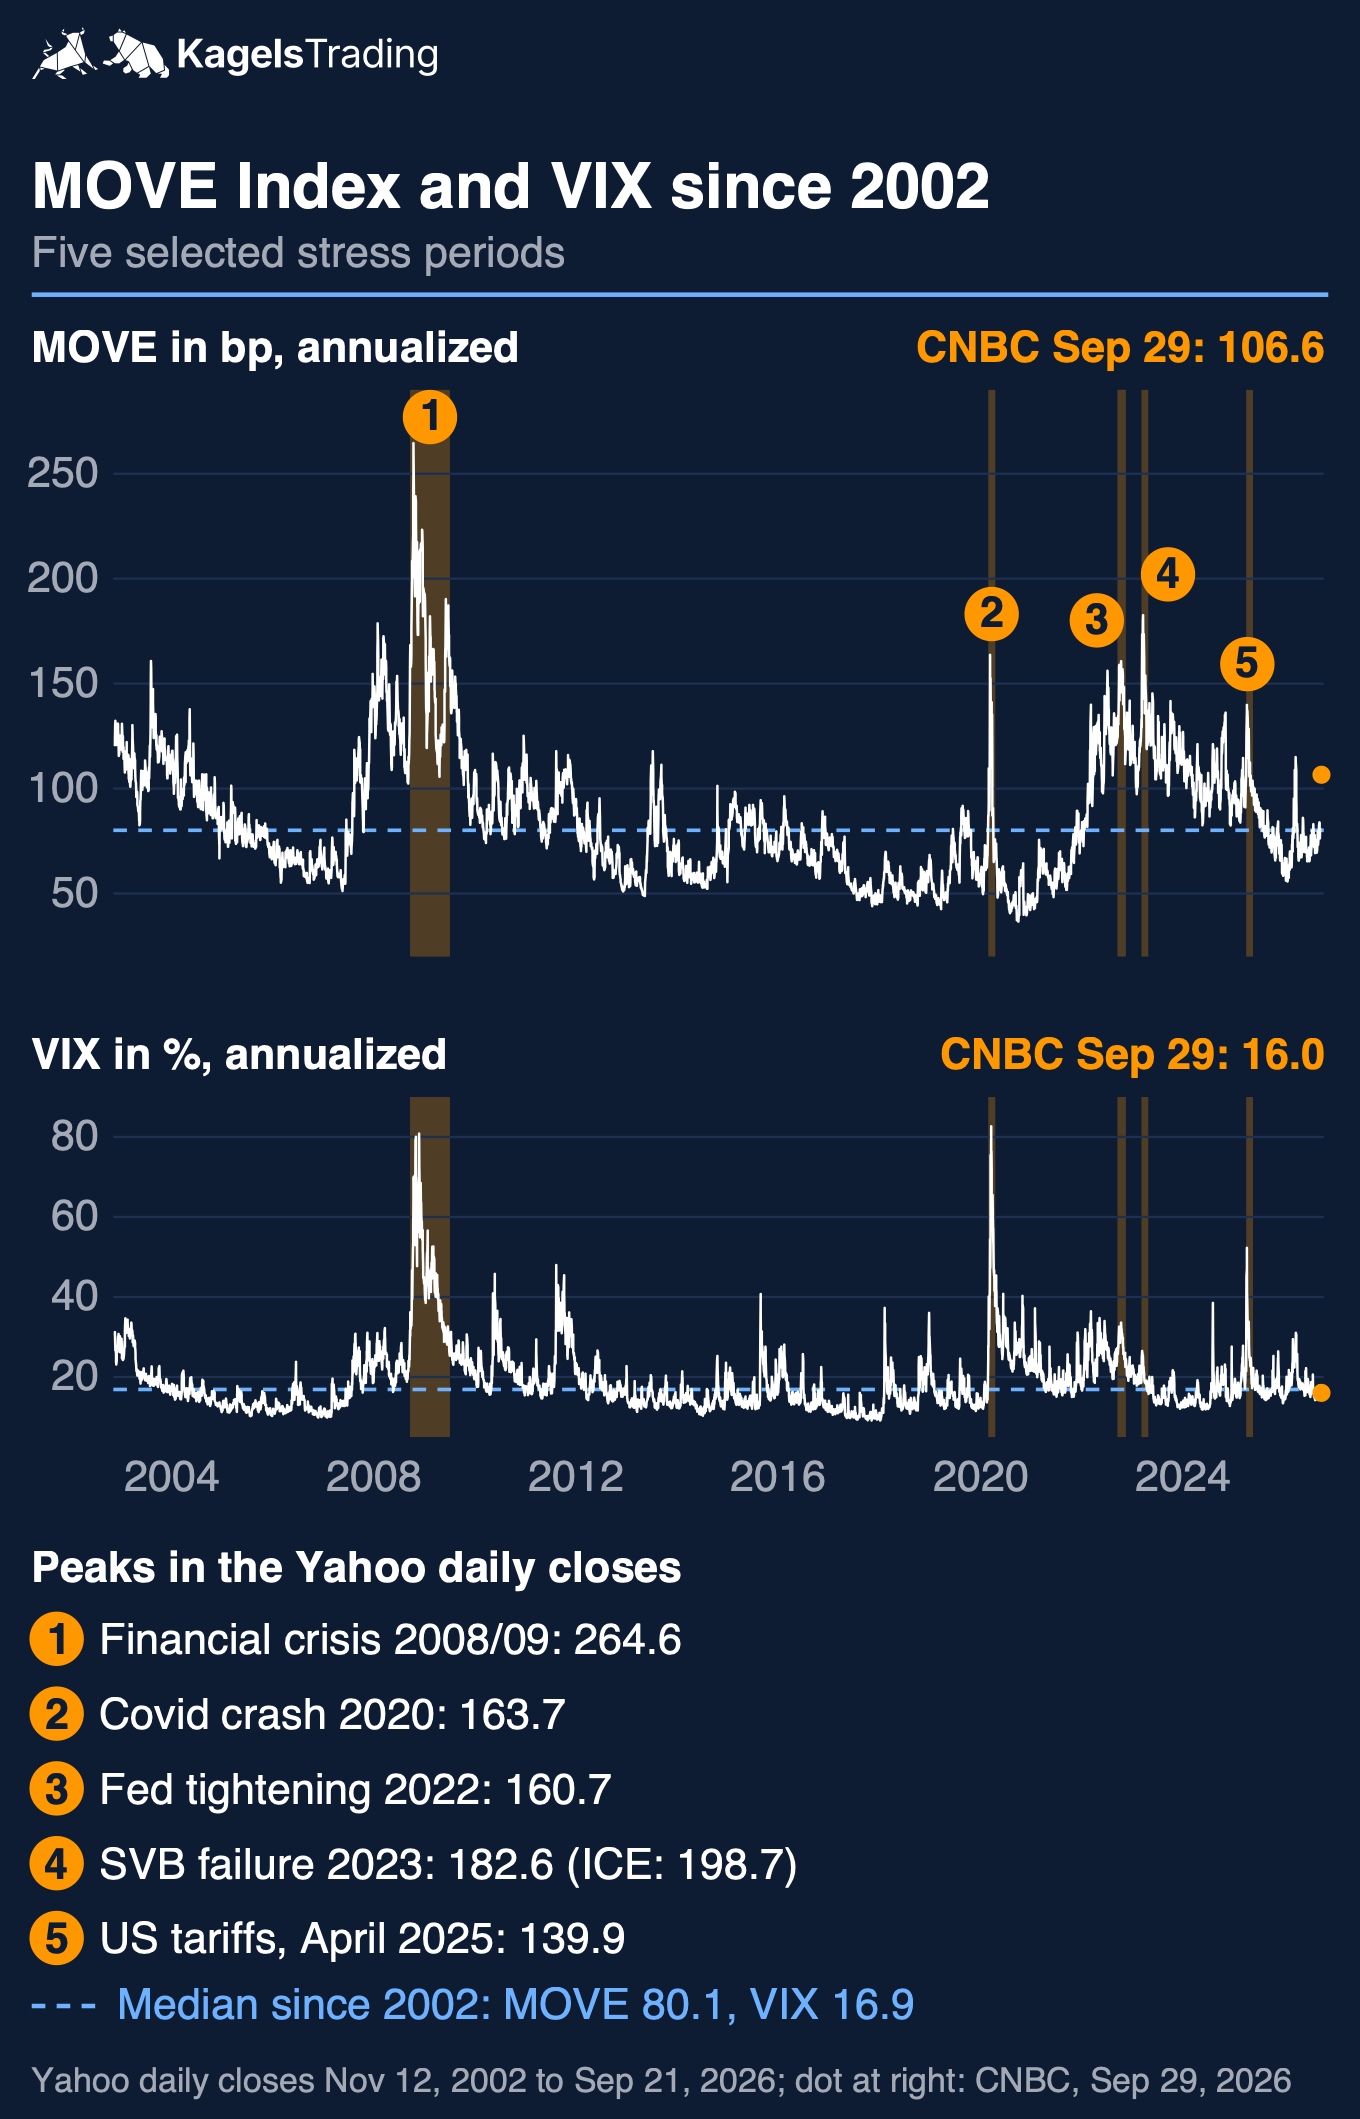 Click to enlarge
| Feature | MOVE index | VIX |
|---|---|---|
| Market | US rates | US stocks |
| Basis | Options on 2 to 30 years | Options on the S&P 500 |
| Unit | Basis points, annualized | Percent, annualized |
| Provider | ICE | Cboe |
| Median since 2002 | 80.1 | 16.9 |
Across the whole sample the levels of both indices are clearly related, the day-to-day changes much less so. In our analysis the daily levels had a correlation of 0.59. For changes between two consecutive trading sessions, measured in index points, it was only 0.28. For comparison: VIX changes and daily S&P 500 returns were far more closely linked at minus 0.80.
Many market watchers divide the MOVE by the VIX. Since 2002 the ratio had a median of 4.8; on September 29, 2026 it was about 6.6. A ratio above its own historical norm indicates relatively elevated rate volatility compared with equity volatility under this convention. It does not compare the risks of holding bonds and stocks directly.
How does the MOVE index affect the stock market?
The yield on 10-year US Treasuries feeds into how investors value stocks. When it swings a lot, the discount rate for future earnings changes, and expected earnings and risk premiums can shift as well. Rate volatility and liquidity in the bond market are also linked, as a New York Fed analysis shows. That is why stock traders watch the MOVE as well. Where the 10-year yield itself could head is the subject of our interest rate forecast.
We checked whether high MOVE readings were followed by stock-market declines. For every trading day since November 2002 we took the MOVE level and measured the S&P 500 price change, excluding dividends, over the following 21 trading sessions on the S&P 500 calendar. That gives 5,878 windows with start dates through August 20, 2026.
| MOVE range (count) | Median | Standard deviation |
|---|---|---|
| below 80 (2,914) | +1.31% | 3.53% |
| 80 to below 100 (1,231) | +1.30% | 4.28% |
| 100 to below 120 (938) | +1.82% | 4.51% |
| 120 and above (795) | +1.45% | 7.15% |
The table shows S&P 500 price changes over 21 trading sessions after each MOVE reading. Our analysis of the Yahoo series, with start dates from November 12, 2002 to August 20, 2026 and end dates through September 21, 2026.
In this historical sample, all four groups had positive median 21-session returns. Higher MOVE readings were associated with more dispersed subsequent returns. Returns were negative in 38.2 percent of cases after a MOVE of 120 and above, and in 31.6 percent after readings below 80. This descriptive comparison does not establish whether MOVE can predict stock-market direction.
The clear difference was in dispersion. From a MOVE of 120, the standard deviation of 21-session returns was 7.15 percent, about twice as high as below 80. The windows overlap, and periods like 2008 or 2020 weigh heavily in the top group. The results are conditional on the data, see the note on Yahoo Finance below.
What drives the MOVE index higher?
The MOVE rises when the market becomes less certain about future interest rates. That can happen above all when expectations for the Fed change quickly. When the US central bank decides and what it did last is covered in the Fed rate decision guide.
Inflation data play a role as well. Inflation surprises and changes in the expected Fed path can raise implied rate volatility, although a release can also reduce uncertainty. Which rate steps the market currently prices in is shown by the CME FedWatch Tool.
The highest readings in our series came in crises, not on normal data days. In 2008, 2020 and 2023 the issue was the stability of banks and whether markets kept working. Large yield moves in either direction may coincide with higher volatility.
The MOVE covers only the US market. For German Bunds there is no equally well-known index. Where the Bund could go is covered in our Bund future forecast. A volatile US rate market often spills over into Europe, though, because large investors shift money between markets worldwide.
Where can I see the MOVE index today?
You can find a MOVE index chart on TradingView under the symbol TVC:MOVE. There you can place it next to the VIX or the yield of the 10-year Treasury. On CNBC the symbol is .MOVE, and the page also shows the day’s high, low and the 52-week range.
On Yahoo Finance you need to be careful. The Yahoo file downloaded for this analysis ended on September 21, 2026 and contained a misleading instrument name for ^MOVE (“Northern Trust iBoxx 5-Year Tar”). Historical observations also differed from published provider figures, for example in March 2023. Treat the study as conditional on this dataset.
The MOVE is updated throughout the US trading day. For an overview the closing level is usually enough. More important than a single day’s reading is where it stands compared with the last few months and whether it is moving fast.
Strengths and limits of the MOVE index
The MOVE is a useful risk gauge for the rate market, but not a trading signal. The two lists sum up what it adds to the big picture and where its explanatory power ends.
What the MOVE index does well
- It sums up expected volatility across the whole US rate market in one number.
- It is based on option prices, so it shows expectations, not only past moves.
- In our data series it goes back to 2002 and makes crises comparable.
- Together with the VIX it shows whether rate volatility is unusually high relative to equity volatility.
Where the MOVE index reaches its limits
- It says nothing about whether rates will rise or fall.
- Our descriptive analysis does not show whether it predicts stock-market declines.
- It covers only the US market, not Bunds or other European rates.
- Public descriptions of its basis differ (swaps or Treasuries), and no dated methodology change is documented.
Conclusion: the MOVE shows expected volatility, not direction
The MOVE index is the counterpart of the VIX for the US rate market. It measures in annualized basis points how much yields are expected to swing over the next month, and the 10-year maturity counts double.
Readings around 70 to 80 are normal; above 120 the market is restless. The peaks came in the financial crisis, the Covid crash, the Fed tightening of 2022 and the 2023 bank failures. On September 29, 2026 the MOVE stood at about 106, above its median.
For stock traders the MOVE is above all a hint at how widely returns may spread. In our analysis the standard deviation of 21-session S&P 500 returns after high readings was about twice as high; that does not establish a directional forecast. The MOVE describes dispersion, not the direction of the next move; for current support and resistance in the US benchmark itself, see our S&P 500 forecast.
Frequently asked questions about the MOVE index
What does the MOVE index measure?
The MOVE index measures how much US interest rates are expected to swing over the next month. It is calculated from options on maturities of 2, 5, 10 and 30 years and quoted in annualized basis points.
What is a high MOVE index reading?
The median of our data series since November 2002 is 80.1. Readings above 120 occurred mainly in crises or during fast turns in rates; the highest reading in the series is 264.6 in October 2008.
What is the difference between the MOVE index and the VIX?
The VIX measures expected swings in the US stock market in percent, the MOVE those in the US rate market in basis points, both annualized. Both are based on option prices. Since 2002 the ratio of MOVE to VIX had a median of 4.8.
Who calculates the MOVE index?
The index is calculated by ICE, the operator of the Intercontinental Exchange. It was developed by Harley Bassman at Merrill Lynch; ICE took it over from Bank of America Merrill Lynch in 2019.
Where can I see the MOVE index today?
On TradingView under TVC:MOVE and on CNBC under .MOVE. On Yahoo Finance the symbol is ^MOVE, but the historical series we downloaded differed from published provider figures.
Does a high MOVE index predict falling stock prices?
Our descriptive analysis since 2002 does not establish that. After a MOVE of 120 and above, the S&P 500 fell over the following 21 trading sessions in 38.2 percent of cases, after readings below 80 in 31.6 percent. The standard deviation of returns, however, was about twice as high.
This article is translated from the German edition on kagels-trading.de.
More Markets and Brokers guides
- Choose a broker
Interactive Brokers Review 2026: Fees and Platforms
Fees, platforms, investor protection and real futures commissions from a client since 1996.
- Understand your price
Market Makers: Who Sets Your Price and How They Profit
How market makers earn on the spread, who sets prices at German trading venues and what the EU ban on payment for order flow changed.
- Research stocks
InvestingPro Review: Screener, ProPicks AI and WarrenAI
What the InvestingPro screener, ProPicks AI and WarrenAI do, what Pro and Pro+ cost and who needs which plan.
- Follow an IPO
Anthropic Stock: IPO Date, Valuation and How to Invest
Where the Anthropic IPO stands, how the valuation compares with revenue and how to get exposure before and after the listing.
- Invest in OpenAI before the IPO
OpenAI Stock: Can You Buy It, and Who Owns OpenAI?
Why there is no OpenAI stock yet, who owns OpenAI, where the IPO stands and how much OpenAI you get through Microsoft or SoftBank.
- Value a new listing
SpaceX Stock (SPCX): Valuation, Risks and How to Buy
How to buy SpaceX stock, what the company is worth after the IPO and which risks the lock-up calendar brings.