
Value Investing: Intrinsic Value, Margin of Safety, Traps


Contents
- Value investing in 30 seconds
- What is value investing?
- Price and value: what you see and what you estimate
- The three pillars of value investing
- A worked valuation: how sensitive intrinsic value is
- Real example: Coca-Cola’s price against four estimates
- Graham and Buffett: two schools of value
- The value investor’s toolbox: key ratios
- From screen to purchase: three steps
- Value traps: when cheap stays cheap
- Value against growth: the value premium
- When to sell a value stock
- Advantages and disadvantages of value investing
- Conclusion: a method for thinking about price
- Frequently asked questions about value investing
- About the author
Value investing means buying a share for less than the business behind it is worth. That sounds simple, and the idea is. The hard part is that you can see the price on any screen, while the value is an estimate that depends on a handful of assumptions. Change them a little, and the value changes a lot.
This guide shows how value investors estimate that value, and how fragile the estimate is. You get a worked discounted cash flow model with a sensitivity table, a real example with Coca-Cola’s 2025 figures and its price on November 6, 2026, the history of the value premium since 1926, and a checklist against value traps. This article follows our editorial policy.
Value investing in 30 seconds
- The idea: buy shares that trade below an estimate of the company’s intrinsic value, and wait until the market closes the gap.
- Price and value are different things: the price is a fact; the value is an estimate built on cash flow, growth and the return you require.
- Margin of safety: because the estimate can be wrong, value investors buy only well below it. The term is Graham’s; many investors want 30 to 50%.
- Sensitivity: in our worked example, one point more or less in the required return moves the value by about 12 to 16%.
- Value traps: a low price can be right when the business is shrinking; cheap ratios alone are not a reason to buy.
- Patience: US value stocks trailed growth stocks for most of 2007 to 2020; the value premium comes with long dry spells.
What is value investing?
Value investing is an investment approach in which you buy stocks that trade below your estimate of the company’s intrinsic value, with a margin of safety for errors.
The method goes back to Benjamin Graham. Graham taught at Columbia Business School and laid out the approach in Security Analysis (1934, with David Dodd) and The Intelligent Investor (1949). His central rule was to treat a share as a piece of a business, not as a ticket in a price game.
Warren Buffett, Graham’s best-known student, moved the method towards quality. In his 1989 letter to shareholders he wrote that it is far better to buy a wonderful company at a fair price than a fair company at a wonderful price. How Buffett applies this today, and what Berkshire holds, is in our guide to Warren Buffett.
Price and value: what you see and what you estimate
The price is an observation; the value is an opinion. In his 2008 letter Buffett quotes Graham: “Price is what you pay; value is what you get.” The price of a share is printed every second. Its intrinsic value is never printed anywhere, because it depends on cash flows that have not happened yet.
Keep the two apart in your own notes. Write down the price with its date and source, and write down the value as a range together with the assumptions behind it. When someone tells you a stock is “worth” a certain amount, ask which cash flow, which growth rate and which required return produced that number.
The three pillars of value investing
Value investing rests on three ideas, and all three go back to Graham. They are intrinsic value as the yardstick, the margin of safety as protection against your own errors, and Mr. Market as the moody partner who quotes prices every day.
Intrinsic value
Intrinsic value is the present value of the cash a business will hand to its owners over its life. The standard tool is a discounted cash flow model (DCF). It projects future cash flows and discounts them to today at the return you require for the risk. Other approaches use book value, earnings power or the prices of comparable companies, but they all try to answer the same question.
Margin of safety
The margin of safety is the discount to your value estimate at which you are willing to buy. If you estimate a value of $100 and require a 30% margin, you buy at $70 or below. The margin protects you against optimistic assumptions, bad luck and simple errors in the model, which the next section shows are easy to make.
Mr. Market
Mr. Market is Graham’s picture of the stock market as a partner with changing moods. Every day he offers to buy your share or sell you his, at a price that swings with his mood. You do not have to accept his offer; you only use it when it is clearly below your estimate. In his 1986 letter, Buffett put the same idea as trying “to be fearful when others are greedy and to be greedy only when others are fearful”. Gauges such as the Fear and Greed Index try to measure that mood.
A worked valuation: how sensitive intrinsic value is
The best way to understand intrinsic value is to calculate one and then change the inputs. The example below is a hypothetical company, so every number is visible. It uses a two-stage DCF: ten years of faster growth, then slow growth forever.
| Input | Value |
|---|---|
| Free cash flow per share today | $10.00 |
| Growth in years 1 to 10 | 5% a year |
| Growth after year 10 (terminal growth) | 2.5% a year |
| Required return (discount rate) | 10% a year |
With these inputs, the value comes to $163.95 per share. The cash flows of the first ten years, discounted to today, are worth $78.12. Everything after year 10 (the terminal value) adds $85.83, or 52% of the total. More than half of the value rests on years you cannot see at all.
A small change in the required return moves the value more than a change in growth. The table shows the value per share for other combinations: rows are the required return, columns the growth in years 1 to 10, and the base case is in bold. One point less in the required return (9% instead of 10%) raises the value by about 16%; one point more lowers it by about 12%.
| Return | 2% | 3.5% | 5% | 6.5% | 8% |
|---|---|---|---|---|---|
| 8% | $179 | $201 | $227 | $255 | $286 |
| 9% | $152 | $170 | $190 | $213 | $239 |
| 10% | $132 | $147 | $164 | $183 | $204 |
| 11% | $116 | $129 | $144 | $160 | $178 |
| 12% | $104 | $115 | $128 | $142 | $157 |
The terminal growth rate matters too. At 1.5% instead of 2.5% after year 10, the base value falls to $153; at 3.5% it rises to $178. Because the terminal value carries half the result, a one-point change far in the future moves today’s value by about 7 to 9%.
This is why a margin of safety is not optional. Suppose you buy at $115, a 30% discount to the base value of $164. If the true required return is 12% and growth only 3.5%, the value is $115 and your margin is gone, without any change in the business. The margin buys room for being wrong, not a guaranteed profit.
Real example: Coca-Cola’s price against four estimates
 Click to enlarge
Source: Coca-Cola 10-K for 2025 (SEC), calculation by Kagels Trading.
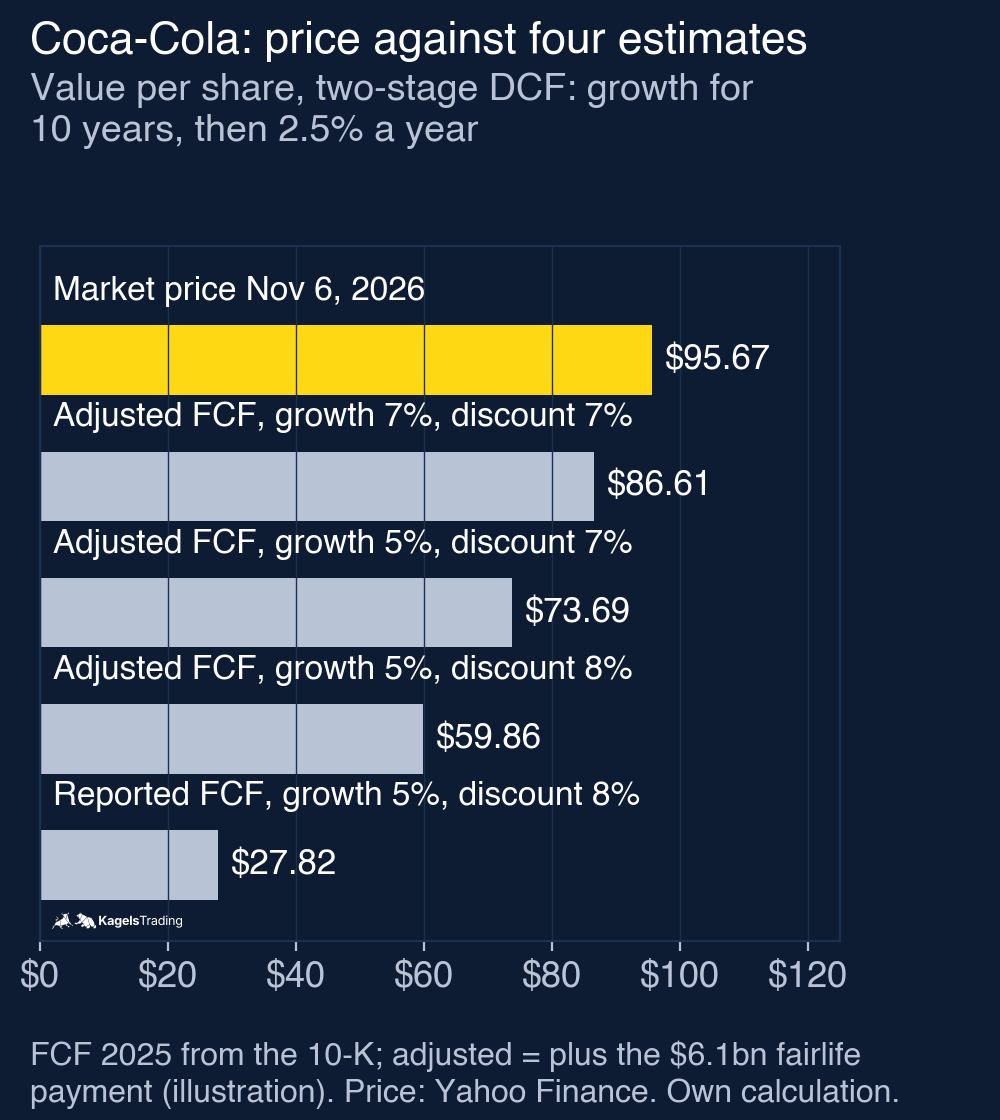
A real company shows the second problem: you first have to decide which cash flow to start from. Coca-Cola’s 10-K for 2025 reports operating cash flow of $7.41 billion and capital spending of $2.11 billion, so reported free cash flow was $5.30 billion. But 2025 included $6.1 billion of the $6.2 billion final milestone payment for fairlife in operating cash flow, a one-time item. Adding it back gives about $11.40 billion, or $2.64 per diluted share. This is an illustrative adjustment, not a full normalization: future acquisitions, financing and changes in the share count are not modelled, and it does not show that this amount is sustainable.
The two starting points give very different values. With 5% growth for ten years, 2.5% after that and an 8% required return, the adjusted cash flow gives $59.86 per share and the reported one only $27.82. On November 6, 2026 the share closed at $95.67. Even at a 7% required return and 7% growth for ten years, the estimate stays below the price at $86.61.
You can also turn the question around and ask what the price implies. At $95.67, with the adjusted cash flow, 5% growth for ten years and 2.5% after, the model implies a discount rate of about 6.0%. That is not a return anyone has earned or will earn: actual shareholder returns can be very different if growth, margins or the share price develop otherwise. For comparison, the US Treasury put the 10-year par yield at 4.86% on the same day (daily yield curve). Whether such a gap is enough for the risks of a stock depends on your assumptions; the model does not decide it.
This example is a method, not a recommendation. The share trades at about 31 times its 2025 earnings per share ($3.04, from $13.1 billion of net income), far above Graham’s limits. Buffett’s quality school would argue that a strong brand deserves a lower required return; the stock fails the historical Graham screen described below. Both use the same facts and reach different conclusions.
Graham and Buffett: two schools of value
Graham bought what was statistically cheap; Buffett bought quality at a sensible price. Graham’s rules for the defensive investor in the revised edition of The Intelligent Investor (1973, chapter 14) include earnings in each of the past ten years, dividends without interruption for at least 20 years, a price of no more than 15 times average earnings of the past three years, and no more than 1.5 times book value. He allowed a higher multiple of one if the other was lower, as long as the product of the two stayed below 22.5.
Buffett called Graham’s bargain hunting the “cigar butt” approach. In his 1989 letter he describes buying a poor business cheaply enough for one last puff of profit, and why he moved away from it. His shift went towards companies with a durable competitive advantage, which he calls a moat, run by capable managers, even if they cost more.
Both schools share the core idea and differ in where they look. A Graham investor screens for low price to book and price to earnings and spreads the money over many names. A Buffett investor holds fewer companies, studies each one deeply and accepts a higher multiple for quality. The opposite school, buying stocks that already make new highs, is described in our guide to CAN SLIM.
The value investor’s toolbox: key ratios
Ratios do not tell you the value, but they tell you where to look. No single ratio is enough; compare them within one industry and over the company’s own history. The thresholds below are rough screening values, not rules.
| Ratio | Formula | Rough value screen | Watch out for |
|---|---|---|---|
| Price to earnings (P/E) | Price ÷ earnings per share | below 15 | one-time items, peak earnings in cyclicals |
| Price to book (P/B) | Price ÷ book value per share | below 1.5 | little meaning for software and brands |
| Price to sales (P/S) | Market value ÷ revenue | below 1.5 | says nothing about margins |
| Free cash flow yield | Free cash flow ÷ market value | above 5% | one-time payments, as in the Coca-Cola case |
| Dividend yield | Dividend per share ÷ price | above 3% | very high yields often precede a dividend cut |
| PEG ratio | P/E ÷ expected growth rate | below 1 | depends entirely on a growth forecast |
A low ratio is a question, not an answer. A P/E of 5 can mean the market overlooks a company, or that earnings are about to fall. Before you buy, find out why the stock is cheap. Screeners such as Finviz or InvestingPro filter by these ratios; our stock screener comparison shows which tool fits which task.
From screen to purchase: three steps
Finding value stocks is a funnel from thousands of companies to a few. A screener narrows the list, a qualitative check removes weak businesses, and only then do you estimate a value range and set your buy price.
- ScreenerScreenFilter by P/E, P/B, free cash flow yield and debt. Thousands of stocks shrink to a short list.
- YouBusiness checkDo you understand how the company earns money? Is there a moat? Is the industry shrinking?
- YouValue rangeEstimate intrinsic value with conservative inputs and a sensitivity table, not a single number.
- YouBuy priceSet the price that leaves your margin of safety, then wait. No margin, no purchase.
The dark line marks where the screener's part ends. Everything after it is your own judgement.
Stay inside your circle of competence. Buffett uses the phrase for the businesses an investor really understands. If you cannot explain how a company earns money and what could stop it, your value estimate is a guess with decimal places.
Value traps: when cheap stays cheap
A value trap is a stock that looks cheap on its ratios but stays cheap or gets cheaper, because the business keeps shrinking. The low price was not a mistake by the market but an accurate forecast. The ratios look attractive only because they use past earnings that will not come back.
The classic example is Eastman Kodak. For years its shares fell while digital photography eroded its film business. On January 19, 2012, Kodak filed for Chapter 11 bankruptcy protection, according to its announcement filed with the SEC. Anyone who bought on the way down because the stock looked cheap owned a business whose value was falling faster than its price.
These questions help you tell a temporary problem from a permanent one. None of them is a formula; together they show whether the earnings behind a low ratio will last.
- Is revenue falling for structural reasons? A shrinking market (film, print advertising, video rental) is worse than a weak year.
- Are margins stable? Rising costs that the company cannot pass on point to a lost pricing power.
- Is the debt manageable? A cheap stock with heavy debt can lose everything in one refinancing.
- Is the dividend covered by free cash flow? A yield far above the market often prices in a dividend cut.
- Is management buying back stock or selling assets to hide decline? Buybacks can shrink the share count while the business shrinks too.
Value against growth: the value premium
 Click to enlarge
Source: Data from the Kenneth R. French Data Library, chart by Kagels Trading.
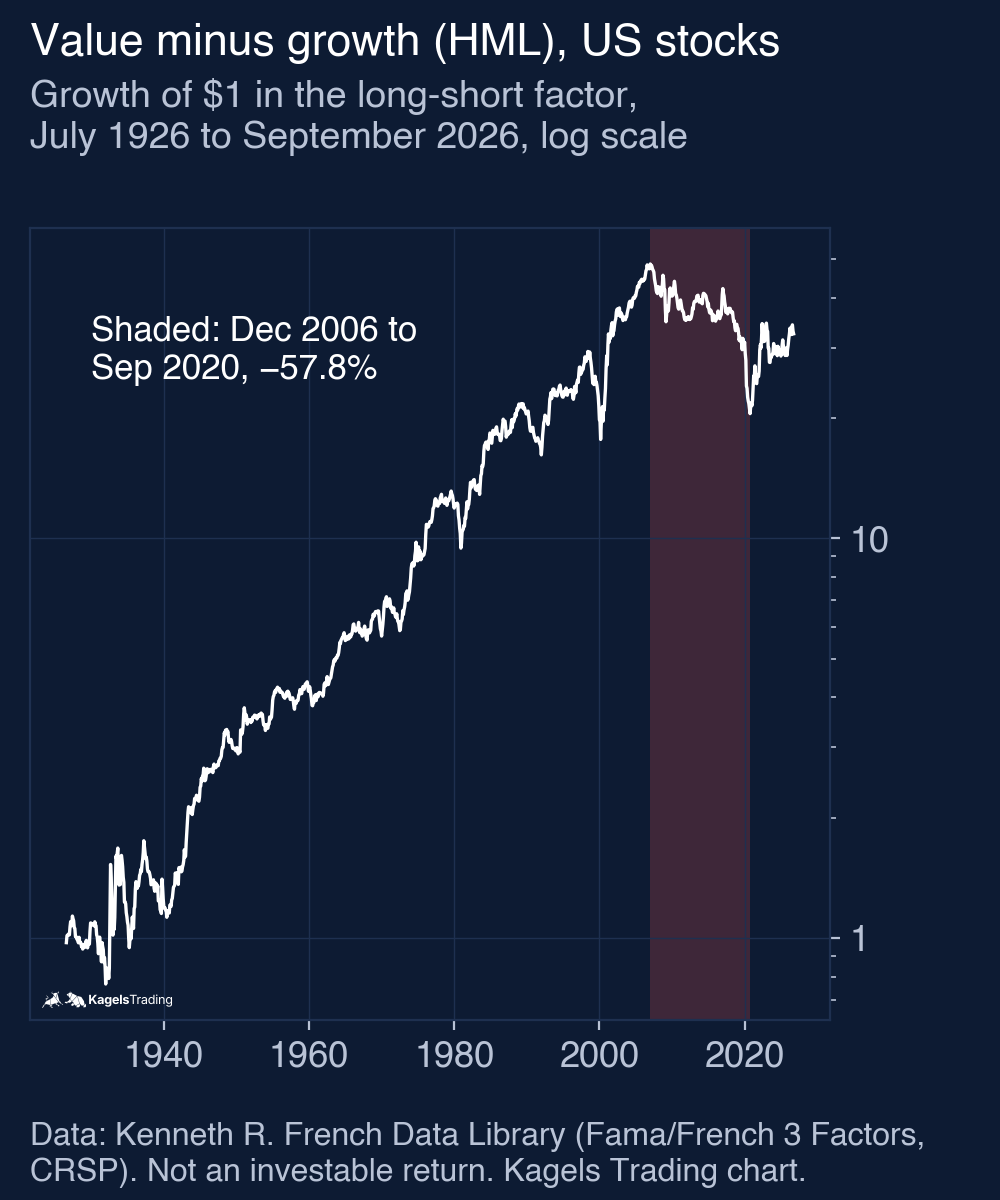
Over a century, value stocks beat growth stocks in the US, but not steadily. The most common measure is HML (“high minus low”), a research portfolio by Eugene Fama and Kenneth French that buys stocks with a high book-to-market ratio and sells those with a low one. From 1927 to 2025 it gained 4.4% a year on average (3.5% compounded). All figures here compound the monthly returns, the same series as the chart. This is before costs, and it is not a return you can buy.
Then came the longest dry spell on record. From its peak in December 2006 to September 2020, HML lost 57.8%. In 10 of the 14 calendar years from 2007 to 2020, growth stocks beat value stocks. Over 2007 to 2025 as a whole, the factor still lost 2.4% a year compounded, despite good years from 2021.
History shows both sides. From 1927 to 2006 the premium averaged 5.7% a year, and only 13 of 90 rolling ten-year periods ending 1936 to 2025 were negative. In 2026 the factor gained 6.7% from January to September. Anyone who chooses value needs the patience to trail the market for a decade, without knowing in advance whether the premium returns.
| Period | HML average a year | HML compounded a year | Years with value ahead |
|---|---|---|---|
| 1927 to 2025 | 4.4% | 3.5% | 57 of 99 |
| 1927 to 2006 | 5.7% | 5.0% | 50 of 80 |
| 2007 to 2020 | −5.0% | −5.7% | 4 of 14 |
| 2021 to 2025 | 8.5% | 7.3% | 3 of 5 |
Value stocks also cluster in a few sectors. Banks, energy and industrials often look cheap at the same time, and they fall together in a recession. A value portfolio of ten cheap stocks can turn out to be one bet on the economic cycle. Our guide to oil stocks shows how much one sector’s shares depend on a single price.
When to sell a value stock
Value investors talk a lot about buying and little about selling, so set your rules before you buy. Three exit rules cover most cases; write them into your notes on the day of purchase.
- The price reaches your value range: the margin of safety is used up, and the risk-reward no longer favors you.
- The thesis breaks: if the reason you bought (a temporary problem, a hidden asset) turns out to be wrong, sell instead of hoping; a small loss beats a large one.
- Time runs out: if the gap has not closed after three to five years, check again whether you have caught a value trap.
Selling is harder than buying, because you are attached to your own analysis. Writing the sell rules down at the time of purchase, together with your value range and its assumptions, makes it easier to act when one of them breaks. The same discipline helps with position size: no single idea should be able to ruin the portfolio.
Advantages and disadvantages of value investing
Value investing trades patience and work for a lower purchase price. These are its strengths and its costs.
Advantages
- A built-in buffer: the margin of safety absorbs part of the errors in your estimate.
- Clear thinking about price: you separate what you pay from what you get and write down your assumptions.
- Crises become opportunities: when investors sell indiscriminately, solid companies can fall below a conservative value.
- It forces you to understand the business: you buy only what you can explain, which removes many impulse purchases.
Disadvantages
- Long dry spells: US value stocks trailed growth for most of 2007 to 2020.
- Value traps: a cheap stock and a dying business look alike in the ratios at first.
- Sensitive estimates: one point in the required return moves the value by 12 to 16% in our example.
- Sector clusters: cheap stocks often share the same cycle.
- Work, not a button: reading reports and building a value range takes time for every single company.
Conclusion: a method for thinking about price
Value investing is less a stock list than a discipline. It asks you to separate the observable price from an estimated value, to write the estimate down as a range with its assumptions, and to buy only with a margin of safety.
The worked example shows why that margin matters. Half of the value came from years after the forecast, and one point in the required return changed the result by up to 16%. The Coca-Cola case adds that even the starting cash flow needs a judgement before any formula runs.
The value premium is real in the long history, but it is not a promise. In the HML factor, value beat growth by about 4% a year on average from 1927 to 2025, and then lost for most of 14 years. If you choose this method, choose it for its logic and with the patience it demands.
This article explains a method; it is not investment advice. Past returns of value or growth stocks do not show future results.
Frequently asked questions about value investing
What is intrinsic value?
Intrinsic value is an estimate of what a business is worth to its owners, usually the present value of its future cash flows. Unlike the share price, it is never observed; it depends on your assumptions for cash flow, growth and the required return.
How do I calculate the margin of safety?
Divide the gap between your value estimate and the price by the value estimate. With a value of $100 and a price of $70, the margin of safety is 30%. Many value investors want 30 to 50%, because the estimate itself can easily be wrong by that much.
Can I invest in value with ETFs?
Yes, value index funds buy the cheaper part of a stock index by rules. In the US, common benchmarks are the Russell 1000 Value Index, tracked by the iShares Russell 1000 Value ETF, and the Morningstar US Large Cap Value Index, tracked by the Vanguard Value ETF (both fact sheets as of September 30, 2026). These funds only hold the cheaper stocks and do not short growth stocks, so they do not reproduce the long-short HML series, though they share its long periods of underperformance.
What is a value trap?
A value trap is a stock that looks cheap on its ratios but keeps getting cheaper, because the business is shrinking. The low price reflects falling future earnings. Check revenue trends, margins, debt and whether the dividend is covered before you trust a low P/E.
Is Coca-Cola a value stock?
Not by Graham’s numbers. On November 6, 2026 it traded at about 31 times its 2025 earnings, and our DCF estimates stayed below the price of $95.67. Buffett-style investors still value its brand and pricing power, which shows how much the answer depends on the school you follow.
Which books should I read about value investing?
Start with Benjamin Graham’s The Intelligent Investor, then Buffett’s letters. Berkshire Hathaway publishes all shareholder letters since 1977 free on its website. Security Analysis is the deeper and harder textbook. More titles are in our list of trading books.
Does value investing work in a crisis?
Crises create the low prices value investors wait for, but they also create value traps. In 2008, 2020 and 2022, many solid companies fell far below conservative estimates. You need cash available at that moment and the discipline to check whether a business has changed for good, not just its price.
This US edition is based on our German edition on kagels-trading.de and has been adapted for US readers.
More Markets and Brokers guides
- Open your first account
What Is a Brokerage Account? A US Beginner's Guide
How to open and fund a US brokerage account, cash vs margin, what it costs and what SIPC and FDIC really cover.
- Choose a broker
Interactive Brokers Review 2026: Fees and Platforms
Fees, platforms, investor protection and real futures commissions from a client since 1996.
- Check an offshore broker
PU Prime Review 2026: FCA Warning, Licences and Costs
Which PU Prime company you contract with, what the FCA warning means, and what 1:1000 leverage and the deposit bonus do to your account.
- Understand your price
Market Makers: Who Sets Your Price and How They Profit
How market makers earn on the spread, who sets prices at German trading venues and what the EU ban on payment for order flow changed.
- Read bond market stress
MOVE Index: The VIX of the Bond Market, Explained
What the MOVE index measures, which readings signal stress, how it differs from the VIX and where its limits are.
- Read market sentiment
Fear and Greed Index: How It Works, Tested Since 2021
How CNN builds its Fear and Greed Index from seven measures, what the zones mean and how the S&P 500 moved after readings below 20.
- Size an index future
Micro Futures: MES vs MNQ, Tick Values and Risk
MES and MNQ tick values, a worked sizing example from the stop with costs and slippage, and why margin is not your risk.
- Read the futures curve
Contango vs Backwardation: Futures Curves Explained
What contango and backwardation mean, what rolling does to a position in each case, and real gold, oil and gas curves from 28 October 2026.
- Choose a silver future
Silver Futures: SI vs Micro Silver vs 100-oz SIC
SI, Micro Silver and the 100-ounce SIC compared by tick value, risk per contract, margin and December 2026 deadlines.
- Read the chip sector
SOX Index: Holdings, Weighting and How to Use It
What the SOX holds, how Nasdaq caps the weights, its largest declines since 2004 against the Nasdaq-100 and which ETFs really track it.
- Read the biotech sector
Nasdaq Biotechnology Index: Holdings, Weighting and Risks
What the NBI holds, how Nasdaq caps the weights, its long declines since 2003 against the Nasdaq-100 and which ETFs really track it.
- Read the transport sector
Dow Jones Transportation Average: Stocks and Dow Theory
The 20 stocks in the Dow transport index, why the share price sets their weight, declines since 1992 and what Dow Theory can and cannot tell you.
- Research stocks
InvestingPro Review: Screener, ProPicks AI and WarrenAI
What the InvestingPro screener, ProPicks AI and WarrenAI do, what Pro and Pro+ cost and who needs which plan.
- Use the free news portal
Investing.com Review: Free Tools, Data and Limitations
What the free Investing.com portal does well, where the quote prices come from and when InvestingPro is worth paying for.
- Find real AI revenue
AI Stocks 2026: How Listed Companies Earn From AI
Which listed companies earn from AI in cloud, software, infrastructure and chips, disclosed AI revenue against hope, plus AI ETFs and risks.
- Follow an IPO
Anthropic Stock: IPO Date, Valuation and How to Invest
Where the Anthropic IPO stands, how the valuation compares with revenue and how to get exposure before and after the listing.
- Invest in OpenAI before the IPO
OpenAI Stock: Can You Buy It, and Who Owns OpenAI?
Why there is no OpenAI stock yet, who owns OpenAI, where the IPO stands and how much OpenAI you get through Microsoft or SoftBank.
- Understand a stock split
Stock Splits Explained: Forward and Reverse Splits
What forward and reverse splits change and what they do not, the dates that matter, what happens to options and the $1 listing rule.
- Value a new listing
SpaceX Stock (SPCX): Valuation, Risks and How to Buy
How to buy SpaceX stock, what the company is worth after the IPO and which risks the lock-up calendar brings.