
Trading Costs: Every Fee You Pay and How to Cut It


Contents
- Trading costs in 30 seconds
- What trading costs are there?
- Slippage: the cost on no statement
- Market data and software: the costs next to the broker
- Holding costs: what a position costs overnight
- Taxes: the largest single item on every gain
- Which costs hit which product
- What trading costs add up to in a year
- Where can I trade most cheaply?
- How to cut your trading costs
- Conclusion: trading costs are the part of the result you can plan
- Frequently asked questions about trading costs
- Sources
- About the author
A winning trade is not yet money in your account. Between your entry and your account statement sit the spread, the commission, regulatory fees, possibly margin interest and, at the end, the tax. On small positions these items together can eat more than the price move gave you. If you make 20 trades a month, you pay them 20 times, whether you close in profit or at a loss.
This guide goes through each trading cost one by one. For each you see what it is, where it arises, what it costs at US brokers today and where you can push it down. All fees come from the brokers’ own fee schedules, all regulatory fees from the SEC and FINRA, all tax rules from the IRS, checked on 12 November 2026. The article follows our editorial policy and is education, not investment or tax advice.
Trading costs in 30 seconds
- Six cost blocks decide your result: spread, commission, regulatory fees, holding costs, market data and tax. Only a few of them appear in a broker’s advertising.
- $0 commission is not free: online US stock and ETF trades cost $0 at Schwab, Fidelity and Robinhood, but you still pay the spread, and sales carry the SEC fee.
- Options and futures are priced per contract: Schwab and Fidelity charge $0.65 per option contract, Interactive Brokers $0.85 per E-mini and $0.25 per Micro E-mini futures contract.
- Real-time data is the underrated item: at Interactive Brokers, Nasdaq TotalView costs $16.50 a month for a non-professional and $90.00 for a professional.
- Tax depends on the holding period: short-term gains are taxed as ordinary income, long-term gains at 0, 15 or 20 percent, plus 3.8 percent for higher earners.
- My rule of thumb is one percent: if entry and exit together cost more than one percent of the position, the position is too small for that broker or market.
What trading costs are there?
Trading costs are all the amounts taken off between placing your order and the money arriving in your account. They are the spread, the commission, regulatory fees, holding costs, market data fees and the tax on your gain.
These items behave very differently. Some hit every single trade, others once a month, others once a year. This is exactly what decides which broker suits your trading style. A day trader with 200 trades a month and a position trader with four trades a year pay completely different sums at the same broker.
Two cost types are regularly overlooked. The first is the regulatory fee on every sale, which brokers pass on to you in the small print. The second is market data for real-time quotes. Neither appears in advertising, but both stand in every fee schedule.
The overview shows all six at a glance, sorted by how often they hit you. That frequency, not the size of the single amount, decides what is left of your result at the end of the year. It is the same order this guide follows.
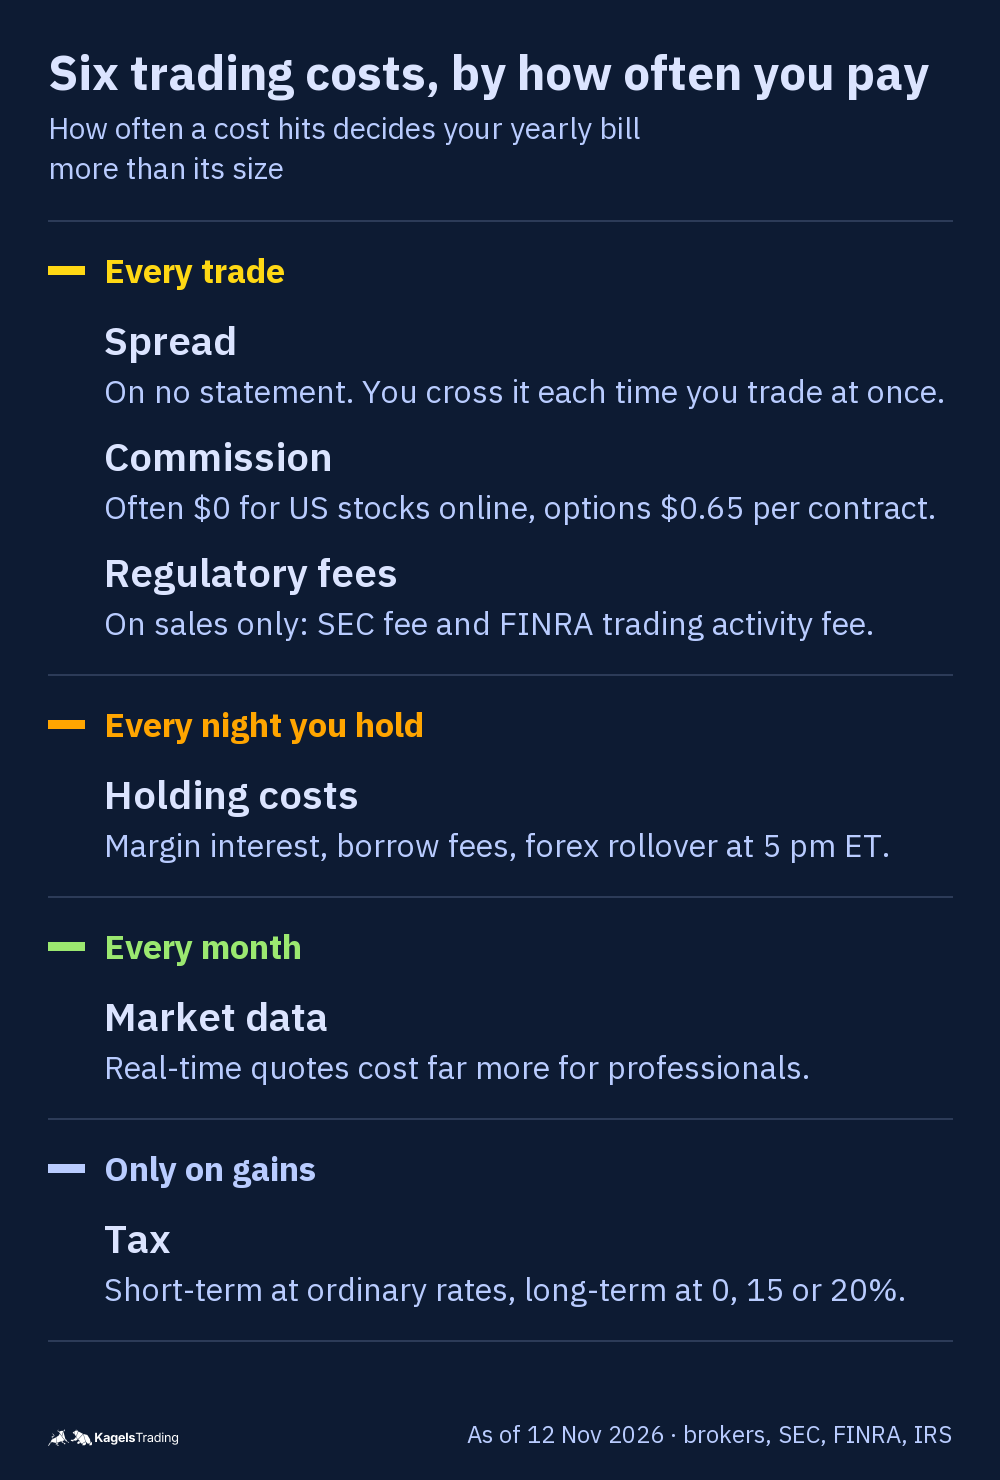 Click to enlarge
Source: Kagels Trading, own learning graphic.
The spread: the fee no broker calls a fee
The spread is the difference between the bid, the price at which you can sell right now, and the ask, the price at which you can buy right now. It is never billed as a fee. You pay it because a position bought with a market order starts slightly in the red. Our guide to the bid-ask spread shows how to calculate it in dollars, percent and pips.
That makes the spread the most invisible of all trading costs. A broker can advertise $0 commission and still cost you more than a broker that charges a commission, if your orders fill at worse prices. For large-cap US stocks in regular hours, a one-cent spread is normal. For small caps, options and trading outside regular hours it can be many times wider.
Spreads are either fixed or variable. Variable spreads widen exactly when you can least afford it: at news releases, at the open and in fast markets. A fixed spread, which some forex brokers offer under their own conditions, costs more in a quiet market and less in a busy one.
Commissions: what $0 really means
The commission is the amount your broker charges for executing an order. You pay it twice per position, on the buy and on the sell. If you build and close a position in ten pieces, you pay it twenty times.
There are two models. A flat commission costs the same amount whatever the size, and for online US stocks and ETFs that amount is now often $0. A per-share commission charges a small amount for each share, usually with a minimum and a maximum per order. Options are priced per contract almost everywhere.
| Broker | Online US stocks and ETFs | Options |
|---|---|---|
| Charles Schwab | $0 | $0.65 per contract |
| Fidelity | $0 | $0.65 per contract |
| Robinhood | $0 | $0 commission, regulatory fees per contract |
| Interactive Brokers Pro Fixed | $0.005 a share, $1.00 minimum, at most 1% of trade value | $0.65 per contract at a premium of $0.10 or more |
| Interactive Brokers Lite | $0 | $0.65 per contract |
Prices from each broker’s own pricing page, checked on 12 November 2026. These are examples, not a ranking, and we earn no commission from these links. Conditions and exceptions apply, for example for broker-assisted trades.
The table shows why a cost comparison so often goes wrong. The number in the middle column is not the whole bill. The spread, the way your order is routed and the regulatory fees come on top at every broker, including the ones that charge $0. I have been a client of Interactive Brokers since 1996, so read that row with this in mind; our Interactive Brokers review covers its prices in detail.
Regulatory fees on every sale
Two small fees are charged on every sale of US stocks, and your broker passes them on to you. They replace what other countries call an exchange fee. You pay them on sell orders only, including short sales, and at a $0 broker as well.
- SEC fee (Section 31): since 4 April 2026 the rate is $20.60 per million dollars of sales. On a $10,000 sale that is about 21 cents.
- FINRA trading activity fee (TAF): normally $0.000195 per share sold, at most $9.79 per trade, and $0.00329 per option contract sold. FINRA has paused it from 1 October to 31 December 2026; it applies again from 1 January 2027.
For one trade these fees are tiny, for an active trader they add up. Selling 200 shares worth $10,000 costs about 21 cents in SEC fee and about 4 cents in TAF. Over 480 sales a year that is about $118, before a single commission. The yearly examples further down include both fees.
Payment for order flow: how $0 brokers earn money
Payment for order flow means a market maker pays your broker for sending it your orders. The SEC’s investor site describes it as perhaps a penny or more per share. In return, the market maker executes your order and earns on the spread.
This is the honest answer to the question how $0 can work. A company that covers its costs takes its money elsewhere: through order flow payments, through interest on your idle cash or through margin interest. Brokers must disclose their routing in quarterly Rule 606 reports. The European Union has banned payment for order flow for retail clients since 1 July 2026 at the latest; our guide to the market maker explains how quoting firms earn.
For you, the question is not whether a broker gets paid, but how well your order is filled. A fill one cent better per share on 200 shares is worth $2, more than many commissions. Check the price improvement statistics your broker publishes and compare them with your own fills.
Account, inactivity and withdrawal fees
Account fees are charged whether you trade or not. At large US online brokers they are now the exception: Schwab charges no annual maintenance or inactivity fees, Interactive Brokers charges no maintenance fee, and Fidelity charges a small quarterly fee only on tiny balances under $100 with no activity for 12 months. Where fees remain, they are often tied to paper statements, low balances or special services.
For an active trader this item is usually the least important. If you trade 20 times a month, the spread costs you more than any account fee. If you buy only twice a year, look here first and not at the commission. Our guide to brokerage accounts lists the fee schedules of four US brokers, transfer fees and other small print.
Withdrawal fees arise when you move money from the trading account to your bank. Schwab charges $25 for an outgoing wire, or $15 if you submit it online. Interactive Brokers allows two free withdrawals per calendar month and then charges $10 for a USD wire. Fidelity charges nothing for a domestic wire. The item is small, but it grows if you get into the habit of taking out profits every week.
Slippage: the cost on no statement
Slippage is the difference between the price at which you place an order and the price at which it actually fills.
It appears in no fee table and is still paid from your account. Slippage arises whenever the market moves between your order and its execution: at news releases, at the open, in thin markets and with large orders in small stocks. It is even more common in pre-market and after-hours trading, when fewer buyers and sellers are active.
Slippage can work in both directions. Whether it helps or hurts depends on whether you are long or short and whether you open or close. In practice the balance for private traders is usually negative, because the market moves fastest exactly when many people want out at the same time.
How to limit slippage
You cannot avoid slippage completely, but you can limit it. The most effective lever is the order type: a limit order fills only at your price or better. It costs nothing extra; you only risk that it does not fill at all. Our guide to order types shows which order fits which situation.
With stop orders it is the other way round. When a stop is triggered, it becomes a market order and takes the next available price. This is where the slippage arises that hurts most in risk management, because it makes the planned loss larger. A stop-limit order caps the price, but then the order may not fill in a fast move.
Some brokers offer guaranteed stops that fill exactly at the stop price. You pay a premium for this, usually only when the stop is hit. These products are mostly offered outside the United States. Either way it is not saving a cost but swapping it for predictability.
Market data and software: the costs next to the broker
Up to here, every fee came from your broker. The second block has nothing to do with the broker: you pay exchanges for price data and software providers for charting and analysis. For a day trader this is often the larger of the two.
What real-time quotes really cost
Market data fees are monthly licence fees that exchanges charge for real-time prices.
Without such a licence, many platforms show prices delayed by 15 minutes. For a long-term investor that is enough. For anyone who trades intraday it is useless: a quarter of an hour is not information in day trading, it is history.
How much you pay depends on a classification many traders overlook: non-professional or professional. If you count as a professional, for example because you use the data for a business or hold a relevant registration, you pay many times more for the same exchanges. This is the price list of Interactive Brokers:
| Package, per month | Non-pro | Pro |
|---|---|---|
| NYSE, Network A | $1.50 | $45.00 |
| NYSE American and regional, Network B | $1.50 | $25.00 |
| Nasdaq, Network C | $1.50 | $25.00 |
| Nasdaq TotalView, market depth | $16.50 | $90.00 |
| CME futures | $1.55 | not listed |
Level 1 quotes unless stated; non-pro means non-professional subscriber. Source: Interactive Brokers market data pricing, checked on 12 November 2026. The “US Securities Snapshot and Futures Value Bundle” costs $10.00 a month and is waived if your commissions reach $30.00 in that month.
A US stock day trader with all three networks and TotalView pays $21.00 a month, $252 a year, before a single trade. Classified as a professional, the same data costs $185.00 a month, or $2,220 a year. Market data is the only cost block that keeps running even when you do not trade at all.
Trading software and extra tools
Your broker’s platform is included in the price. If you need more, you pay extra: trading software with advanced charting, screeners and backtesting costs from a single-digit to a three-digit amount a month, depending on the provider. TradingView has a free basic plan that is enough for many swing traders, and for a simple stock search a free stock screener is often enough.
Before you spend money here, ask one sober question: do you earn more with the tool than it costs? At 200 trades a month, a $50 subscription pays for itself with a quarter of a dollar per trade. At four trades a year it never does. The same calculation applies to signal services and paid chat rooms: they have to pay for themselves from your trading result.
Holding costs: what a position costs overnight
Holding costs are interest and fees you pay when you keep a position open past the trading day. In the US they come in three forms: margin interest when you buy with borrowed money, a borrow fee when you sell short, and rollover in forex.
Margin interest is often the largest single cost for anyone who borrows. Schwab’s base rate is 10.25 percent since 18 September 2026, and for balances under $25,000 it charges 12.075 percent a year. Interactive Brokers Pro charges its benchmark rate plus 1.5 percent for the first $100,000. Schwab counts interest on a 360-day year, so borrowing a constant $10,000 at 12.075 percent for ten calendar days costs $10,000 × 12.075% × 10/360, about $33.54.
Short sellers pay a borrow fee instead. For most large stocks it is small, for hard-to-borrow stocks it can be very high and change daily. Our guide to short selling explains borrow fees, margin and dividends that a short seller has to pay.
In forex, rollover is charged or credited for every day a position is held past 5 pm ET. OANDA’s US financing page explains that the Wednesday rollover counts three days to cover the weekend. Depending on the interest rate difference of the two currencies and your direction, the amount can be a cost or a credit. CFDs, which carry similar overnight charges elsewhere, are not offered to US residents; Interactive Brokers, for example, excludes them.
In practice: calculate the holding cost for your planned holding period against your price target before you enter. Margin interest and borrow fees run on calendar days, so a swing trade held over two weekends for ten trading days pays for 14 days. Forex counts rollover days, with the triple Wednesday and holiday adjustments. If the target is only just above the summed holding costs, the trade does not pay, however good the chart looks.
Taxes: the largest single item on every gain
In the US, the holding period decides how your trading gain is taxed. This section assumes a taxable account, not an IRA. If you hold a stock for one year or less, the gain is short-term and taxed as ordinary income, at federal rates from 10 to 37 percent. If you hold it for more than one year, it is long-term and taxed at 0, 15 or 20 percent. The IRS explains the rules in Topic 409.
| Long-term rate | Single, 2026 taxable income | Married filing jointly, 2026 taxable income |
|---|---|---|
| 0% | up to $49,450 | up to $98,900 |
| 15% | up to $545,500 | up to $613,700 |
| 20% | above $545,500 | above $613,700 |
Source: IRS Revenue Procedure 2025-32 for tax year 2026. Short-term gains use the ordinary brackets, 10 percent up to $12,400 for a single filer and 37 percent above $640,600.
Most active traders pay the ordinary rate, because they rarely hold a year. Higher earners also owe the net investment income tax of 3.8 percent above $200,000 of modified adjusted gross income for a single filer and $250,000 for a married couple filing jointly (Topic 559). State income tax can come on top.
Losses help, within limits. If your losses exceed your gains, you can deduct up to $3,000 a year against other income, $1,500 if married filing separately, and carry the rest forward. The wash sale rule disallows a loss for now if you buy a substantially identical security within 30 days before or after the sale (Publication 550). Active traders trip over this rule more often than over any fee.
Futures and broad index options follow their own rule. Gains and losses on Section 1256 contracts, which include regulated futures and broad-based index options, count as 60 percent long-term and 40 percent short-term, however long you held them. Positions still open at the end of the year are marked to market, taxed as if sold at the year-end price, even without a sale. They are reported on IRS Form 6781. This is general information for US taxpayers, not tax advice; ask a tax professional about your own case.
Which costs hit which product
Not every cost hits every product. If you trade futures, you pay no margin interest on the contract, but per-contract fees and data. If you trade stocks on margin, data is cheap, but interest runs every night. The overview shows what to watch for each instrument.
| Product | Main cost | Often overlooked |
|---|---|---|
| Stocks and ETFs | Spread | SEC fee and TAF on every sale, margin interest |
| Options | Commission per contract | Wide spreads, regulatory and clearing fees per contract |
| Futures | Commission per contract | Exchange fees, NFA fee and market data |
| Forex | Spread | Rollover in each direction |
The per-contract items in futures and options are small but certain. Interactive Brokers charges $0.85 per E-mini and $0.25 per Micro E-mini contract. On top come the exchange fee and the NFA fee, which is $0.01 per side since 1 July 2026 and goes back to $0.02 on 1 July 2027. For options, the clearing house OCC normally charges $0.025 per contract. Our guide to options trading for beginners explains contract sizes and premiums.
The practical conclusion is uncomfortable: no broker is the cheapest for every product. A broker with excellent futures commissions can be expensive for options or US stocks. Calculate the costs for the one instrument you really trade, not for the whole offer.
What trading costs add up to in a year
Single amounts say little. Only when you extend them to a trading year do you see which item decides your result. The three hypothetical profiles compare a per-share broker (Interactive Brokers Pro Fixed, $0.005 a share, $1.00 minimum) with a $0-commission broker over a full year. Both columns show commissions plus regulatory fees only: the SEC fee at today’s rate and the TAF at the rate that applies again from January 2027, before broker rounding.
| Profile | Commission and fees, per-share broker | Commission and fees, $0 broker |
|---|---|---|
| Day trader, 40 trades a month, 200 shares at $50 ($10,000) | about $1,078 | about $118 |
| Swing trader, 5 trades a month, 100 shares at $50 ($5,000) | about $127 | about $7 |
| Position trader, 12 trades a year, 200 shares at $100 ($20,000) | about $29 | about $5 |
Illustrative calculation at constant rates. Not included: spread, slippage, margin interest, borrow fees, market data, software and tax.
A trade consists of two orders, a buy and a sell. For the day trader that is 960 orders a year at $1.00 each, plus about $99 in SEC fee and $19 in TAF on 480 sales. The difference in commissions looks large, but the spread is not included yet: crossing a one-cent spread on 200 shares costs $2 per round trip, or $960 a year, as much as the whole commission. A better or worse fill decides more than the price list.
Market data comes on top for all three profiles. For the day trader with all three US networks and TotalView that is another $252 a year; the position trader often needs none, because delayed prices are enough. Taxes stay out of this calculation on purpose, because they only arise on gains, while the fees above are paid even in a losing year.
Day trading: commission and spread beat everything
In day trading, every position is closed on the same day. Holding costs disappear completely, but the commission and the spread multiply. If you make 40 trades a month, you cross the spread 40 times, and at this style it is often more expensive than all commissions.
Account fees are secondary here. What counts: low per-share costs, tight spreads and good order execution. On top come market data, which is not optional in day trading. Size each trade with a clear position sizing rule so that costs stay small against your risk.
Swing trading: overnight costs become a factor
In swing trading you hold positions for days to weeks. The number of orders falls, but an item appears that the day trader does not know: margin interest, a borrow fee or rollover for every night the position stays open.
Overnight costs are counted in calendar days, so a weekend counts too. Whether that is a lot depends on the instrument, the direction and whether you borrow at all. A cash account pays no margin interest. Calculate the overnight cost before you enter, against your price target, not afterwards.
Position trading: position size decides
Anyone who opens only a few positions a year has the lowest fees in absolute terms. In relative terms it can still be expensive if the positions are small. A $500 position in a $5 stock with a ten-cent spread costs you about 2 percent of the trade before the price has moved.
Here it pays to look at items active traders can ignore. Check account fees, transfer fees and the tax holding period, because one more day can turn a short-term gain into a long-term one. Real-time data and expensive software you can usually do without.
Across all three styles, one rule has proven itself in my practice. Your entry and exit costs together should not exceed one percent of the position size. If you are above that, either the position is too small or the broker or market is the wrong one. How such frictional losses change the expectation of a strategy shows in its profit factor once you include all costs in a backtest.
Where can I trade most cheaply?
The honest answer: it depends on what you trade and how often. For US stocks and ETFs, the large $0-commission brokers are hard to beat on the price list. For futures, many option contracts or foreign markets they are often not the right place.
More important than the cheapest broker is another question: how does this broker earn money if it charges no commission? As shown above, it earns through payment for order flow, interest on your idle cash or margin interest. None of this is wrong, but you should know where your money goes.
$0-commission brokers: what you get and what is missing
For most US stock and ETF traders, a $0-commission broker is a sensible choice. If you need tools, markets or order types that are missing there, you pay for the saving elsewhere. These two lists sum up what the low price means.
What you get:
- $0 commission for online US stocks and ETFs, often also for options apart from per-contract fees.
- No account minimum and no maintenance fee at the large brokers.
- Fractional shares and simple apps that suit small, regular purchases.
What you may give up:
- Direct routing: you usually cannot choose the exchange your order goes to.
- Market access: fewer foreign stocks, futures or bonds, depending on the broker.
- Cash yield: the default sweep of your idle cash can pay little interest.
- Advanced orders and tools: some conditional orders and professional data are limited.
The lists show the real trade-off: you pay for the low commission with choice. As long as you trade liquid large caps in regular hours, that costs you little. In small stocks, outside regular hours or in fast markets, a poor fill can cost more than any commission.
So my practical advice: do not compare brokers by their fee table, compare them with a sample order in your instrument. Add up the buy commission, the sell commission, the fees on the sale and the spread you actually crossed. Against the midpoint, each order that trades at once pays about half the quoted spread, so a round trip pays about one full spread, plus any slippage.
How to cut your trading costs
Not every cost can be influenced equally well. The biggest levers are where you make a one-time decision that then works on every trade: the choice of broker, order type and position size.
- Match the position size to the costs. Stay under one percent for entry and exit together. If you cannot, you trade too small.
- Do not buy into the spread. Market orders at the open and at news releases pay the widest spread. A limit order costs nothing and protects you from slippage.
- Trade in regular hours. Spreads in large US stocks are usually tightest in regular hours, 9:30 am to 4:00 pm ET.
- Limit market data to what you use. Nasdaq TotalView costs $16.50 a month more than level 1 at Interactive Brokers. If you do not read market depth, you do not need it.
- Check your non-professional status. A wrong classification multiplies your data fees, from $1.50 to $45.00 a month for NYSE level 1 alone.
- Calculate the holding period against margin interest. At 12 percent a year, a long holding period on borrowed money eats the move.
- Mind the tax calendar. Holding more than a year can lower the rate, and the wash sale rule can delay a loss you counted on.
What you should not do: choose a broker by the commission alone. A broker that cannot fill your order well or lacks the market you need costs you more through worse prices than it saves in fees. And those costs appear on no statement.
Conclusion: trading costs are the part of the result you can plan
I have traded since 1980, and one thing has not changed in all these years: costs are the part of the calculation you can plan best. Whether a trade works, you do not know. The commission and the published fee rates you can work out before you place the order, and the spread, slippage and financing you can estimate and then check against your fills and statements. That is why it annoys me that so many traders leave this part to chance.
The biggest mistake I see is not an expensive broker, it is a position that is too small for its costs. If you buy $500 of a $5 stock with a ten-cent spread, you have to make up about 2 percent just to stand at zero. That is no longer a fee question, it is a strategy problem.
If you want to turn one screw, turn this one. Work through one typical round trip in your instrument completely: both commissions, the fees on the sale, the spread and any slippage. Set that against the position size. If the value is above one percent, you have a result you can work on immediately.
And the second piece of advice I would have liked to give myself earlier: the cheapest broker is rarely the best. A missing market or a missing order type costs more in one bad fill than a year of fee difference. Decide by what you really trade, not by the number on the home page.
Frequently asked questions about trading costs
What fees are there when trading?
Trading has six types of cost. They are the spread, the commission, regulatory fees on sales, holding costs for positions overnight, market data fees for real-time quotes and the tax on realized gains. Spread and commission hit every trade, the others depend on the broker and your trading style.
How much are trading fees in the US?
Many large US brokers charge $0 for online stock and ETF trades. Options usually cost about $0.65 per contract, and per-share brokers such as Interactive Brokers Pro charge $0.005 a share with a $1.00 minimum. On every sale come the SEC fee of $20.60 per million dollars and, from January 2027 again, the FINRA TAF.
Can I trade without fees?
Trading is never completely free. Even at $0 commission you pay the spread, the difference between the buying and selling price, and the regulatory fees on sales. Commission-free brokers earn through payment for order flow, interest on your cash or margin interest.
What are the SEC fee and the FINRA TAF?
Both are small regulatory fees on the sale of securities that your broker passes on to you. The SEC fee is $20.60 per million dollars of sales since 4 April 2026. The FINRA trading activity fee is normally $0.000195 per share, at most $9.79 per trade; it is paused from 1 October to 31 December 2026.
What is payment for order flow?
Payment for order flow is money a market maker pays a broker for routing customer orders to it. It is how many $0-commission brokers earn money. For you, what matters is the execution quality: whether your orders fill at the quoted price or better.
How much do real-time quotes cost?
At Interactive Brokers, level 1 quotes for each of the three US stock networks cost $1.50 a month for a non-professional. Nasdaq TotalView with market depth costs $16.50. A professional pays $45.00 for NYSE level 1 and $90.00 for TotalView. Without a licence, many platforms show prices delayed by 15 minutes.
When do I pay tax on trading gains?
For stocks and ETFs in a taxable account, you pay federal tax on gains in the year you sell. Gains on positions held one year or less are taxed at your ordinary rate, gains held longer at 0, 15 or 20 percent. Futures and broad index options follow the 60/40 rule and are taxed at year end even if still open, and losses beyond your gains are deductible up to $3,000 a year.
Sources
All fees and rules were checked against these primary sources on 12 November 2026. Brokers change prices and regulators change fee rates during the year, so check the current page before you decide.
- SEC and Investor.gov: Section 31 fee rate advisory 2026-2, Executing an order, payment for order flow.
- FINRA and NFA: TAF fee adjustment schedule, TAF pause, SR-FINRA-2026-021, NFA assessment fees.
- IRS: Topic 409, capital gains, Topic 559, net investment income tax, Publication 550, Revenue Procedure 2025-32.
- Brokers: Interactive Brokers stock commissions, options, futures, market data, margin rates, other fees; Schwab pricing, Schwab margin rates, Schwab brokerage; Fidelity commissions and margin rates; Robinhood trading fees; OANDA US financing costs; OCC schedule of fees.
This article is educational information, not investment or tax advice. Trading involves risk, including the loss of your money.
This US edition is based on our German edition on kagels-trading.de and has been adapted for US readers.
More Markets and Brokers guides
- Open your first account
What Is a Brokerage Account? A US Beginner's Guide
How to open and fund a US brokerage account, cash vs margin, what it costs and what SIPC and FDIC really cover.
- Choose a broker
Interactive Brokers Review 2026: Fees and Platforms
Fees, platforms, investor protection and real futures commissions from a client since 1996.
- Check an offshore broker
PU Prime Review 2026: FCA Warning, Licences and Costs
Which PU Prime company you contract with, what the FCA warning means, and what 1:1000 leverage and the deposit bonus do to your account.
- Check an EU CFD broker
Tradeview Review 2026: Tradeview Europe, MFSA and Costs
What the Malta licence of Tradeview Europe covers, how it differs from the Cayman company, and what the three MetaTrader 5 accounts cost.
- Check CopyX
CopyX Review 2026: Is TAG Markets Copy Trading Legit?
Who runs the TAG Markets copy trading platform, which regulators warn about it, why US residents are excluded and how fast the 12x Amplify account eats your deposit.
- Choose a US forex broker
OANDA Review 2026: Fees, TradingView and US Rules
OANDA from its own pages and NFA records: spreads and fees, TradingView and the demo, FIFO and three penalties.
- Understand your price
Market Makers: Who Sets Your Price and How They Profit
How market makers earn on the spread, who sets prices at German trading venues and what the EU ban on payment for order flow changed.
- Size up a bull market
Bull Market: How Long It Lasts and How to Spot the End
When a rise becomes a bull market, how long the 27 completed S&P 500 bull markets since 1928 lasted and gained, and where the current one stands.
- Read bond market stress
MOVE Index: The VIX of the Bond Market, Explained
What the MOVE index measures, which readings signal stress, how it differs from the VIX and where its limits are.
- Read stock market fear
VIX Index: What the Fear Gauge Measures and Normal Levels
What the VIX measures, which levels have been normal since 1990, how closely it tracks the S&P 500 and how VIX futures, options and ETPs work.
- Read the risk mood
Risk-On vs Risk-Off: Meaning, Assets and Indicators
What risk-on and risk-off mean, which assets rise and fall in each mode, five market shocks since 2008 and the VIX, DXY and AUD/JPY signals.
- Read market sentiment
Fear and Greed Index: How It Works, Tested Since 2021
How CNN builds its Fear and Greed Index from seven measures, what the zones mean and how the S&P 500 moved after readings below 20.
- Size up a bear market
Bear Market: How Long It Lasts and How to Spot One
When a decline becomes a bear market, how long the 27 S&P 500 bear markets since 1928 lasted, how long the recovery took and why Bitcoin had three since 2025.
- Trade an index CFD
Index CFDs at Interactive Brokers: Symbols, Costs and Trading
All 13 IBKR index CFDs, margin, stop and close-out worked through for IBDE40, financing, UK hours and the TradingView limit.
- Size an index future
Micro Futures: MES vs MNQ, Tick Values and Risk
MES and MNQ tick values, a worked sizing example from the stop with costs and slippage, and why margin is not your risk.
- Choose between futures and CFDs
Futures vs CFDs: Regulation, Order Execution and Costs
Who your counterparty is, EU, UK and US rules, how stops are triggered on CME and at CFD providers, and booked costs in a DAX example.
- Read the futures curve
Contango vs Backwardation: Futures Curves Explained
What contango and backwardation mean, what rolling does to a position in each case, and real gold, oil and gas curves from 28 October 2026.
- Understand the spot market
Spot Market Explained: Definition and Settlement Times
What a spot market is, why two days is a minimum and not a limit, and when stocks settle at T+1 in the US, EU, UK and Switzerland.
- Choose a silver future
Silver Futures: SI vs Micro Silver vs 100-oz SIC
SI, Micro Silver and the 100-ounce SIC compared by tick value, risk per contract, margin and December 2026 deadlines.
- Read the chip sector
SOX Index: Holdings, Weighting and How to Use It
What the SOX holds, how Nasdaq caps the weights, its largest declines since 2004 against the Nasdaq-100 and which ETFs really track it.
- Read the biotech sector
Nasdaq Biotechnology Index: Holdings, Weighting and Risks
What the NBI holds, how Nasdaq caps the weights, its long declines since 2003 against the Nasdaq-100 and which ETFs really track it.
- Read the transport sector
Dow Jones Transportation Average: Stocks and Dow Theory
The 20 stocks in the Dow transport index, why the share price sets their weight, declines since 1992 and what Dow Theory can and cannot tell you.
- Read the French market
CAC 40 Index Explained: All 40 Stocks, Weights and Trading Hours
All 40 CAC 40 stocks, how Euronext caps the weights at 15 percent, trading hours in Eastern Time and how it differs from the DAX.
- Research stocks
InvestingPro Review: Screener, ProPicks AI and WarrenAI
What the InvestingPro screener, ProPicks AI and WarrenAI do, what Pro and Pro+ cost and who needs which plan.
- Judge a stock-picking newsletter
Motley Fool Stock Advisor Review: Cost and Track Record
What Motley Fool Stock Advisor costs after the first year, how the advertised return is calculated, refund and renewal terms, and who it suits.
- Use the free news portal
Investing.com Review: Free Tools, Data and Limitations
What the free Investing.com portal does well, where the quote prices come from and when InvestingPro is worth paying for.
- Find real AI revenue
AI Stocks 2026: How Listed Companies Earn From AI
Which listed companies earn from AI in cloud, software, infrastructure and chips, disclosed AI revenue against hope, plus AI ETFs and risks.
- Compare AI data center suppliers
AI Infrastructure Stocks: 10 Data Center Suppliers Compared
Ten suppliers for power, cooling, servers and optics compared on free cash flow, customer concentration and next dates, with filters and a two-stock comparison.
- Follow an IPO
Anthropic Stock: IPO Date, Valuation and How to Invest
Where the Anthropic IPO stands, how the valuation compares with revenue and how to get exposure before and after the listing.
- Invest in OpenAI before the IPO
OpenAI Stock: Can You Buy It, and Who Owns OpenAI?
Why there is no OpenAI stock yet, who owns OpenAI, where the IPO stands and how much OpenAI you get through Microsoft or SoftBank.
- Understand a stock split
Stock Splits Explained: Forward and Reverse Splits
What forward and reverse splits change and what they do not, the dates that matter, what happens to options and the $1 listing rule.
- Analyze a company
Fundamental Analysis: 12 Ratios, a Worked Example, 5 Steps
Twelve ratios with formulas and rules of thumb, worked through Microsoft's 2026 annual report, a five-step process and the fundamentals of forex, commodities and crypto.
- Value a stock
Value Investing: Intrinsic Value, Margin of Safety, Traps
Intrinsic value against price, a worked DCF with a sensitivity table, Coca-Cola as a real example, the value premium since 1926 and value traps.
- Value a new listing
SpaceX Stock (SPCX): Valuation, Risks and How to Buy
How to buy SpaceX stock, what the company is worth after the IPO and which risks the lock-up calendar brings.