
Natural Gas Price Forecast: Henry Hub Levels and Scenarios


This analysis is from 6 October 2026. Prices have moved since, so the levels below may no longer apply until the next update.
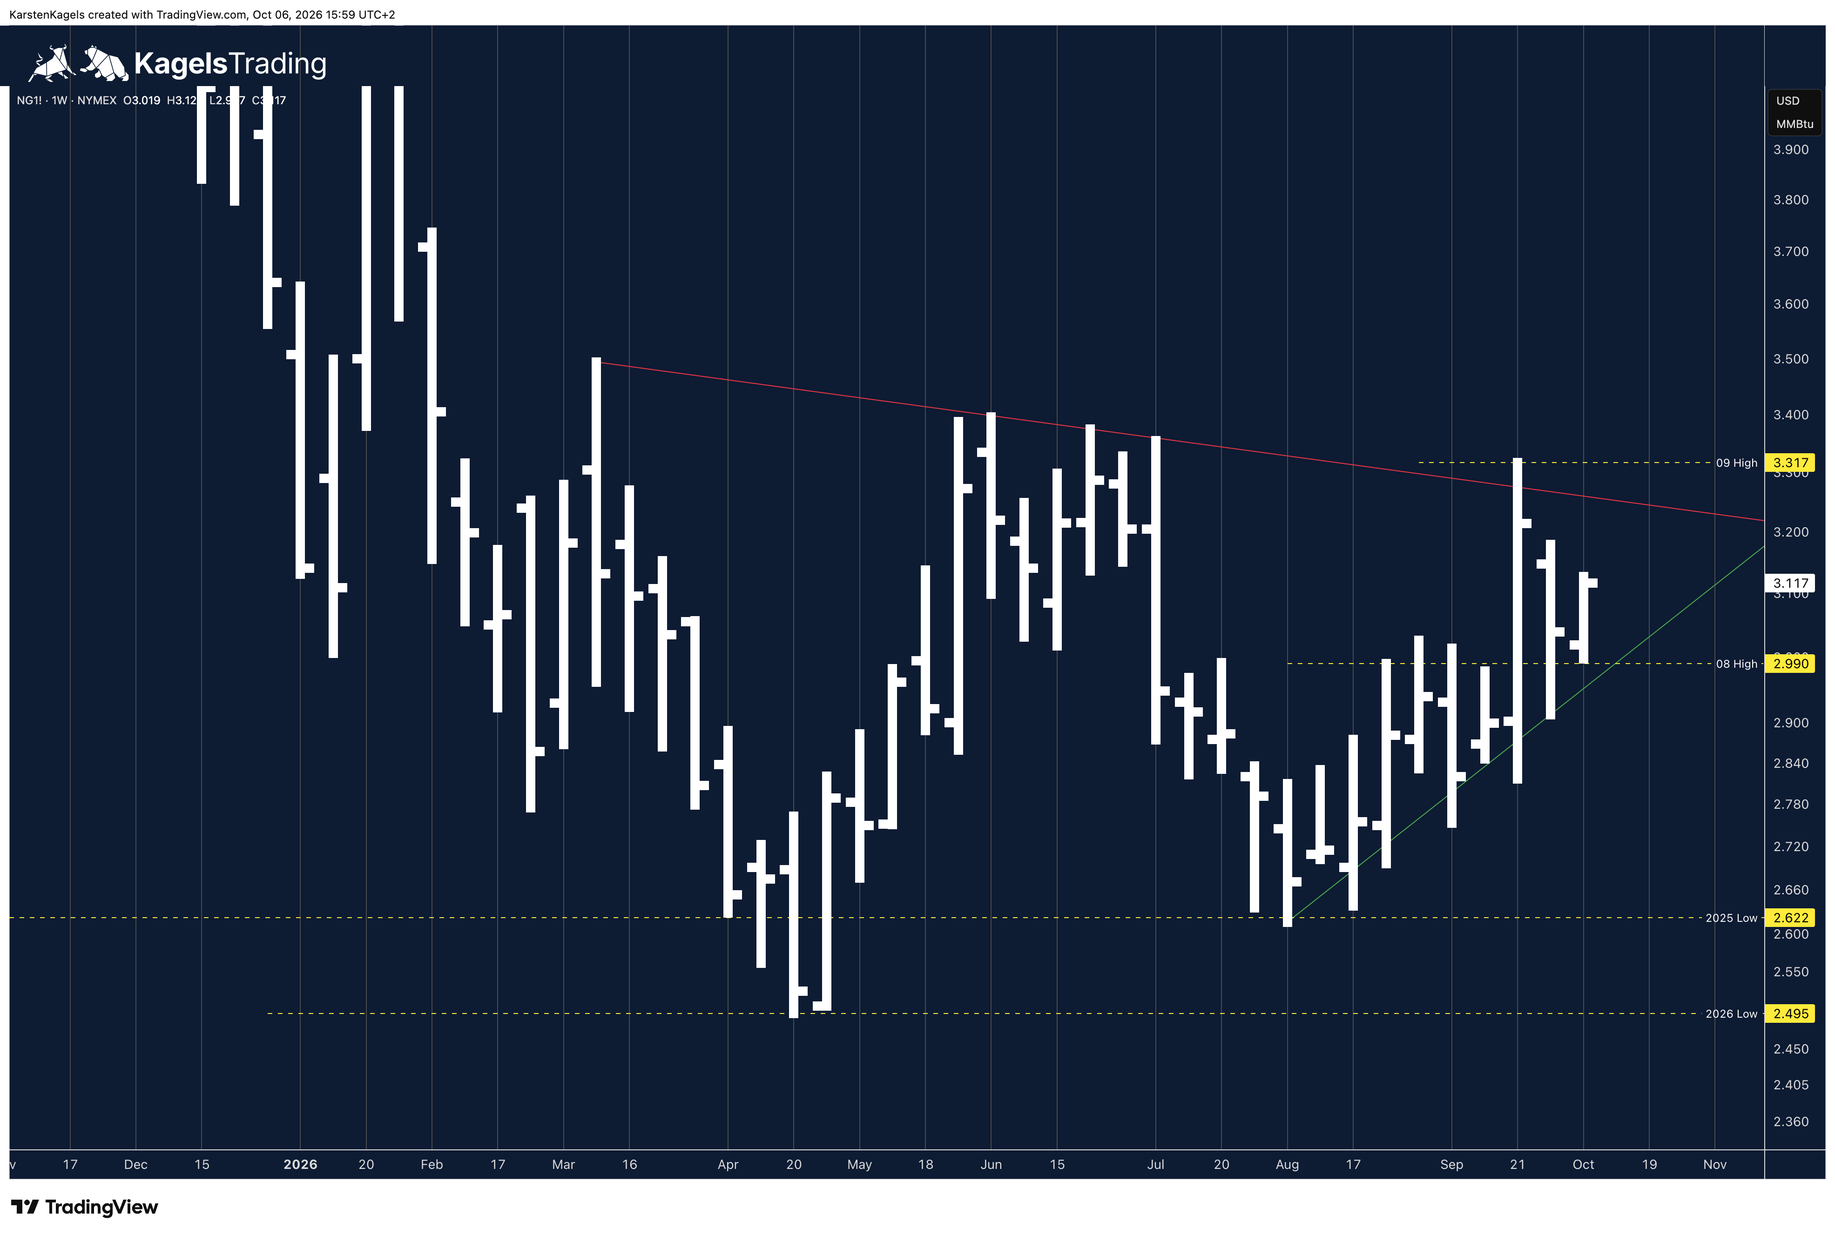
The natural gas future sits in the apex of a triangle on the weekly chart: the downtrend line from March caps it, the uptrend line from the August low at $2.622 carries it. Karsten Kagels expects a breakout from this triangle, and on the daily chart an uptrend has run since August. Above, the September high at $3.317 counts first; below, the picture turns at the October low at $2.912.
Natural Gas forecast in 30 seconds
Short term
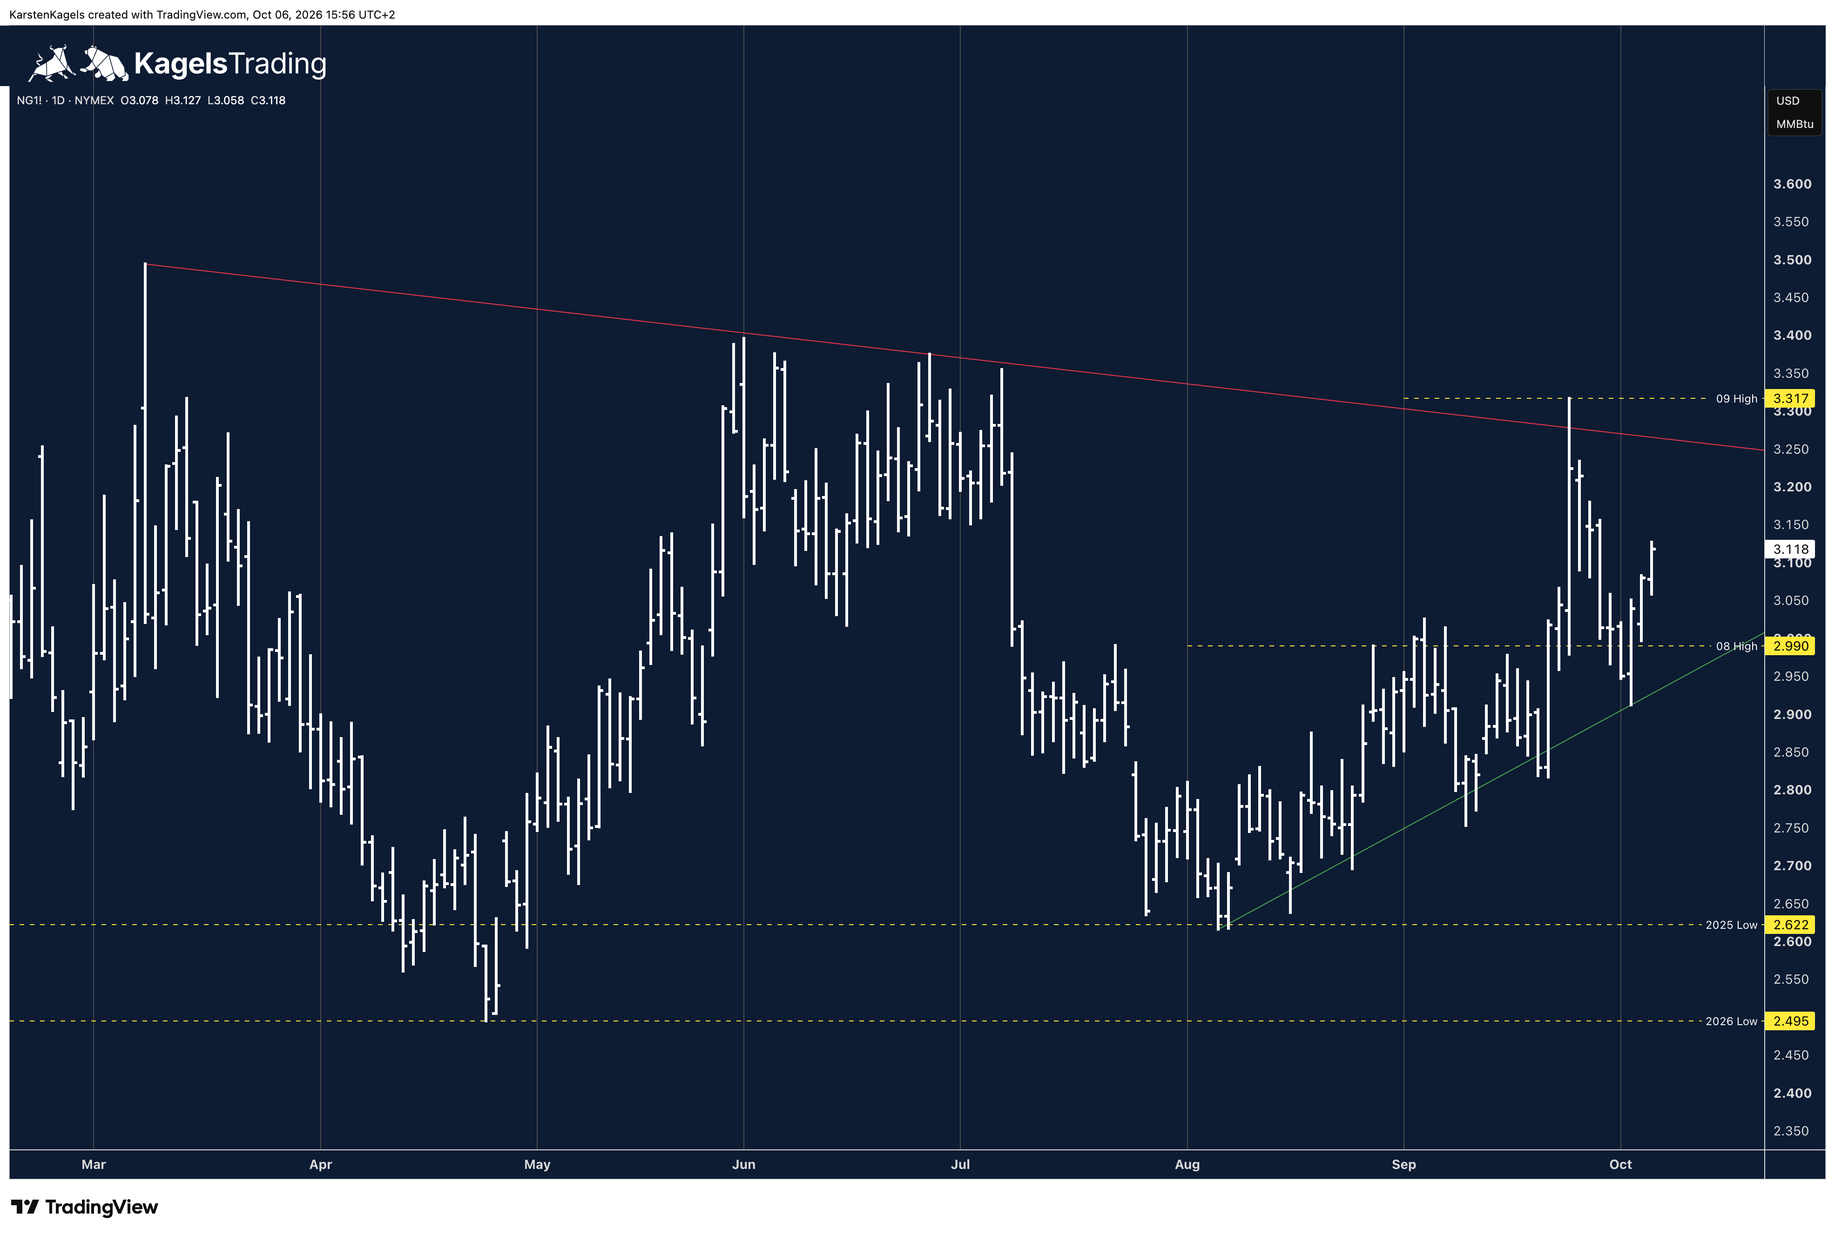
The daily chart shows an established uptrend that started at the August low. The next target is the September high at $3.317.
The level that has to hold
The October low at $2.912. A drop below it turns the positive chart picture negative.
Medium term
The weekly chart shows a diagonal triangle and the price sits in its apex. A breakout is due, with the upside favoured.
What is next
The EIA storage report on Thursday. Then the contract expiry on 28 October and the start of the heating season in November.
On this page
- Natural Gas forecast in 30 seconds
- Natural gas forecast, short term: uptrend since the August low
- Natural gas forecast, medium term: a triangle on the weekly chart
- The three paths and when they apply
- Natural gas forecast, long term: the line that held several times in 2026
- Natural gas on the quarterly chart: the big swings
- Conclusion: uptrend intact, the breakout is still pending
- What can move the natural gas price next
- Frequently asked questions about the natural gas forecast
- Please note
Natural gas forecast, short term: uptrend since the August low
 Click to enlarge
Karsten Kagels exported the four charts on 6 October 2026 between 15:56 and 16:05 CEST. They show the front-month natural gas future NG1! on NYMEX, all with a logarithmic scale. Because the exports were taken at different moments, their last prices differ by a few tenths of a cent, and each caption names the time and price of its own chart. All prices are in US dollars per MMBtu, one million British thermal units. NG1! is the continuous series that strings the single single futures contracts together.
The natural gas future is moving in an established uptrend. It starts at the August low, which is also last year's low at $2.622. The green upward trend line connects the rising lows since then.
From here, further rising prices are possible. The next target would be the September high at $3.317. Below the price, the August high at $2.990 gives support, a level the market won back in September.
A drop below the October low would turn the picture. That level is $2.912. If it goes, the positive chart picture becomes a negative one, and the next stops are last year's low at $2.622 and the 2026 low at $2.495.
Resistance
- $3.317
Price at analysis$3.113
Support
- $2.99
- $2.912
- $2.622
Natural gas forecast, medium term: a triangle on the weekly chart
 Click to enlarge
The weekly chart shows a diagonal triangle, and the price is moving in its apex. The red downtrend line from the March high caps it, the green uptrend line from the August low carries it. Both run towards each other, and the room gets tighter week by week.
Sooner or later this ends in a breakout. The favoured case is a breakout to the upside, towards the 2026 high. The way there starts at the September high at $3.317, which is also the first hurdle above the triangle.
Resistance
- $7.439
- $3.317
Support
- $2.912
- $2.622
- $2.495
The three paths and when they apply
Two levels describe the next bigger move, and in between the answer is to wait. They are orientation levels from Karsten's charts, not order rules, and the chart picture is worth a fresh look after every trading day.
Bullish: above the September high
Above the September high at $3.317 the first hurdle would be taken. On a breakout from the triangle, Karsten Kagels favours a move towards the 2026 high. Whether the breakout is complete is read on the weekly chart, because the lines of the triangle move with time. Wider orientation: the 2026 high at $7.439, from Karsten's yearly chart of 18 September 2026.
Wait: between $2.912 and $3.317
In between, neither level has been reached. That is the case right now: the price sits in the apex of the triangle and between the levels. Waiting lets the market show the direction.
Bearish: below the October low
Below the October low at $2.912 the positive chart picture turns negative. That is how Karsten Kagels describes it on the daily chart. Below it wait last year's low at $2.622 and the 2026 low at $2.495.
Natural gas forecast, long term: the line that held several times in 2026
 Click to enlarge
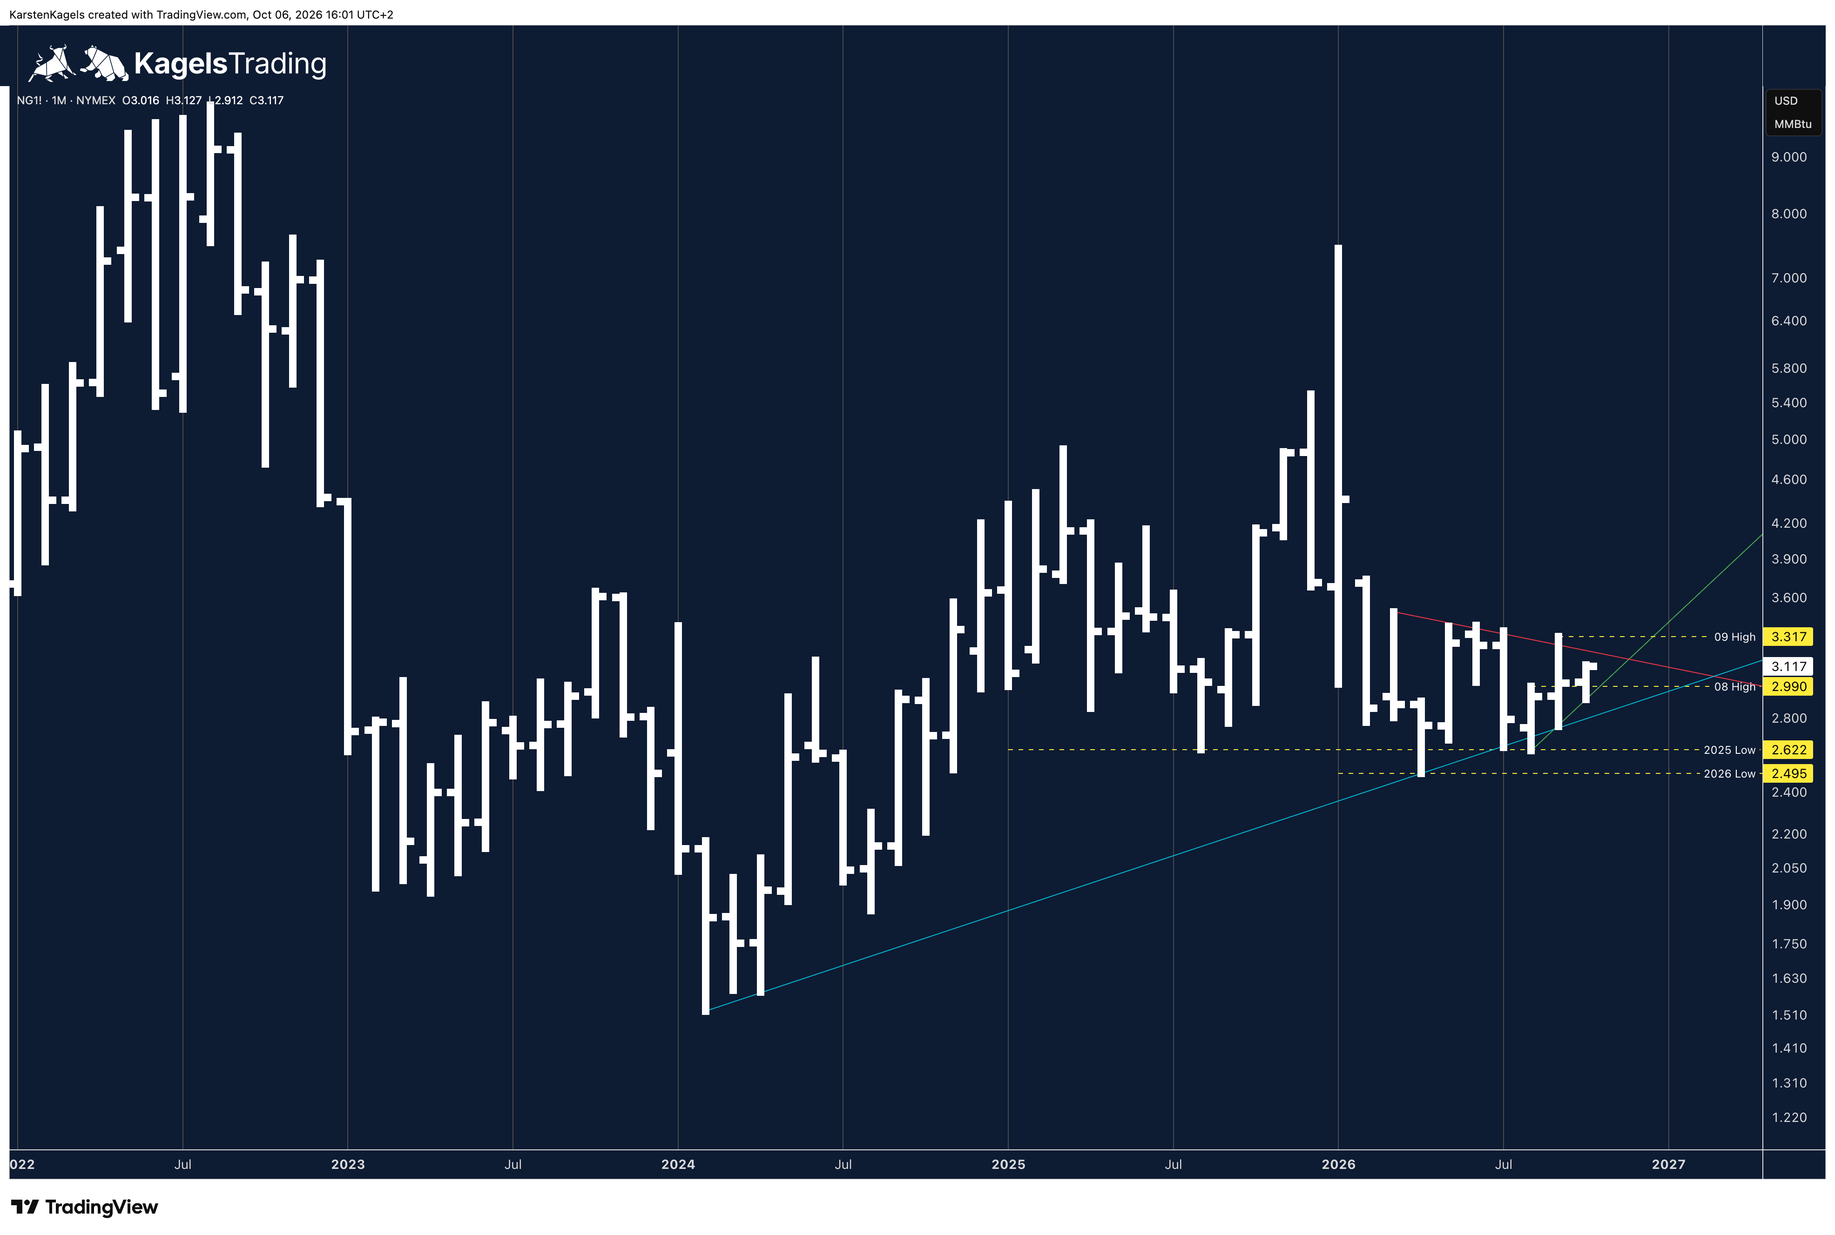
The monthly chart shows a diagonal support line, drawn in light blue. It starts at the 2024 low and has been tested and confirmed several times during 2026, most recently in April and in August.
So there is a second holding line below the current price. The levels from the daily chart stay the first stops; the light blue line is the higher-order support that works over months.
Natural gas on the quarterly chart: the big swings
 Click to enlarge
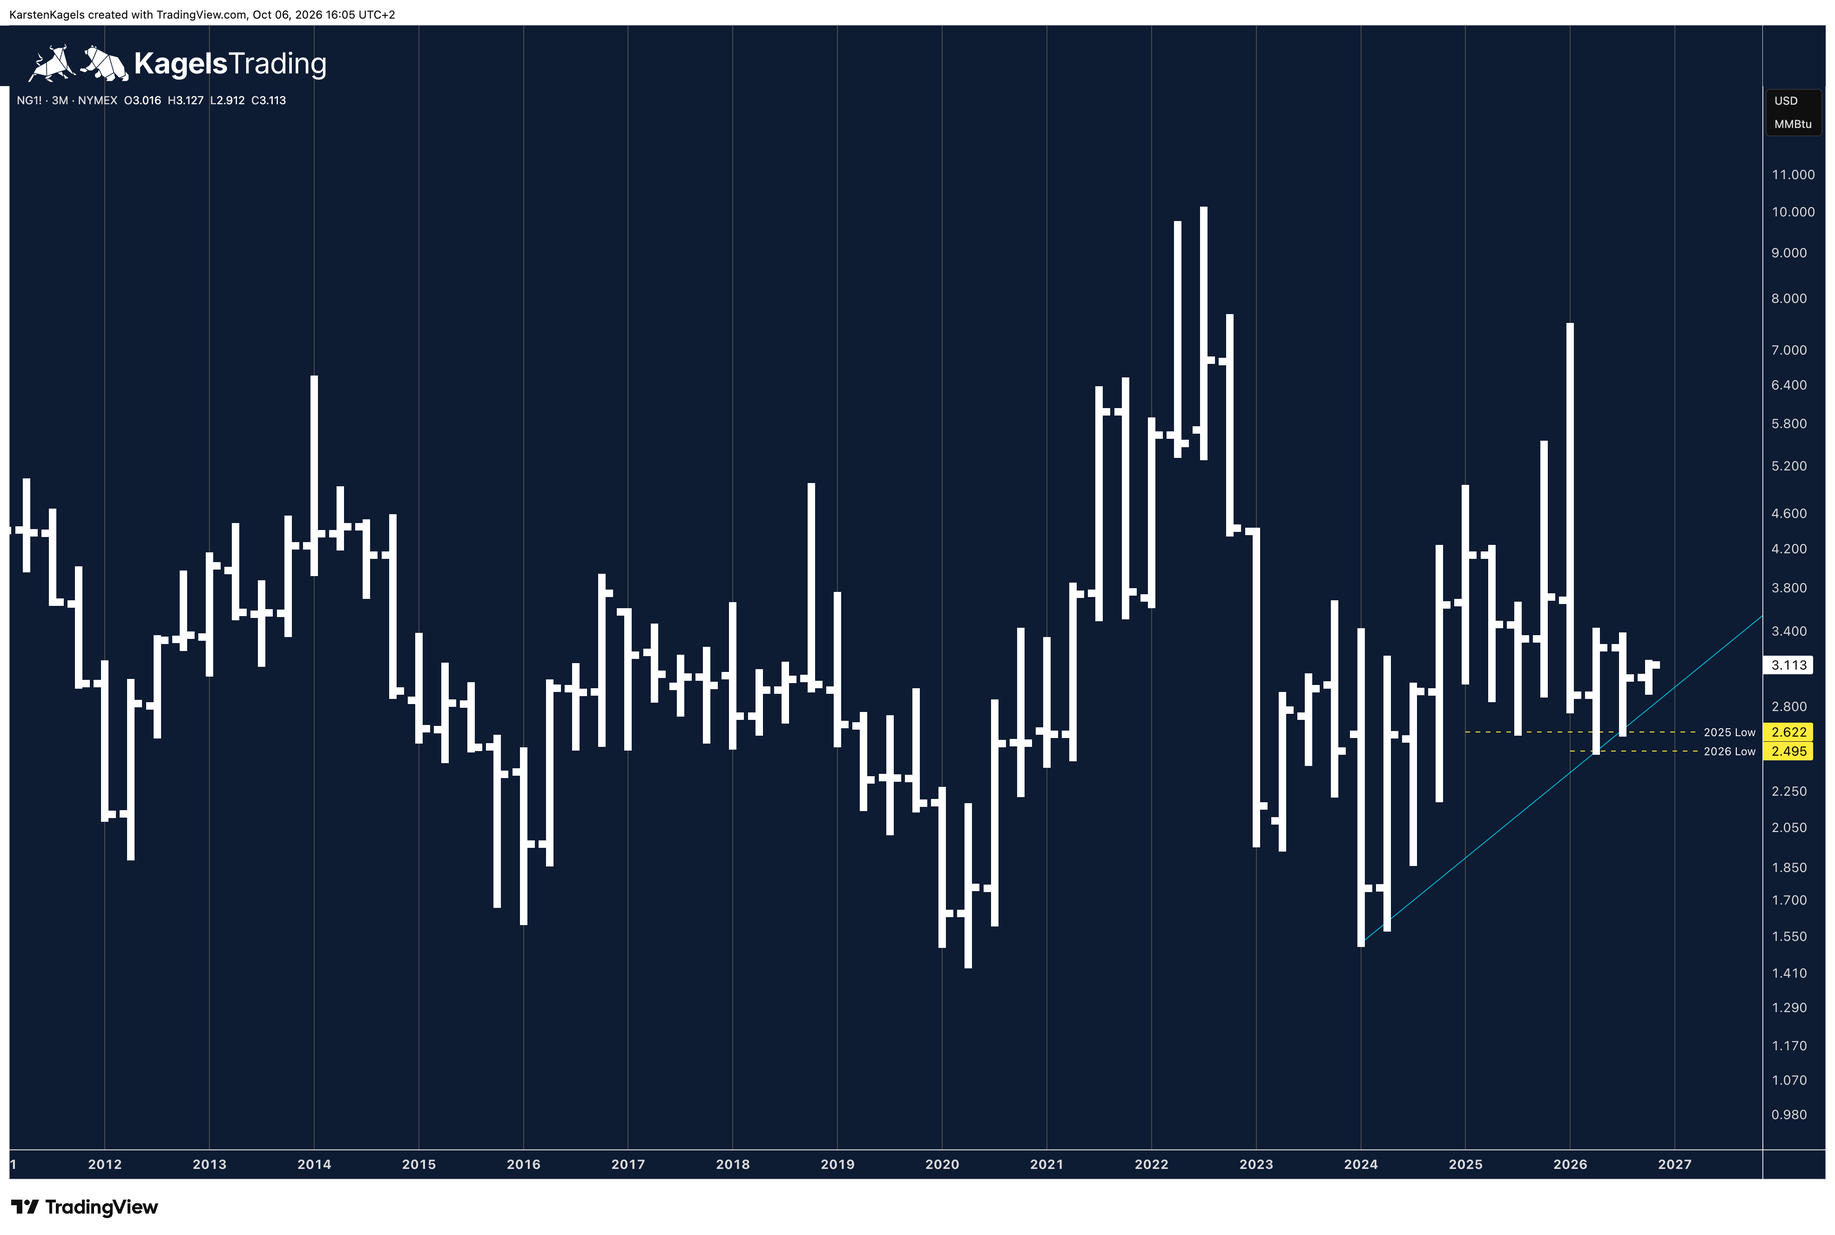
The quarterly chart shows the powerful swings of the natural gas future of the past years. Between the highs above $10 and the lows under $1.50 there are multiples, and the moves run over several quarters. Anyone trading natural gas should plan for this range.
What matters here is the blue long-term uptrend line. It currently acts as a strong support and runs just below the price. As long as it holds, the higher-order picture stays pointed upwards.
Conclusion: uptrend intact, the breakout is still pending
The chart picture is positive as long as the October low holds. On the daily chart the uptrend has run since August, on the weekly chart the price sits in the apex of a triangle. Above, the September high at $3.317 decides; below, the October low at $2.912. A break of that low first weakens the short-term picture, and how the higher-order picture goes on depends on whether the light blue monthly line and the blue quarterly line hold.
What can move the natural gas price next
Three dates set the rhythm for the coming weeks.
- Thursdays, 10:30 am New York time: the US storage report of the Energy Information Administration, usually 16:30 in central Europe. If the number differs from expectations, the future often reacts at once. The time can shift because Europe and the US change their clocks on different dates, and because of the EIA holiday schedule.
- 28 October 2026: trading ends in the November contract. The continuous NG1! series switches to the December contract under TradingView’s own roll rule, which can happen earlier. Price gaps between contracts are normal.
- From November: the heating season in the US. The EIA expects 3,969 billion cubic feet in storage on 31 October, about 5 percent above the five-year average. Full storage tends to weigh on prices.
Two forces work against each other on the fundamental side. High storage levels hold the price down, while LNG exports and the power demand of data centres lift demand. In its Short-Term Energy Outlook of 9 September 2026, the EIA expects a Henry Hub spot price of $3.43 per MMBtu as the 2026 average and $3.28 for 2027.
For the distant future there are only scenarios, not price targets. In the Counterfactual Baseline of the Annual Energy Outlook 2026, the Henry Hub spot price stands at $4.48 per MMBtu in 2030, counted in 2025 dollars; the EIA says expressly that this case should not be seen as the most likely one. Wood Mackenzie expects around $5 per MMBtu by 2035, adjusted for inflation.
Frequently asked questions about the natural gas forecast
How will the natural gas price develop in the next few days?
In Karsten Kagels’ analysis of 6 October 2026, the uptrend on the daily chart stays intact as long as the October low at $2.912 holds, and the next target is the September high at $3.317. Below $2.912 the picture turns, and then last year’s low at $2.622 and the 2026 low at $2.495 come into focus. On the weekly chart the price sits in the apex of a triangle.
Why is natural gas rising or falling today?
On a single day, three things mainly move the price: fresh weather forecasts for the US, the weekly EIA storage report on Thursday, and demand from the LNG export terminals. On top of that come the technical levels where many market participants react at the same time, right now the September high at $3.317 and the October low at $2.912.
When is the weekly natural gas storage report published?
The EIA publishes the US Natural Gas Storage Report every Thursday at 10:30 am New York time, which is usually 16:30 in central Europe. It shows how US storage levels changed against the previous week. If the Thursday falls on a US holiday, the date moves, and the clock change in Europe and the US can shift the local time as well.
What is the natural gas forecast to 2030?
In the Counterfactual Baseline of the EIA’s Annual Energy Outlook 2026, the Henry Hub spot price stands at about $4.48 per MMBtu in 2030, counted in 2025 dollars. Wood Mackenzie expects around $5 per MMBtu by 2035, adjusted for inflation. These are scenarios for the spot price, not price targets for the future.
Please note
The scenarios are a personal assessment based on experience and are not a certainty. This is market analysis, not investment advice. Natural gas is a very volatile market: keep your position sizes in line with your own risk management.
This forecast is translated from the German edition on kagels-trading.de.
How our forecasts are made and reviewed: How we work.