
SOX Index: Holdings, Weighting and How to Use It

Contents
- SOX index in 30 seconds
- What is the SOX index?
- Which stocks are in the SOX index?
- How is the SOX index calculated?
- How has the SOX index performed?
- SOX vs Nasdaq-100
- What moves the semiconductor index?
- How to invest in the SOX
- Strengths and limits of the SOX index
- SOX index: my conclusion
- Frequently asked questions about the SOX index
- About the author
From its record high on 22 June 2026 to late July, the SOX index lost 28.6 percent, after rising 181 percent in the twelve months before. Swings like that are not an exception for the semiconductor index; they are its nature. It tracks the 30 largest US-listed chip companies and moves far more than broad indices such as the S&P 500.
This guide explains what is inside the SOX and how Nasdaq builds it. You will see the selection rules, the weighting caps, the largest declines since 2004 and a comparison with the Nasdaq-100, based on the official index history. It also shows which ETFs really track the SOX, because several popular semiconductor ETFs do not. This article follows our editorial policy and is for education, not investment advice.
SOX index in 30 seconds
- A sector benchmark. The SOX tracks the price of the 30 largest semiconductor companies listed on US exchanges. Its official name is PHLX Semiconductor Sector Index, and Nasdaq calculates it.
- Designers, makers and equipment suppliers. Foreign companies count through their ADRs, such as TSMC, but only with the shares deposited in the US.
- Market-cap weighted with caps. The three largest members may weigh at most 12, 10 and 8 percent, all others at most 4 percent.
- Very volatile. Since 2004 the SOX fell more than 28 percent below its prior high six times, by 68.7 percent at worst in 2008.
- Check the ETF’s index. Invesco’s SOXQ tracks the SOX; the well-known iShares SOXX has followed an NYSE index since 2021.
What is the SOX index?
The SOX index is a stock index that tracks the price of the 30 largest semiconductor companies listed on US exchanges. Its official name is PHLX Semiconductor Sector Index, and it is calculated by Nasdaq. The index itself is not a security: to trade it, you need a product based on it, such as an ETF or an index option.
PHLX stands for the Philadelphia Stock Exchange, where the index began. According to Nasdaq’s index overview, it started on 1 December 1993 at 200 points and was split two-for-one on 24 July 1995. Options on the SOX have traded since 7 September 1994. The exchange is now part of Nasdaq, and the index is published once per second on US trading days.
Quote sites use several names for the same index. You will find Philadelphia Semiconductor Index, PHLX Semiconductor or simply the semiconductor index, all with the symbol SOX. Traders who hold no chip stocks still watch it, because chips go into data centers, cars, phones and factories, and the sector reacts early to changes in demand.
Which stocks are in the SOX index?
The SOX holds exactly 30 companies, chosen once a year by fixed rules. Nasdaq’s index methodology defines who is eligible, and the 30 largest by market value make it into the index.
- Industry: the company must be classified in the Semiconductors Subsector or the Production Technology Equipment Subsector of the ICB industry classification, which covers makers of chip production equipment. That is why equipment makers such as Applied Materials and KLA are included.
- Listing: the shares must trade on a US exchange. The company’s home country does not matter, and ADRs are eligible.
- Size and trading: at least $100 million in market value and at least 1.5 million shares traded in each of the last six months.
- Further conditions: at least three months of trading, listed or eligible options in the US, and only one share class per issuer.
An ADR (American depositary receipt) is a certificate traded in the US that stands for shares of a foreign company. For the SOX, only the part deposited in the US counts: Nasdaq uses the market value of the deposited shares, not of the whole company. For TSMC, that smaller value meets the 4 percent cap for all members outside the top three; at the end of September, TSMC weighed 4.02 percent.
| Company | Symbol | Weight |
|---|---|---|
| Nvidia | NVDA | 11.35% |
| Broadcom | AVGO | 8.67% |
| Micron | MU | 8.13% |
| Intel | INTC | 4.91% |
| AMD | AMD | 4.75% |
| Marvell | MRVL | 4.57% |
| Applied Materials | AMAT | 4.08% |
| KLA | KLAC | 4.06% |
| TSMC (ADR) | TSM | 4.02% |
| Analog Devices | ADI | 4.01% |
The ten largest SOX members according to Nasdaq’s factsheet, as of 30 September 2026: together 58.55 percent of the index. Weights change with every price; Nasdaq publishes the full, current list.
The ten largest members make up almost 59 percent of the index. The other 20 share the rest. Reading the SOX therefore means reading mainly Nvidia, Broadcom and Micron, plus a broad middle of chip designers and equipment makers.
How is the SOX index calculated?
The SOX is a modified market-cap weighted index: each stock is weighted by its market value, and single weights are then capped. Size still decides, but no single company can dominate the index. The caps are applied at the quarterly rebalancing, not every day.
| Rule | Value |
|---|---|
| Largest member | at most 12% |
| Second largest | at most 10% |
| Third largest | at most 8% |
| All others | at most 4% |
| Rebalancing | quarterly, effective after the third Friday of March, June, September and December |
| Reconstitution | once a year, effective after the third Friday of September |
Weighting and review rules from Nasdaq’s index methodology, version with changes up to 6 July 2026. The 12, 10 and 8 percent caps apply since 22 April 2024.
Between two rebalancings, weights may grow beyond their cap. Nasdaq sets the caps with data from a reference date at the end of February, May, August and November; after that, weights move with prices. That is why Micron stood at 8.13 percent on 30 September, slightly above its 8 percent cap, and Intel at 4.91 percent above the 4 percent for the others.
The current caps only apply since April 2024. Before that, no member could weigh more than 8 percent, and five members could exceed 4 percent. Some older sources even describe a price-weighted method that no longer applies, so read older descriptions of the SOX with care. A sector index that really is price weighted today is the Dow Jones Transportation Average.
The familiar SOX level is a price index without dividends. Nasdaq’s list of index versions also includes a total return version with reinvested dividends (symbol XSOX), a net total return version after withholding tax (SOXNTR) and, since 27 July 2026, euro versions. When you compare returns, check which version you are looking at.
How has the SOX index performed?
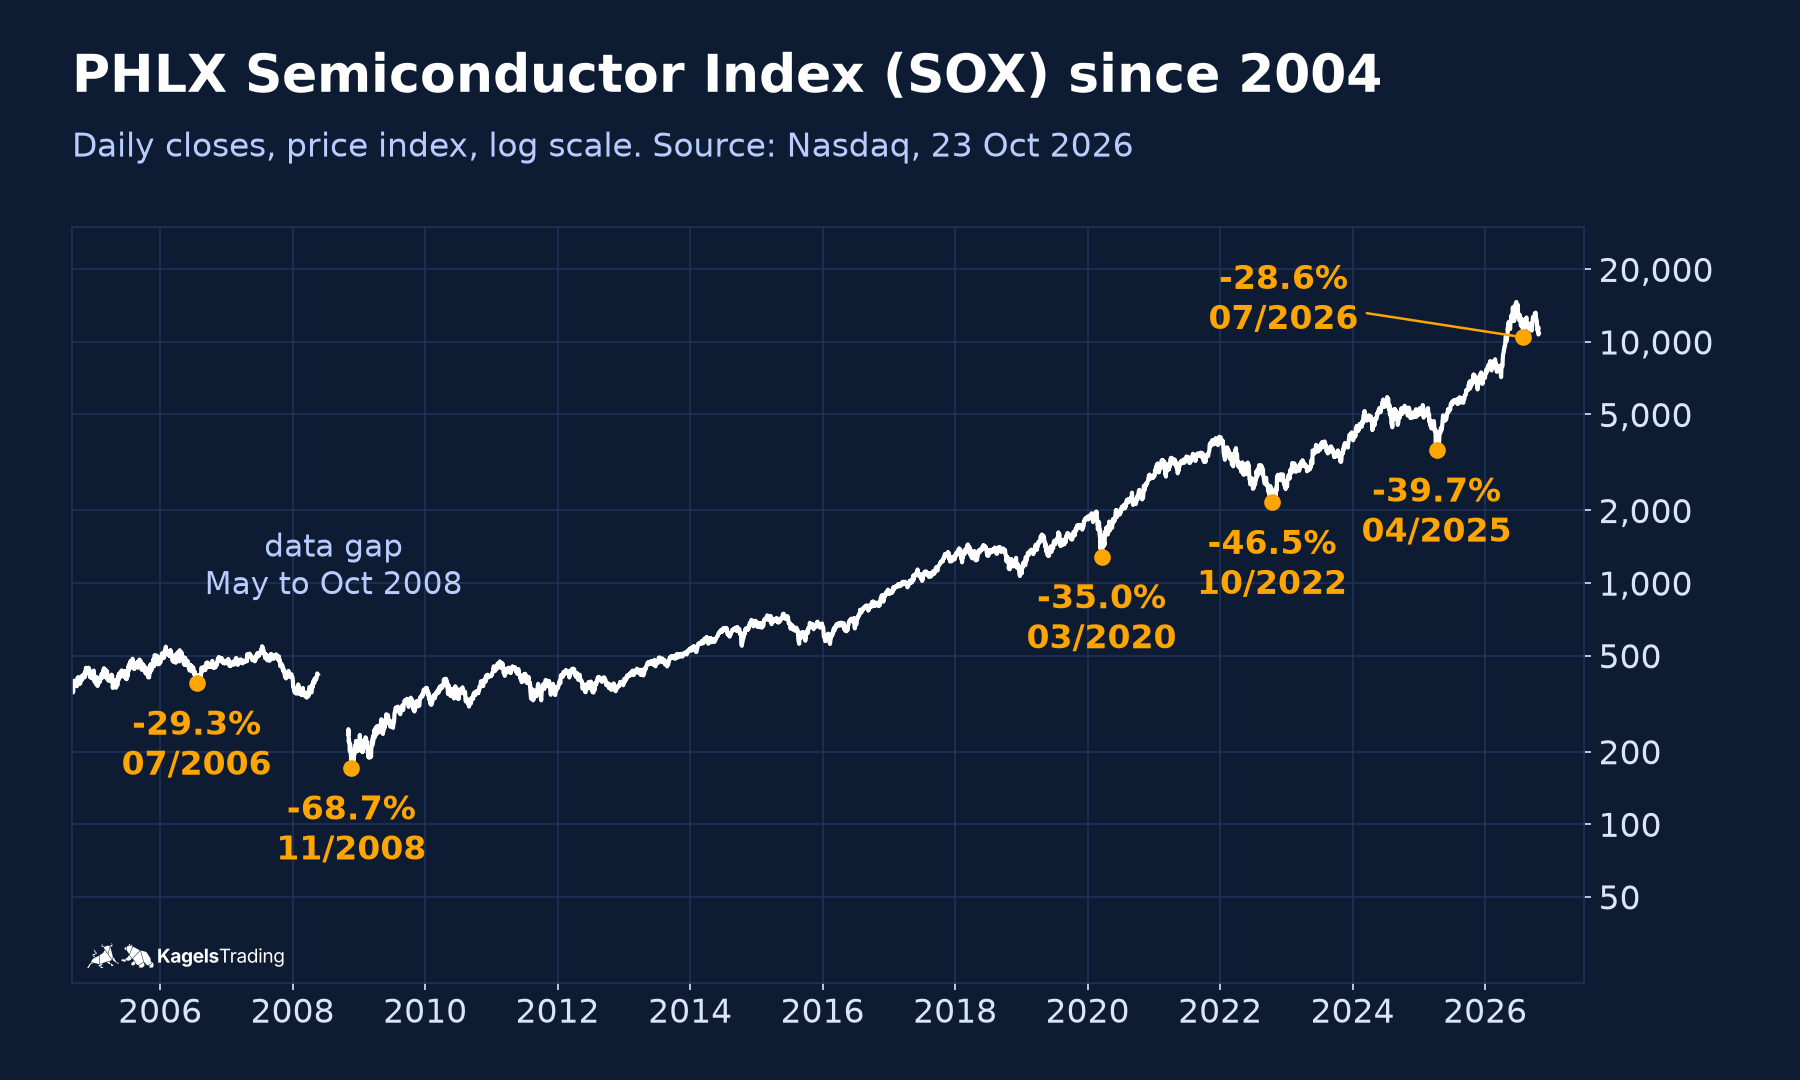
Over the long run the SOX rose strongly, but in waves with deep troughs. On 23 October 2026 it closed at 10,779 points; its record close was 14,635 on 22 June 2026. The chart shows Nasdaq’s official daily series since September 2004 on a log scale, where equal percentage moves look equally large.
 Click to enlarge
The series shows six declines of more than 28 percent since 2004. Each is measured from the highest close up to then to the lowest close before the next high. Two went beyond 40 percent: the financial crisis of 2007 and 2008 and the decline of 2022. July 2026 alone brought a loss of 20.61 percent, according to Nasdaq’s factsheet.
| High to low | Decline | Context |
|---|---|---|
| 07/2007 to 11/2008 | −68.7% | financial crisis |
| 12/2021 to 10/2022 | −46.5% | Fed rate hikes |
| 07/2024 to 04/2025 | −39.7% | new US tariffs |
| 02/2020 to 03/2020 | −35.0% | Covid crash |
| 02/2006 to 07/2006 | −29.3% | after the 2006 high |
| 06/2026 to 07/2026 | −28.6% | after the record high |
Six largest SOX declines since 2 September 2004 (high and low: 17 Jul 2007 and 20 Nov 2008, 27 Dec 2021 and 14 Oct 2022, 10 Jul 2024 and 8 Apr 2025, 19 Feb 2020 and 18 Mar 2020, 1 Feb 2006 and 21 Jul 2006, 22 Jun 2026 and 29 Jul 2026). Daily closes from Nasdaq’s index history, price index in US dollars; own calculation as of 23 October 2026.
| Year | SOX | Nasdaq-100 |
|---|---|---|
| 2007 | −12.8% | +18.7% |
| 2008 | −48.0% | −41.9% |
| 2022 | −35.8% | −33.0% |
| 2023 | +64.9% | +53.8% |
| 2024 | +19.3% | +24.9% |
| 2025 | +42.2% | +20.2% |
| 2026 to 23 Oct | +52.2% | +14.7% |
Calendar-year price change, close to close, price indices without dividends in US dollars. Calculated from Nasdaq’s daily series as of 23 October 2026; own calculation.
Volatility is what separates the SOX from broad indices. Nasdaq’s factsheet gives an annualized volatility of 35.16 percent for the ten years to September 2026 and an average annual price return of 31.20 percent (geometric mean), both for the price index. That return is a look back, not a guide to the future; with swings this large, your position size matters more than usual.
SOX vs Nasdaq-100
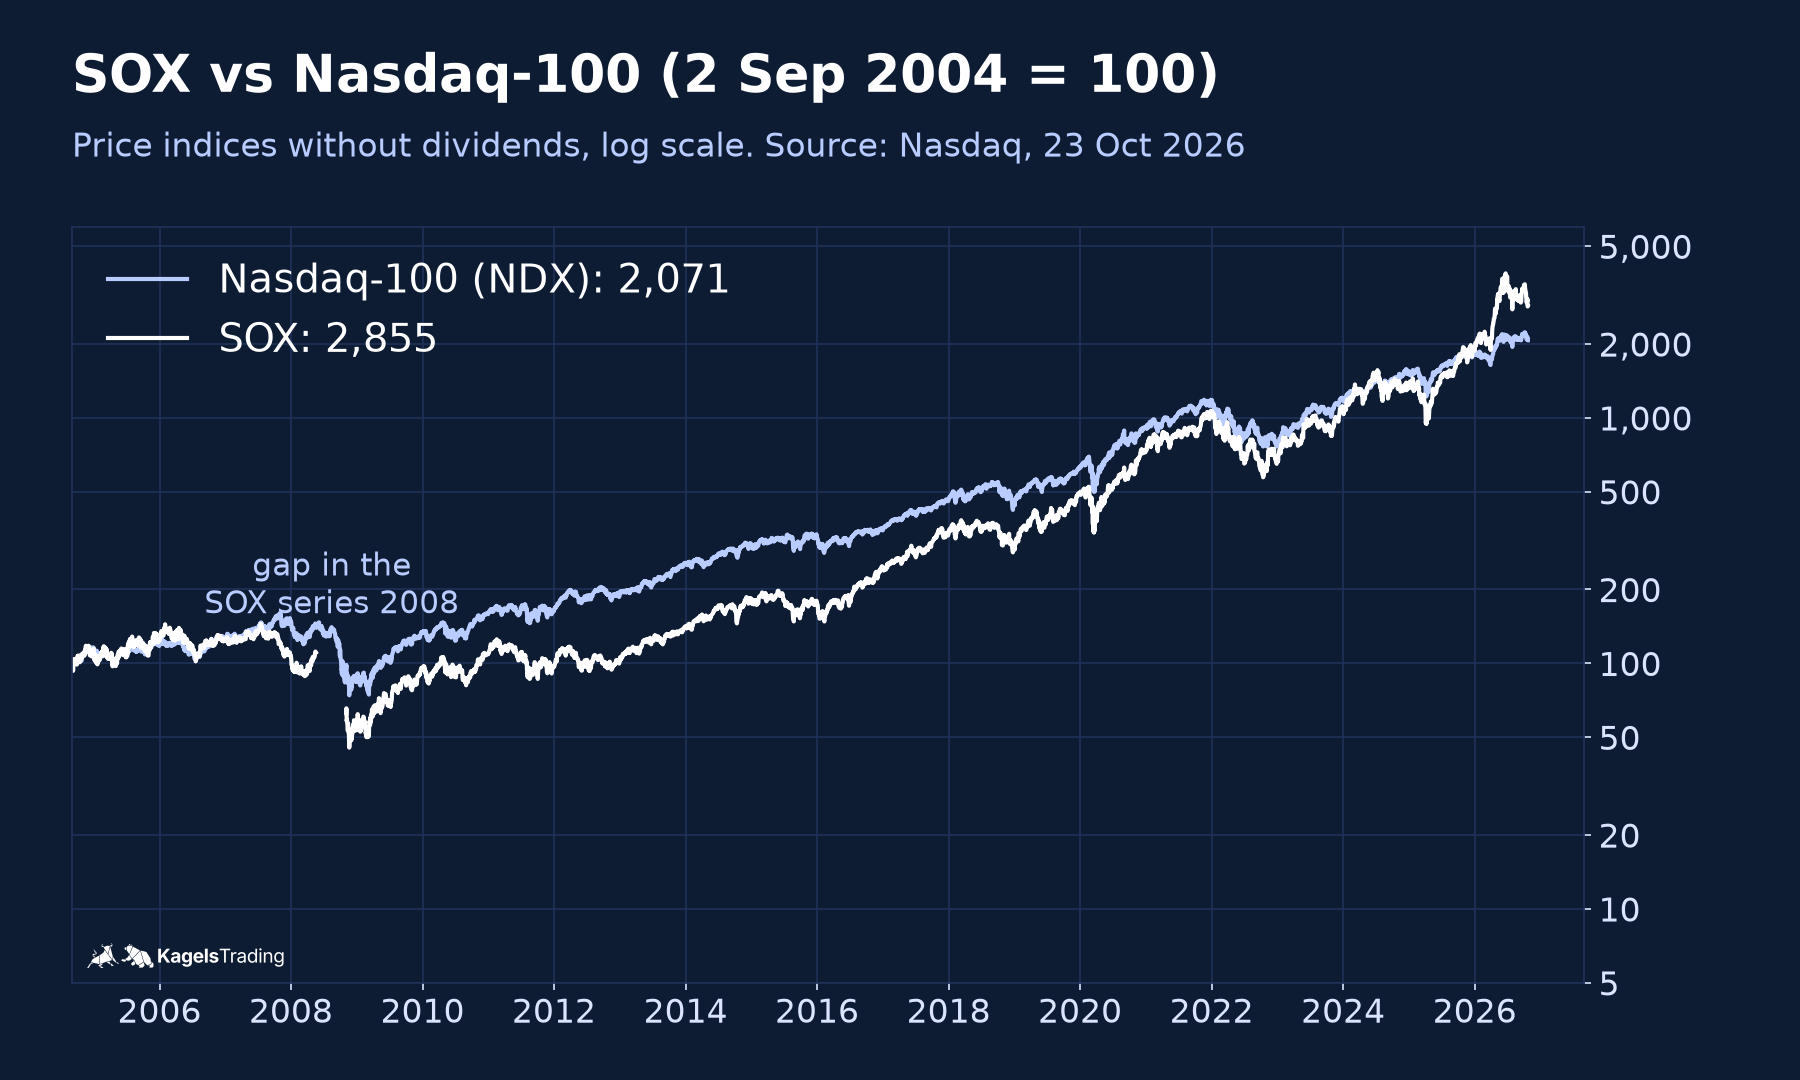
The Nasdaq-100 holds many chip stocks, but also software, retail and healthcare; the SOX is pure semiconductors. Setting both indices to the same start value shows when the chip sector led or lagged the wider technology market. Both lines in the chart start at 100 in September 2004, as price indices without dividends.
 Click to enlarge
Since September 2004 the SOX grew 28.5-fold and the Nasdaq-100 20.7-fold, but along very different paths. Until about 2016 the SOX clearly trailed the Nasdaq-100; it then caught up and only pulled far ahead in 2025 and 2026. For long stretches, the sector bet was not the better one; our sector rotation guide shows the same for monthly switching between whole sectors.
Divide the SOX by the Nasdaq-100 and you get its relative strength. The ratio rises while chip stocks do better than the wider tech market, as explained in our guide to relative strength. In 2007, the SOX fell 12.8 percent while the Nasdaq-100 still gained 18.7 percent; a year later both collapsed.
Relative strength is not an early warning system. The 2007 example was chosen in hindsight, and there were also phases in which the SOX lagged and the wider market simply kept rising. The comparison shows which group is doing better now; it does not predict when a trend ends. Our Nasdaq-100 forecast covers the tech index itself.
What moves the semiconductor index?
Semiconductors are a cyclical industry, and the SOX reflects that cycle almost unfiltered. Four forces set the pace. None can be read from the chart alone; they show up first in the quarterly results and outlooks of the largest members. Data center suppliers such as Credo, Astera Labs and Coherent are compared in our guide to AI infrastructure stocks.
- Inventory cycle: when customers stock up, sales and prices rise fast; when inventories are full, demand can drop abruptly. Memory chips react most strongly.
- Capital spending: new fabs cost billions. When many makers expand at once, equipment suppliers benefit first, and overcapacity can follow.
- End markets: data centers, phones, PCs, cars and industry buy at different times, so a weak market hits members very differently.
- Politics and trade: export controls, tariffs and dependence on a few production sites, above all in Taiwan, can move prices overnight.
Artificial intelligence is a strong driver, but not the only one. Demand for computing power in AI data centers carried the largest SOX weights, led by Nvidia. The decline in July 2026 shows that even a strong theme is no price guarantee. Earnings from Nvidia, Broadcom and Micron, together almost 30 percent of the index, move the whole SOX, and so do the rebalancing dates in March, June, September and December.
How to invest in the SOX
You cannot buy the SOX directly, only products that track it. Many semiconductor ETFs have similar names and still follow different indices. The list shows which index the best-known funds tracked according to their providers on 25 October 2026.
- Invesco SOXQ (US): PHLX Semiconductor Sector Index, so it tracks the SOX.
- iShares SOXX (US): NYSE Semiconductor Index, not the SOX.
- VanEck SMH (US): MVIS US Listed Semiconductor 25 Index, not the SOX.
- VanEck Semiconductor UCITS ETF (Europe): MarketVector US Listed Semiconductor 10% Capped Screened Index, not the SOX.
Index according to each provider’s product page, read on 25 October 2026. The first three are US-domiciled funds; the VanEck Semiconductor UCITS ETF has the ISIN IE00BMC38736.
The best-known “SOX fund” no longer tracks the SOX. The iShares ETF with the symbol SOXX used to be called iShares PHLX Semiconductor ETF, and some quote pages still show that name. According to the iShares product page, its benchmark is now the NYSE Semiconductor Index. Among the large US funds, the Invesco PHLX Semiconductor ETF with the symbol SOXQ is based on the SOX.
Outside the US, access depends on local rules. In the European Union, retail brokers generally cannot offer a fund to retail investors without the key information document that the PRIIPs regulation requires (Articles 5 and 13), and US-domiciled ETFs usually do not provide one. European UCITS semiconductor ETFs exist, but they track their own indices, such as the VanEck Semiconductor UCITS ETF, whose US counterpart SMH uses yet another index. Nasdaq’s product list for the SOX named no European fund on 25 October 2026.
These funds all provide semiconductor exposure, but their holdings, concentration and returns can differ. The indices overlap but differ in the number of members, the caps and the treatment of foreign companies. Before you choose a fund, check its index and largest positions in the factsheet, not just its name, and check the costs on the provider’s page. If you prefer single companies, our semiconductor stocks guide compares the largest chip designers, manufacturers and equipment makers.
Strengths and limits of the SOX index
The SOX is a good benchmark for the chip sector, but a risky place for money that must not swing. It bundles the main chip stocks in one number, its rules are public with clear caps and fixed review dates, and it covers designers, makers and equipment suppliers. Compared with the Nasdaq-100, it shows whether the chip sector leads or lags.
Its limits are just as clear. With 30 members and almost 59 percent in the top ten it is highly concentrated, and it fell more than 40 percent twice since 2004. It includes only US-listed stocks, counts only deposited shares for ADRs, and a comparison with other indices describes the past, not a reliable signal for tomorrow.
SOX index: my conclusion
The SOX is the thermometer of the chip sector. It measures the 30 largest US-listed semiconductor companies, weighted by market value with fixed caps, and it swings far more than broad indices. If you trade Nvidia, Broadcom or Micron, keep it in view as the sector picture.
Its strength is also its risk. Concentration on a few heavyweights in a cyclical industry brought high returns in good years and declines of almost 70 percent in bad ones. When you invest, the index is in the small print: not every fund with “semiconductor” in its name follows the SOX, so check the factsheet first.
Frequently asked questions about the SOX index
What is the SOX index?
The SOX index, also called the Philadelphia Semiconductor Index, is a stock index of semiconductor companies. It tracks the price of the 30 largest semiconductor companies listed on US exchanges and is calculated by Nasdaq. It started on 1 December 1993 at the Philadelphia Stock Exchange.
What stocks are in the SOX?
The SOX holds 30 companies from chip design, chip making and equipment. On 30 September 2026 the largest were Nvidia with 11.35 percent, Broadcom with 8.67 and Micron with 8.13 percent. Nasdaq publishes the full and current list.
How is the SOX weighted?
By market value, with caps. At each quarterly rebalancing, the three largest members may weigh at most 12, 10 and 8 percent, all others at most 4 percent. Nasdaq reselects the members once a year in September.
What is SOXX?
SOXX is the symbol of a semiconductor ETF from iShares. It used to be called iShares PHLX Semiconductor ETF, but according to the provider it now tracks the NYSE Semiconductor Index, not the SOX. A US ETF based on the SOX is Invesco’s SOXQ.
Why is the SOX so volatile?
Because the semiconductor industry is cyclical and the index is concentrated on a few heavyweights. Inventory cycles, investment waves and export rules feed straight into prices. Since 2004 the SOX fell more than 28 percent six times, and its ten-year volatility was about 35 percent.
This English edition is based on our German edition on kagels-trading.de and has been adapted for international readers.
More Markets and Brokers guides
- Open your first account
What Is a Brokerage Account? A US Beginner's Guide
How to open and fund a US brokerage account, cash vs margin, what it costs and what SIPC and FDIC really cover.
- Know what trading really costs
Trading Costs: Every Fee You Pay and How to Cut It
Spread, commissions, SEC and FINRA fees, market data, margin interest and tax, with yearly totals for three trading styles.
- Choose a broker
Interactive Brokers Review 2026: Fees and Platforms
Fees, platforms, investor protection and real futures commissions from a client since 1996.
- Choose an options broker
tastytrade Review 2026: Options Fees, Margin and Safety
tastytrade from an options trader's own account and its October 2026 fee schedule: fees, the 6.75% margin rate, safety and FINRA fines.
- Check an offshore broker
PU Prime Review 2026: FCA Warning, Licences and Costs
Which PU Prime company you contract with, what the FCA warning means, and what 1:1000 leverage and the deposit bonus do to your account.
- Check an EU CFD broker
Tradeview Review 2026: Tradeview Europe, MFSA and Costs
What the Malta licence of Tradeview Europe covers, how it differs from the Cayman company, and what the three MetaTrader 5 accounts cost.
- Check ZuluTrade
ZuluTrade Review 2026: Costs, Regulation and US Status
Who runs the copy trading platform, what it costs through your broker, why the US was missing from its sign-up form and what the CFTC fined its US company for.
- Check CopyX
CopyX Review 2026: Is TAG Markets Copy Trading Legit?
Who runs the TAG Markets copy trading platform, which regulators warn about it, why US residents are excluded and how fast the 12x Amplify account eats your deposit.
- Choose a US forex broker
OANDA Review 2026: Fees, TradingView and US Rules
OANDA from its own pages and NFA records: spreads and fees, TradingView and the demo, FIFO and three penalties.
- Check a commission-free app broker
Webull Review 2026: Fees, Margin Rates and Safety
Webull from its own fee schedule and FINRA records: what is free, margin rates and Premium, overnight trading, crypto and three fines.
- Understand your price
Market Makers: Who Sets Your Price and How They Profit
How market makers earn on the spread, who sets prices at German trading venues and what the EU ban on payment for order flow changed.
- Size up a bull market
Bull Market: How Long It Lasts and How to Spot the End
When a rise becomes a bull market, how long the 27 completed S&P 500 bull markets since 1928 lasted and gained, and where the current one stands.
- Read bond market stress
MOVE Index: The VIX of the Bond Market, Explained
What the MOVE index measures, which readings signal stress, how it differs from the VIX and where its limits are.
- Read stock market fear
VIX Index: What the Fear Gauge Measures and Normal Levels
What the VIX measures, which levels have been normal since 1990, how closely it tracks the S&P 500 and how VIX futures, options and ETPs work.
- Read the risk mood
Risk-On vs Risk-Off: Meaning, Assets and Indicators
What risk-on and risk-off mean, which assets rise and fall in each mode, five market shocks since 2008 and the VIX, DXY and AUD/JPY signals.
- Read market sentiment
Fear and Greed Index: How It Works, Tested Since 2021
How CNN builds its Fear and Greed Index from seven measures, what the zones mean and how the S&P 500 moved after readings below 20.
- Size up a bear market
Bear Market: How Long It Lasts and How to Spot One
When a decline becomes a bear market, how long the 27 S&P 500 bear markets since 1928 lasted, how long the recovery took and why Bitcoin had three since 2025.
- Trade an index CFD
Index CFDs at Interactive Brokers: Symbols, Costs and Trading
All 13 IBKR index CFDs, margin, stop and close-out worked through for IBDE40, financing, UK hours and the TradingView limit.
- Size an index future
Micro Futures: MES vs MNQ, Tick Values and Risk
MES and MNQ tick values, a worked sizing example from the stop with costs and slippage, and why margin is not your risk.
- Choose between futures and CFDs
Futures vs CFDs: Regulation, Order Execution and Costs
Who your counterparty is, EU, UK and US rules, how stops are triggered on CME and at CFD providers, and booked costs in a DAX example.
- Read the futures curve
Contango vs Backwardation: Futures Curves Explained
What contango and backwardation mean, what rolling does to a position in each case, and real gold, oil and gas curves from 28 October 2026.
- Understand the spot market
Spot Market Explained: Definition and Settlement Times
What a spot market is, why two days is a minimum and not a limit, and when stocks settle at T+1 in the US, EU, UK and Switzerland.
- Choose a silver future
Silver Futures: SI vs Micro Silver vs 100-oz SIC
SI, Micro Silver and the 100-ounce SIC compared by tick value, risk per contract, margin and December 2026 deadlines.
- Read the biotech sector
Nasdaq Biotechnology Index: Holdings, Weighting and Risks
What the NBI holds, how Nasdaq caps the weights, its long declines since 2003 against the Nasdaq-100 and which ETFs really track it.
- Read the transport sector
Dow Jones Transportation Average: Stocks and Dow Theory
The 20 stocks in the Dow transport index, why the share price sets their weight, declines since 1992 and what Dow Theory can and cannot tell you.
- Read the French market
CAC 40 Index Explained: All 40 Stocks, Weights and Trading Hours
All 40 CAC 40 stocks, how Euronext caps the weights at 15 percent, trading hours in Eastern Time and how it differs from the DAX.
- Research stocks
InvestingPro Review: Screener, ProPicks AI and WarrenAI
What the InvestingPro screener, ProPicks AI and WarrenAI do, what Pro and Pro+ cost and who needs which plan.
- Judge a stock-picking newsletter
Motley Fool Stock Advisor Review: Cost and Track Record
What Motley Fool Stock Advisor costs after the first year, how the advertised return is calculated, refund and renewal terms, and who it suits.
- Use the free news portal
Investing.com Review: Free Tools, Data and Limitations
What the free Investing.com portal does well, where the quote prices come from and when InvestingPro is worth paying for.
- Find real AI revenue
AI Stocks 2026: How Listed Companies Earn From AI
Which listed companies earn from AI in cloud, software, infrastructure and chips, disclosed AI revenue against hope, plus AI ETFs and risks.
- Compare AI data center suppliers
AI Infrastructure Stocks: 10 Data Center Suppliers Compared
Ten suppliers for power, cooling, servers and optics compared on free cash flow, customer concentration and next dates, with filters and a two-stock comparison.
- Follow an IPO
Anthropic Stock: IPO Date, Valuation and How to Invest
Where the Anthropic IPO stands, how the valuation compares with revenue and how to get exposure before and after the listing.
- Invest in OpenAI before the IPO
OpenAI Stock: Can You Buy It, and Who Owns OpenAI?
Why there is no OpenAI stock yet, who owns OpenAI, where the IPO stands and how much OpenAI you get through Microsoft or SoftBank.
- Understand a stock split
Stock Splits Explained: Forward and Reverse Splits
What forward and reverse splits change and what they do not, the dates that matter, what happens to options and the $1 listing rule.
- Analyze a company
Fundamental Analysis: 12 Ratios, a Worked Example, 5 Steps
Twelve ratios with formulas and rules of thumb, worked through Microsoft's 2026 annual report, a five-step process and the fundamentals of forex, commodities and crypto.
- Value a stock
Value Investing: Intrinsic Value, Margin of Safety, Traps
Intrinsic value against price, a worked DCF with a sensitivity table, Coca-Cola as a real example, the value premium since 1926 and value traps.
- Value a new listing
SpaceX Stock (SPCX): Valuation, Risks and How to Buy
How to buy SpaceX stock, what the company is worth after the IPO and which risks the lock-up calendar brings.