
IBKR Exposure Fee: What It Is and How to Reduce It


Contents
- The IBKR Exposure Fee in 30 seconds
- What is the IBKR Exposure Fee?
- How does Interactive Brokers calculate the Exposure Fee?
- When is the Exposure Fee charged, and why on weekends?
- My example: an Exposure Fee of 1.12 euros per day
- Where do I find the Exposure Fee in the Client Portal?
- Which positions trigger the Exposure Fee?
- How do you reduce the Exposure Fee?
- IBKR Exposure Fee: my conclusion
- Frequently asked questions about the IBKR Exposure Fee
- About the author
On 13 November 2026 Interactive Brokers told me that my account would pay a daily Exposure Fee, and that it would also be charged for Saturday and Sunday. The amount was small. The message behind it was not: the broker had put my account through its stress tests and found a scenario in which the loss would be larger than my capital.
I have been an Interactive Brokers client since 1996 and trade mainly futures there. In this guide I use my own notice to explain what the Exposure Fee is, when it is charged, where you find it in the Client Portal and how you reduce it. This article follows our editorial policy and is for education, not investment advice.
The IBKR Exposure Fee in 30 seconds
- What it is: a daily fee for accounts with high risk exposure, charged on top of normal margin.
- How it arises: IBKR runs thousands of price scenarios on the whole portfolio every day. If the loss in a scenario would exceed the account’s equity, a fee can be charged, even when the margin is met.
- When it is charged: on all calendar days. Weekends and holidays use the exposure of the last trading day, and the fee is deducted at the end of the next trading day.
- How high it is: IBKR publishes no fixed rate. The calculation is a proprietary algorithm. In my case it was 1.12 euros per day, so 4.48 euros for four days.
- How to reduce it: reduce the risk or add capital. IBKR names both, plus diversification, hedging and closing short options.
What is the IBKR Exposure Fee?
The Exposure Fee is a daily fee that Interactive Brokers may charge to accounts where a stress test of the whole portfolio shows a possible loss larger than the account’s equity.
The key idea is the uncovered potential loss. It is the part of a scenario loss that the equity in the account could no longer cover. In a real crash the broker would have to carry that part first, before collecting it from you.
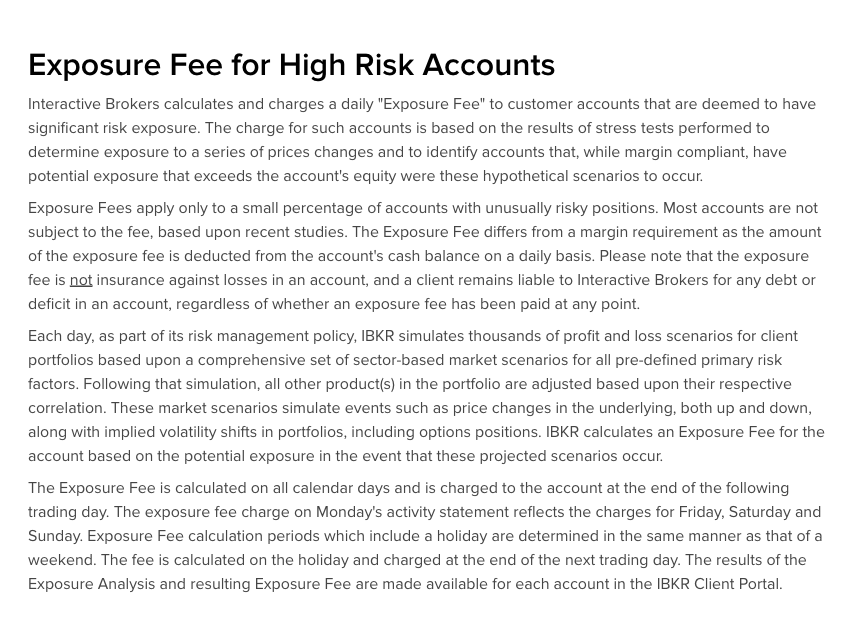
The fee is related to margin only indirectly. An account can meet every margin requirement and still pay an Exposure Fee. Margin blocks capital as collateral, while the Exposure Fee is deducted from the cash balance every day.
That money is gone. The screenshot below shows how Interactive Brokers describes the fee itself on its margin page.
 Click to enlarge
According to IBKR, the fee affects only a small share of accounts with unusually risky positions. If you only hold stocks and ETFs without borrowing, you will hardly ever see it. If you trade futures, sell short or write options, you should know it. How IBKR charges otherwise is covered in our Interactive Brokers review.
| Margin | Exposure Fee | |
|---|---|---|
| What it is | blocked collateral | a fee that is charged |
| Based on | product, account, portfolio rules | a stress test of the portfolio |
| The money | stays in the account | is gone |
| When | during trading | daily, weekends too |
| Who pays | every margin account | high-risk accounts only |
How does Interactive Brokers calculate the Exposure Fee?
Interactive Brokers simulates thousands of profit and loss scenarios for the whole portfolio every day and charges the fee based on the exposure if those scenarios occur.
The scenarios are built by sector and primary risk factor. They move the underlying up and down and shift the implied volatility of options. All other positions are then adjusted through their correlation, so an index future lands in the same scenario as stocks from the same market.
IBKR does not publish a fixed rate. The Exposure Fee section of its margin page says that IBKR calculates the fee at its discretion, with a proprietary algorithm that may change without notice. If you find a formula with a percentage online, it is an estimate, not a rule of the broker.
According to IBKR, the fee applies only when end-of-day uncovered risk exceeds specified levels. IBKR does not charge fees below US$1. When an account is caught for the first time, IBKR first sends a notice and gives one week to adjust positions or equity.
What IBKR does publish are the stress ranges for each risk factor. It tests the US equity market, represented by the S&P 500, between minus 30 and plus 20 percent. Crude oil runs from minus 33 to plus 63 percent and sugar from minus 51 to plus 47 percent. The full table is in IBKR’s Exposure Fee calculations overview.
Three more points in the description are fixed. They concern the whole portfolio, daily changes and the overnight fee:
- The fee is calculated for all assets in the entire portfolio, not for one position.
- It can change every day: with prices, with your positions and with IBKR’s formulas.
- If your account would also pay an overnight position (inventory) fee, IBKR charges only the greater of the two.
It is just as important what the fee is not. It is not insurance. If you have paid it, you are still liable for every loss in the account, and paid fees are not offset against a later deficit.
When is the Exposure Fee charged, and why on weekends?
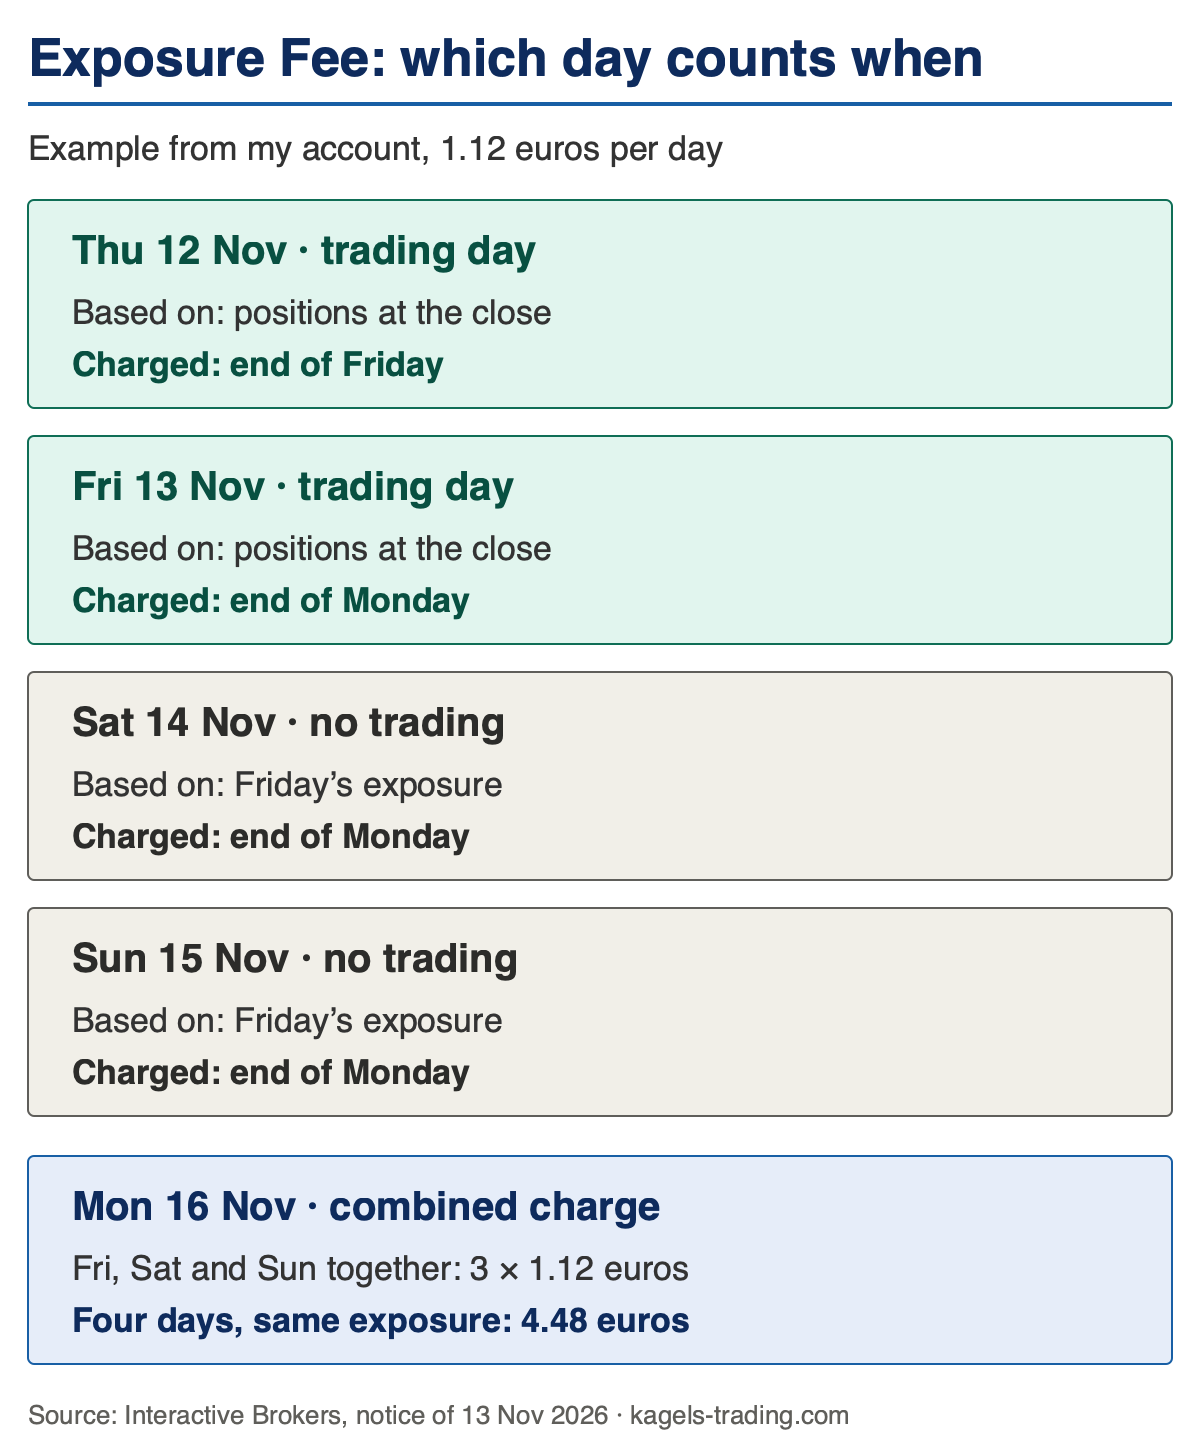
The Exposure Fee is calculated on all calendar days, including weekends and holidays, and charged at the end of the following trading day.
For Saturday, Sunday and holidays IBKR uses the exposure of the last trading day before. On a weekend you can change nothing on most exchanges, but the risk is still in the account. That is why those days cost money too.
For your statement this means: the fee for Friday, Saturday and Sunday shows up together on Monday’s activity statement. A holiday is handled the same way: the fee is calculated on the holiday and charged at the end of the next trading day.
| Day | Basis of the calculation | Charged |
|---|---|---|
| Thursday | positions at Thursday’s close | end of Friday |
| Friday | positions at Friday’s close | end of Monday |
| Saturday | Friday’s exposure | end of Monday |
| Sunday | Friday’s exposure | end of Monday |
The graphic below shows the same rule with my example from 12 to 16 November. It covers four calendar days and two charging dates.
 Click to enlarge
If you hold a risky position over the weekend, you pay the fee three times. This is exactly what the advance notice before weekends and holidays warns about. It arrives in the Message Center while you can still change your positions.
My example: an Exposure Fee of 1.12 euros per day
On Friday, 13 November 2026, my Client Portal Message Center held an Exposure Fee notice for weekends and holidays. The text came in German and English. I show my account number only shortened, as U****1859.
The English version says that the account “was assessed an Exposure Fee of 1.12 EUR for positions as of November 12, 2026 close”. Using the most current information and assuming no changes to the uncovered exposure, IBKR told me to expect the same fee for each of the following non-trading days. The German version speaks of the following three days instead.
So the notice does not say exactly which days it means. I therefore do my own calculation under IBKR’s billing rule: Thursday to Sunday, four days at 1.12 euros, 4.48 euros in total if the exposure stays the same.
| Detail | Value |
|---|---|
| Notice | 13 Nov 2026, weekend and holiday notice |
| Fee for 12 Nov 2026 | 1.12 euros |
| Per the notice | same fee for each following non-trading day |
| My calculation, Thu to Sun, same exposure | 4.48 euros |
| Annualised | 408.80 euros, about 0.4% of the account |
| Account value on 16 Nov 2026 | about 101,600 euros, margin met |
The annual figure is only a worked example: 1.12 euros times 365 days, compared with the account value on 16 November. It is what this exact risk would cost if I held it for a whole year. I do not, but the number shows that a small daily fee adds up on a permanent position.
Which position triggered it?
At the close on 12 November my account held one single position: three E-mini S&P 500 December 2026 futures, short. I had opened them on the evening of 11 November and did not trade again until the following Monday. On 16 November their combined notional exposure was about US$1.12 million. This describes the size of the position, not its profit or loss.
So the three ES shorts were the trigger, because nothing else was in the account. Their notional exposure is a multiple of my account equity. For scale: at the top of IBKR’s range for US equities, plus 20 percent, US$1.12 million of short exposure would lose about US$224,000, more than my whole account.
The notice itself names no position, only the amount. The split by sector only appears in the Exposure Fee Calculation Report described below.
One more detail is worth noting: on 16 November, with the same position, the margin was met and the account had excess liquidity. This is exactly the case IBKR describes. An account can follow every margin rule and still go negative in a stress test.
How an index future is built, and why one contract carries so much exposure, is explained in our guide to micro futures. I show the position here to explain the fee, not as a recommendation.
Where do I find the Exposure Fee in the Client Portal?
A charged Exposure Fee appears in the Fees section of the daily activity statement, and the breakdown is in the Exposure Fee Calculation Report under Performance & Reports in the Client Portal.
There are four places where you see the fee or check it in advance. Two show past charges, two help you plan before the close:
- Message Center: this is where the advance notice before weekends and holidays arrives, like mine of 13 November.
- Activity statement: if a fee was charged for the previous day, the amount is in the Fees section of the daily statement, according to the IBKR FAQ on statements.
- Exposure Fee Calculation Report: in the Client Portal, open Performance & Reports, then Other Reports, select Exposure Fee Calculation, set the date and click Run. It shows the average exposure and the fee for each sector.
- Order preview in TWS: right-click the order line to open the preview with the link Check Exposure Fee Impact. It shows how the order would change the projected fee before you send it, as the IBKR guide to the order preview explains.
According to IBKR, the order preview check is only available for accounts charged an Exposure Fee in the last 30 days. It is also a projection. IBKR calculates the real fee with prices and implied volatilities after the close, so it can differ.
Which positions trigger the Exposure Fee?
Typical triggers are large, unhedged single positions relative to account equity, above all short options and leveraged futures positions.
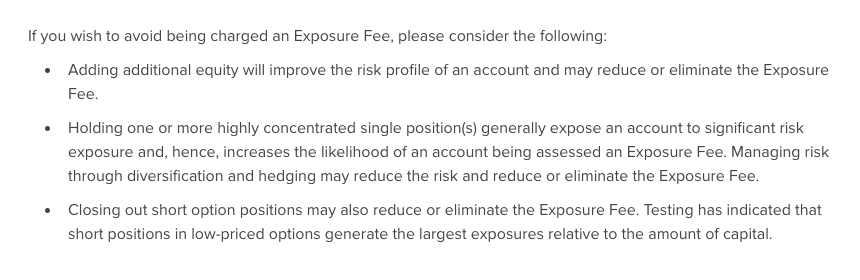
IBKR names two groups explicitly. The first is highly concentrated single positions, which according to IBKR raise the likelihood of a fee. The second is short options, especially cheap ones: short positions in low-priced options generate the largest exposures relative to capital.
IBKR does not name futures separately. A future with high notional exposure and little capital behind it is exactly such a concentrated position, though. With a short position, the loss on the upside is not limited. Our guide to short selling covers the basics of short positions.
- Short futures with high notional exposure, for example on stock indices.
- Uncovered short options, especially cheap ones far out of the money.
- Concentrated stock positions on margin, for example one stock with a large loan.
- Several positions that move together, such as an index future and single stocks from the same market.
Small long stock positions without a loan practically never trigger the fee. Their loss is limited to the purchase price. What happens when the margin runs short is explained in our guide to the margin call.
How do you reduce the Exposure Fee?
In its notice, Interactive Brokers names two ways to reduce or avoid the Exposure Fee: reduce your exposure or add capital beforehand.
Both work on the same gap. The fee depends on the distance between the scenario loss and your equity. If the loss gets smaller or the equity bigger, the gap shrinks, and so does the fee. The screenshot below shows IBKR’s own list of steps.
 Click to enlarge
Timing matters. For the weekend IBKR uses the exposure of Friday evening. If you want to avoid the fee for three days, you have to act before Friday’s close. That is what the advance notice is for.
Before you change anything, test it in Risk Navigator in TWS. There you build a what-if portfolio, change positions and open the Exposure Fee report to see the projected fee by risk factor.
Paying the fee does not protect you. Three points matter for liability, losses and margin:
- Not insurance: you remain liable for every deficit in the account.
- Not a credit: paid fees are not offset against later losses.
- Not harmless when the account is tight: if the deduction causes a margin deficiency, IBKR can liquidate positions.
In my case the fee was 1.12 euros per day. Whether you pay such a fee or adjust the position is a question for your own risk management, and our guide to risk management shows how to set that up.
IBKR Exposure Fee: my conclusion
The Exposure Fee is less a fee than a message. Interactive Brokers tells you that your portfolio could lose more in a stress scenario than there is in the account. The amount is often small. The information behind it matters more.
If you hold futures or short options, know the fee, read the advance notice and decide before the weekend. How futures and CFDs differ, including the risk of loss, is explained in our guide to futures vs CFDs.
Frequently asked questions about the IBKR Exposure Fee
What does the Exposure Fee at Interactive Brokers mean?
It is a daily fee for accounts with high risk exposure. Interactive Brokers may charge it when a stress test of the whole portfolio shows a possible loss larger than the account’s equity and the uncovered risk exceeds specified levels. It is deducted from cash and is not a margin requirement.
Why am I charged the Exposure Fee on weekends?
Interactive Brokers calculates the Exposure Fee on all calendar days. Saturday, Sunday and holidays use the exposure of the last trading day. The fees for Friday, Saturday and Sunday appear together on Monday’s activity statement.
How much is the Exposure Fee?
Interactive Brokers publishes no fixed rate. The fee comes from a proprietary algorithm and can change daily, and IBKR does not charge fees below US$1. In my account it was 1.12 euros per day for 12 November 2026, and 4.48 euros for four days with unchanged exposure.
Where can I see the Exposure Fee in my account?
A charged fee appears in the Fees section of the daily activity statement. The breakdown by sector is in the Exposure Fee Calculation Report in the Client Portal under Performance & Reports, then Other Reports.
How can I avoid the Exposure Fee?
Interactive Brokers names two ways: reduce the exposure or add capital beforehand. That includes smaller positions, diversification and hedging, and closing short options. For the weekend, the change has to happen before Friday’s close.
Is the Exposure Fee insurance against losses?
No, Interactive Brokers states clearly that the Exposure Fee is not insurance. You remain liable for every deficit in the account, and paid fees are not offset against later losses.
This English edition is based on our German edition on kagels-trading.de and has been adapted for international readers.
More Markets and Brokers guides
- Open your first account
What Is a Brokerage Account? A US Beginner's Guide
How to open and fund a US brokerage account, cash vs margin, what it costs and what SIPC and FDIC really cover.
- Know what trading really costs
Trading Costs: Every Fee You Pay and How to Cut It
Spread, commissions, SEC and FINRA fees, market data, margin interest and tax, with yearly totals for three trading styles.
- Choose a broker
Interactive Brokers Review 2026: Fees and Platforms
Fees, platforms, investor protection and real futures commissions from a client since 1996.
- Choose an options broker
tastytrade Review 2026: Options Fees, Margin and Safety
tastytrade from an options trader's own account and its October 2026 fee schedule: fees, the 6.75% margin rate, safety and FINRA fines.
- Check an offshore broker
PU Prime Review 2026: FCA Warning, Licences and Costs
Which PU Prime company you contract with, what the FCA warning means, and what 1:1000 leverage and the deposit bonus do to your account.
- Check an EU CFD broker
Tradeview Review 2026: Tradeview Europe, MFSA and Costs
What the Malta licence of Tradeview Europe covers, how it differs from the Cayman company, and what the three MetaTrader 5 accounts cost.
- Check ZuluTrade
ZuluTrade Review 2026: Costs, Regulation and US Status
Who runs the copy trading platform, what it costs through your broker, why the US was missing from its sign-up form and what the CFTC fined its US company for.
- Check CopyX
CopyX Review 2026: Is TAG Markets Copy Trading Legit?
Who runs the TAG Markets copy trading platform, which regulators warn about it, why US residents are excluded and how fast the 12x Amplify account eats your deposit.
- Choose a US forex broker
OANDA Review 2026: Fees, TradingView and US Rules
OANDA from its own pages and NFA records: spreads and fees, TradingView and the demo, FIFO and three penalties.
- Check a commission-free app broker
Webull Review 2026: Fees, Margin Rates and Safety
Webull from its own fee schedule and FINRA records: what is free, margin rates and Premium, overnight trading, crypto and three fines.
- Understand your price
Market Makers: Who Sets Your Price and How They Profit
How market makers earn on the spread, who sets prices at German trading venues and what the EU ban on payment for order flow changed.
- Size up a bull market
Bull Market: How Long It Lasts and How to Spot the End
When a rise becomes a bull market, how long the 27 completed S&P 500 bull markets since 1928 lasted and gained, and where the current one stands.
- Read bond market stress
MOVE Index: The VIX of the Bond Market, Explained
What the MOVE index measures, which readings signal stress, how it differs from the VIX and where its limits are.
- Read stock market fear
VIX Index: What the Fear Gauge Measures and Normal Levels
What the VIX measures, which levels have been normal since 1990, how closely it tracks the S&P 500 and how VIX futures, options and ETPs work.
- Read the risk mood
Risk-On vs Risk-Off: Meaning, Assets and Indicators
What risk-on and risk-off mean, which assets rise and fall in each mode, five market shocks since 2008 and the VIX, DXY and AUD/JPY signals.
- Read market sentiment
Fear and Greed Index: How It Works, Tested Since 2021
How CNN builds its Fear and Greed Index from seven measures, what the zones mean and how the S&P 500 moved after readings below 20.
- Size up a bear market
Bear Market: How Long It Lasts and How to Spot One
When a decline becomes a bear market, how long the 27 S&P 500 bear markets since 1928 lasted, how long the recovery took and why Bitcoin had three since 2025.
- Trade an index CFD
Index CFDs at Interactive Brokers: Symbols, Costs and Trading
All 13 IBKR index CFDs, margin, stop and close-out worked through for IBDE40, financing, UK hours and the TradingView limit.
- Size an index future
Micro Futures: MES vs MNQ, Tick Values and Risk
MES and MNQ tick values, a worked sizing example from the stop with costs and slippage, and why margin is not your risk.
- Choose between futures and CFDs
Futures vs CFDs: Regulation, Order Execution and Costs
Who your counterparty is, EU, UK and US rules, how stops are triggered on CME and at CFD providers, and booked costs in a DAX example.
- Read the futures curve
Contango vs Backwardation: Futures Curves Explained
What contango and backwardation mean, what rolling does to a position in each case, and real gold, oil and gas curves from 28 October 2026.
- Understand the spot market
Spot Market Explained: Definition and Settlement Times
What a spot market is, why two days is a minimum and not a limit, and when stocks settle at T+1 in the US, EU, UK and Switzerland.
- Choose a silver future
Silver Futures: SI vs Micro Silver vs 100-oz SIC
SI, Micro Silver and the 100-ounce SIC compared by tick value, risk per contract, margin and December 2026 deadlines.
- Read the chip sector
SOX Index: Holdings, Weighting and How to Use It
What the SOX holds, how Nasdaq caps the weights, its largest declines since 2004 against the Nasdaq-100 and which ETFs really track it.
- Read the biotech sector
Nasdaq Biotechnology Index: Holdings, Weighting and Risks
What the NBI holds, how Nasdaq caps the weights, its long declines since 2003 against the Nasdaq-100 and which ETFs really track it.
- Read the transport sector
Dow Jones Transportation Average: Stocks and Dow Theory
The 20 stocks in the Dow transport index, why the share price sets their weight, declines since 1992 and what Dow Theory can and cannot tell you.
- Read the French market
CAC 40 Index Explained: All 40 Stocks, Weights and Trading Hours
All 40 CAC 40 stocks, how Euronext caps the weights at 15 percent, trading hours in Eastern Time and how it differs from the DAX.
- Research stocks
InvestingPro Review: Screener, ProPicks AI and WarrenAI
What the InvestingPro screener, ProPicks AI and WarrenAI do, what Pro and Pro+ cost and who needs which plan.
- Judge a stock-picking newsletter
Motley Fool Stock Advisor Review: Cost and Track Record
What Motley Fool Stock Advisor costs after the first year, how the advertised return is calculated, refund and renewal terms, and who it suits.
- Use the free news portal
Investing.com Review: Free Tools, Data and Limitations
What the free Investing.com portal does well, where the quote prices come from and when InvestingPro is worth paying for.
- Find real AI revenue
AI Stocks 2026: How Listed Companies Earn From AI
Which listed companies earn from AI in cloud, software, infrastructure and chips, disclosed AI revenue against hope, plus AI ETFs and risks.
- Compare AI data center suppliers
AI Infrastructure Stocks: 10 Data Center Suppliers Compared
Ten suppliers for power, cooling, servers and optics compared on free cash flow, customer concentration and next dates, with filters and a two-stock comparison.
- Follow an IPO
Anthropic Stock: IPO Date, Valuation and How to Invest
Where the Anthropic IPO stands, how the valuation compares with revenue and how to get exposure before and after the listing.
- Invest in OpenAI before the IPO
OpenAI Stock: Can You Buy It, and Who Owns OpenAI?
Why there is no OpenAI stock yet, who owns OpenAI, where the IPO stands and how much OpenAI you get through Microsoft or SoftBank.
- Understand a stock split
Stock Splits Explained: Forward and Reverse Splits
What forward and reverse splits change and what they do not, the dates that matter, what happens to options and the $1 listing rule.
- Analyze a company
Fundamental Analysis: 12 Ratios, a Worked Example, 5 Steps
Twelve ratios with formulas and rules of thumb, worked through Microsoft's 2026 annual report, a five-step process and the fundamentals of forex, commodities and crypto.
- Value a stock
Value Investing: Intrinsic Value, Margin of Safety, Traps
Intrinsic value against price, a worked DCF with a sensitivity table, Coca-Cola as a real example, the value premium since 1926 and value traps.
- Value a new listing
SpaceX Stock (SPCX): Valuation, Risks and How to Buy
How to buy SpaceX stock, what the company is worth after the IPO and which risks the lock-up calendar brings.