
Dow Jones Transportation Average: Stocks and Dow Theory


Contents
- Dow Jones Transportation Average in 30 seconds
- What is the Dow Jones Transportation Average?
- Which stocks are in the Dow Jones Transportation Average?
- How is the Dow Jones Transportation Average calculated?
- History: from the Railroad Average to the transport index
- How has the Dow Jones Transportation Average performed?
- What does Dow Theory say about the transport index?
- Transports vs. the Dow Jones Industrial Average
- What moves transport stocks and the index?
- Can you invest in the Dow Jones Transportation Average?
- Strengths and limits of the Dow transport index
- Dow Jones Transportation Average: our conclusion
- Frequently asked questions about the Dow Jones Transportation Average
- About the author
In the Dow Jones Transportation Average, Norfolk Southern counts almost five times as much as Uber, even though Uber is worth almost twice as much on the stock market. The reason is price weighting: what matters is the share price, not the size of the company. If you read the transport index, you should know this before you draw conclusions about the economy or the stock market from it.
This guide explains which 20 stocks are in the Dow Jones Transportation Average, how it is calculated and what Dow Theory reads from it. You will see three charts from the index series since 1992, an honest counterexample to Dow Theory and why familiar transport ETFs no longer track it. This article follows our editorial policy and is for education, not investment advice.
Dow Jones Transportation Average in 30 seconds
- A stock index of 20 large US transport companies. S&P Dow Jones Indices calculates it; most quote sites list it under the symbol DJT.
- Weighted by share price, not by market value. On 6 November 2026, Norfolk Southern had the largest weight at 10.3 percent, Uber only 2.2 percent.
- No fixed date for changes to the membership. A committee of S&P and The Wall Street Journal swaps members when needed, most recently on 1 June 2026, when FedEx Freight replaced American Airlines.
- Nine declines of more than 25 percent since 1992. The deepest was 60.9 percent in 2008/09; the record close is 23,933 points from 21 April 2026.
- Dow Theory reads it together with the Dow Jones Industrial Average. If one does not confirm the other, that counts as a warning. It is not a reliable leading indicator, as our counterexample from 2018 to 2020 shows.
What is the Dow Jones Transportation Average?
The Dow Jones Transportation Average is a price-weighted stock index that tracks the share prices of 20 large US companies from the transportation industry. S&P Dow Jones Indices calculates it, and it includes railroads, airlines, parcel carriers, trucking companies, shipping lines and logistics firms.
The index is not a security you can buy; it is a yardstick for the sector. You can only get it through products that track it, or through its single stocks.
The name causes confusion, because two very different things are called a transport index. The Dow Jones Transportation Average measures the share prices of transport companies. There are also freight rate indices such as the Baltic Dry Index, which measure prices for transport services, and economic data such as US rail freight volumes. If the stock index rises, that first means only that investors pay more for these companies. It does not automatically mean that more goods are moving.
Each platform may show the index under a different symbol. The methodology of S&P Dow Jones Indices lists TRAN for Bloomberg and .DJT for Refinitiv; Google and many quote sites use DJT, Yahoo uses ^DJT. The name itself is often shortened to DJTA. Besides the usual price index without dividends, there is a version with dividends reinvested under the symbol DJTTR. On 6 November 2026 the price index closed at 19,774.87 points.
It shares its family and its calculation with the better-known Dow Jones Industrial Average, but no stocks. According to the methodology, the Industrial Average explicitly excludes the transportation industry group, because the transport index covers it. Our Dow Jones forecast covers the large Dow itself.
Which stocks are in the Dow Jones Transportation Average?
The index has exactly 20 members, chosen by a committee and not by a formula. The methodology names only a few fixed rules; the rest is judgment:
- Industry: the stock must be in the S&P Total Market Index and belong to the transportation industry group, GICS code 2030.
- Origin: the company should be incorporated and headquartered in the US, and the largest part of its revenue should come from the US.
- Reputation and interest: a stock is typically added only if the company has an excellent reputation, shows sustained growth and is of interest to many investors.
- Price: because the index is price weighted, the committee looks at the share price. It monitors whether the highest-priced stock costs more than ten times the lowest.
The methodology does not require a particular exchange. Some sources say the index holds companies from the New York Stock Exchange. In fact, several members are listed on Nasdaq, for example CSX, Old Dominion, J.B. Hunt, United Airlines and C.H. Robinson.
| Company | Price | Weight |
|---|---|---|
| Norfolk Southern (NSC) | $319.94 | 10.30% |
| FedEx (FDX) | $308.14 | 9.92% |
| Union Pacific (UNP) | $290.16 | 9.34% |
| Ryder System (R) | $266.39 | 8.58% |
| J.B. Hunt Transport (JBHT) | $217.55 | 7.01% |
| Matson (MATX) | $211.93 | 6.83% |
| Expeditors International (EXPD) | $184.61 | 5.95% |
| Old Dominion Freight Line (ODFL) | $164.92 | 5.31% |
| Landstar System (LSTR) | $143.34 | 4.62% |
| C.H. Robinson (CHRW) | $125.33 | 4.04% |
| FedEx Freight (FDXF) | $123.56 | 3.98% |
| Kirby (KEX) | $121.00 | 3.90% |
| Avis Budget Group (CAR) | $118.83 | 3.83% |
| United Airlines (UAL) | $112.74 | 3.63% |
| UPS (UPS) | $108.30 | 3.49% |
| Delta Air Lines (DAL) | $87.20 | 2.81% |
| Uber Technologies (UBER) | $68.59 | 2.21% |
| CSX (CSX) | $49.12 | 1.58% |
| Southwest Airlines (LUV) | $44.45 | 1.43% |
| Alaska Air Group (ALK) | $38.94 | 1.25% |
All 20 members with their closing price on 6 November 2026. Weight = price divided by the sum of all 20 prices; own calculation. We could not retrieve a freely accessible full list from S&P. We took the list from public overviews and checked it: with exactly these 20 prices, the calculated divisor stays the same within rounding on all 112 trading days from 1 June to 6 November 2026. That is strong evidence for the list but does not replace an official check. The latest changes are confirmed by S&P announcements. Weights change with every price.
The five highest-priced stocks add up to 45 percent, the ten highest-priced to 72 percent. Grouped by main business, the picture on 6 November 2026 is: railroads 21.2 percent, trucking and less-than-truckload carriers 20.9 percent, parcel carriers 13.4 percent, rental and leasing 12.4 percent, shipping 10.7 percent, freight forwarding and logistics 10.0 percent, airlines 9.1 percent and the ride-hailing company Uber 2.2 percent. The groups are our own split by main business, not the official industry classification.
Four airlines together weigh less than Norfolk Southern alone. That is not because of their size but because of their relatively low share prices. If you read the index as a gauge for air travel, you overestimate what it measures. Most of the movement comes from railroads, parcel carriers and trucking companies.
How is the Dow Jones Transportation Average calculated?
A price-weighted index adds up the share prices of its members and divides the sum by a divisor. Each stock counts with its price; the number of shares and the market value of the company play no role.
The divisor is a number the index provider adjusts for stock splits, spin-offs and member changes, so that the index level does not jump because of the event itself.
On 6 November 2026, the 20 prices added up to $3,105.04. Divided by the divisor, that gives the index level of 19,774.87. So the divisor works out at about 0.157, unchanged since the member change on 1 June 2026. S&P publishes the exact figure only in files for clients. That leads to a simple rule of thumb: if one stock rises by one dollar, the index rises by about 6.4 points, no matter which stock it is.
| Same 10% move | Price change | Effect on the index |
|---|---|---|
| Norfolk Southern ($319.94) | +$32.00 | about +204 points, just over 1.0% |
| Uber ($68.59) | +$6.86 | about +44 points, just over 0.2% |
Worked example with the closing prices of 6 November 2026 and the divisor of 0.157 derived from them, all other prices assumed unchanged. Own calculation.
In a market-value index it would be the other way round. On 6 November, Uber was the second-largest member after Union Pacific at about $140 billion; Norfolk Southern, at about $72 billion, was only half as large. In the S&P 500, Uber would therefore have the larger weight; in the Dow transport index it has the smaller one. Neither is an error; the indices measure different things. Our SOX index guide explains a sector index weighted by market value.
A stock split lowers a stock’s weight without anything changing at the company. If a company splits its stock two for one, its price halves. S&P lowers the divisor so the index does not fall on the day of the split. The stock’s weight drops to just over half: Norfolk Southern would go from 10.3 percent to about 5.4 percent, if all other prices stayed the same. The same percentage move of the stock then has only about half the effect on the index. Our guide to stock splits explains how a split works.
That is why low-priced stocks are more likely to drop out. When S&P replaced JetBlue with Uber in February 2024, the provider’s announcement named JetBlue’s low weight of less than half a percent, caused by its low share price, as the trigger. In May 2026, S&P gave the same reason for removing American Airlines. S&P adds that very low-priced stocks have an immaterial impact on a price-weighted index.
In a spin-off, S&P deducts the value of the new company from the parent’s price. That is what the methodology says. When FedEx Freight was spun off on 1 June 2026, FedEx stayed in the index, the new company replaced American Airlines, and the divisor was reset before the open. There is no fixed annual or semi-annual reconstitution as with many other indices. Changes are usually announced one to five days in advance.
History: from the Railroad Average to the transport index
The roots go back to 1884, but the index in its current form does not. In 1884, Charles Dow and Edward Jones began publishing an average of eleven stocks, nine of them railroads. That is how S&P Dow Jones Indices describes it in its review of the Dow. This Railroad Average counts as the first US stock index and is the forerunner of the transport index.
Today’s index series starts on 26 October 1896 at 51.72 points. According to the methodology, that is both the launch date and the base date, five months after the Industrial Average started in May 1896. In 1970 the Railroad Average was renamed the Transportation Average, because airlines and trucking had changed the sector. Saying the index was created in 1884 in its current form mixes up two things.
Since then, the membership has kept adapting to how goods and people move. A pure railroad index became a mix of rail, air, road, sea and logistics. With Uber, a ride-hailing platform without its own fleet joined in 2024; in 2026 FedEx Freight added a pure less-than-truckload carrier. Today S&P Dow Jones Indices runs the index. The selection is made by the Averages Committee, with three representatives of S&P and two of The Wall Street Journal.
How has the Dow Jones Transportation Average performed?
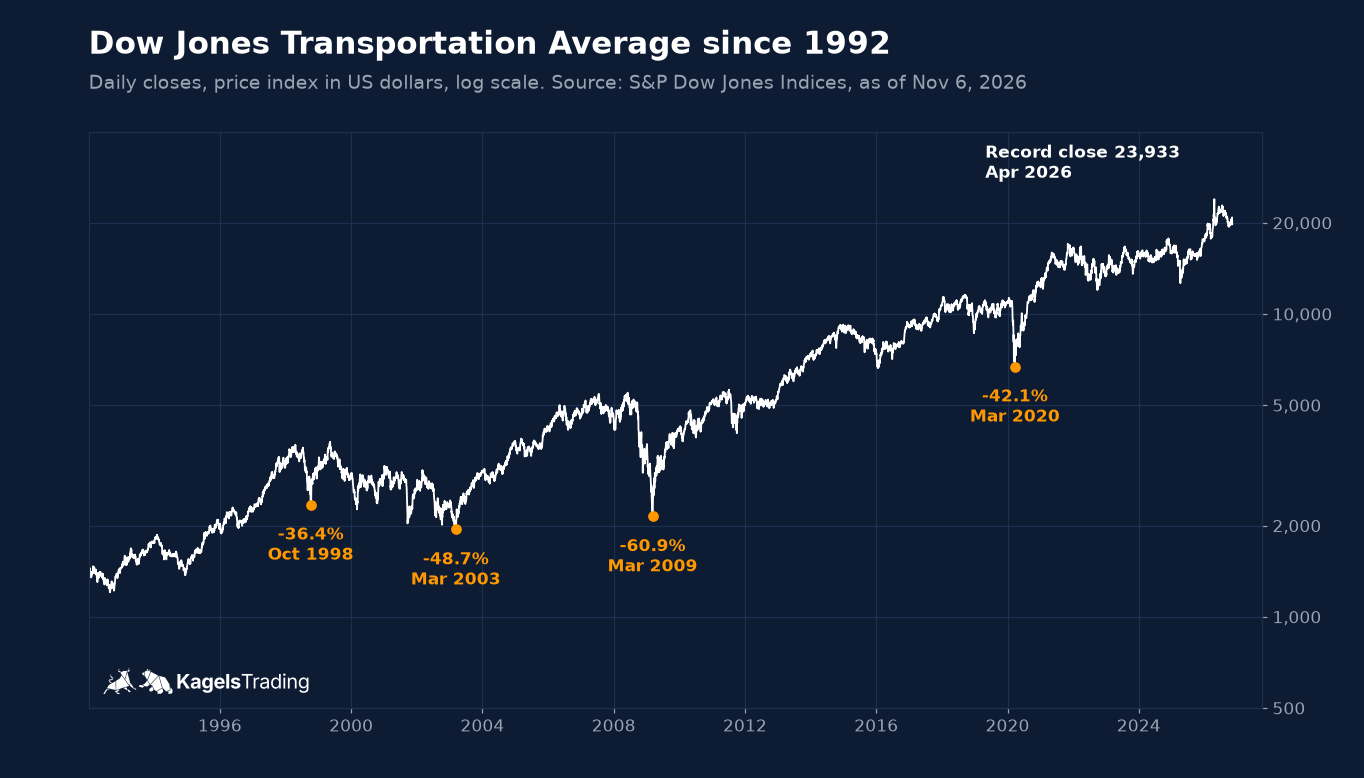
Over the long run the transport index has risen strongly, but with deep slumps. Our daily series starts on 2 January 1992 at 1,342 points. The record close came on 21 April 2026 at 23,933 points; on 6 November the index was just over 17 percent below it. The chart below uses a log scale, on which equal percentage moves look equally large, and marks the four deepest declines in orange.
 Click to enlarge
Source: Data from S&P Dow Jones Indices, chart by Kagels Trading.
The index fell more than 25 percent nine times since 1992. Each decline is measured from the highest close up to then to the lowest close before the next high. That makes the transport index clearly more volatile than the Industrial Average. The S&P factsheet gives an annualized volatility of 21.9 percent for the ten years to October 2026, based on monthly values. By the same method we get 15.2 percent for the Dow Jones Industrial Average.
| High to low | Decline | Backdrop |
|---|---|---|
| 06/2008 to 03/2009 | −60.9% | financial crisis |
| 05/1999 to 03/2003 | −48.7% | dot-com crash, 9/11 |
| 09/2018 to 03/2020 | −42.1% | trade dispute, then the pandemic |
| 04/1998 to 10/1998 | −36.4% | Asian and Russian crises |
| 11/2021 to 09/2022 | −29.6% | interest rate turn |
| 11/2024 to 04/2025 | −28.8% | US tariffs |
The six deepest declines of the Dow Jones Transportation Average since 1992 on a closing basis (exact days: 5 Jun 2008 to 9 Mar 2009, 12 May 1999 to 11 Mar 2003, 14 Sep 2018 to 23 Mar 2020, 16 Apr 1998 to 8 Oct 1998, 2 Nov 2021 to 26 Sep 2022, 25 Nov 2024 to 8 Apr 2025). Three more declines were between 26 and 29 percent (1994, 2011, 2014 to 2016). The backdrop is context, not a proven cause. Own calculation as of 6 November 2026.
| Year | Transports | Industrials |
|---|---|---|
| 2018 | −13.6% | −5.6% |
| 2019 | +18.9% | +22.3% |
| 2020 | +14.7% | +7.2% |
| 2021 | +31.8% | +18.7% |
| 2022 | −18.7% | −8.8% |
| 2023 | +18.7% | +13.7% |
| 2024 | 0.0% | +12.9% |
| 2025 | +9.2% | +13.0% |
| 2026 to 6 Nov | +13.9% | +6.7% |
Calendar-year change, close to close, price indices without dividends in US dollars. The yearly figures for the transport index match the S&P factsheet as of 30 October 2026. Own calculation.
In bad years the transport index usually fell further, in good years it often rose more. That fits an industry with high fixed costs: railroads, fleets and warehouses cost money even when less is shipped. When volumes shrink, profits fall disproportionately; when they grow, profits rise disproportionately. With swings this large, your position size matters.
What does Dow Theory say about the transport index?
Dow Theory is an approach of technical analysis that goes back to Charles Dow. Under it, an uptrend in the stock market counts as confirmed only when both the Industrial and the Transportation Average reach new highs. If only one makes a new high, this is called a divergence or non-confirmation.
The idea is simple: what industry produces also has to be transported. If the prices of manufacturers rise but those of transport companies do not, the expected demand might not come. The classic rule works with closing prices and with the highs and lows of the large moves, not with daily noise.
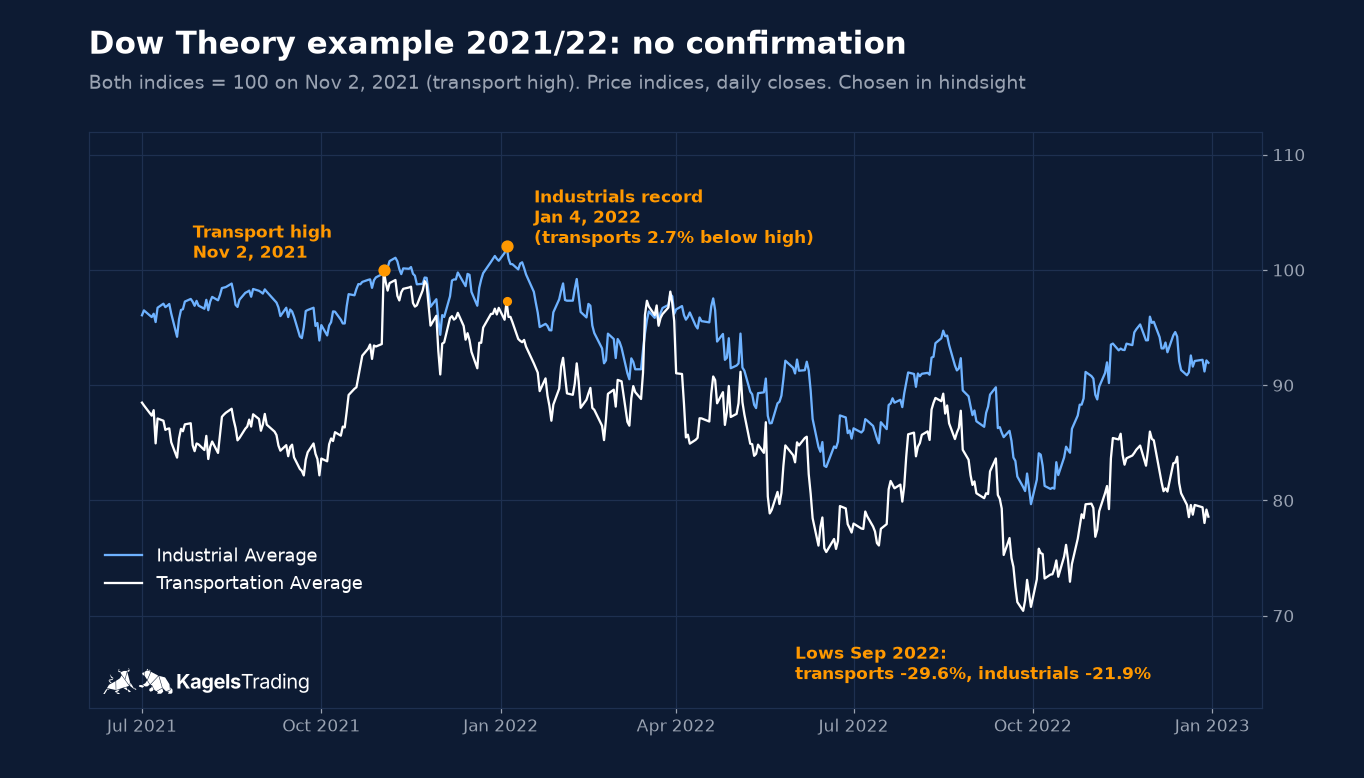
An example from 2021 and 2022 shows what a non-confirmation looks like. The transport index reached its high on 2 November 2021 at 17,039 points. The Industrial Average kept rising and set a record on 4 January 2022 at 36,800 points. On that day the transport index was 2.7 percent below its high and did not confirm. The chart below shows the path. By the end of September 2022 both had fallen, the transport index by 29.6 and the Industrial Average by 21.9 percent.
 Click to enlarge
Source: Data from S&P Dow Jones Indices, chart by Kagels Trading.
To be honest, this example was picked with hindsight. In January 2022 nobody knew whether the transport index would still catch up. The counterexample is only three years earlier. The transport index reached a high on 14 September 2018 at 11,571 points and did not exceed it until 7 October 2020. In that time, the Industrial Average rose from 14 September 2018 to 12 February 2020 by 13 percent to new records. Anyone who sold because of the missing confirmation missed that rise. The fact that a slump did come in March 2020 with the pandemic does not turn the 2018 divergence into a timely sell signal after the fact.
On top of that, the economy has changed. The Industrial Average today holds software, banks and consumer goods, whose revenue barely depends on freight. A divergence between the two indices can therefore simply mean that technology is doing better than transport right now. Dow Theory is a historical framework for reading trends, not a tested trading signal with a known hit rate.
Transports vs. the Dow Jones Industrial Average
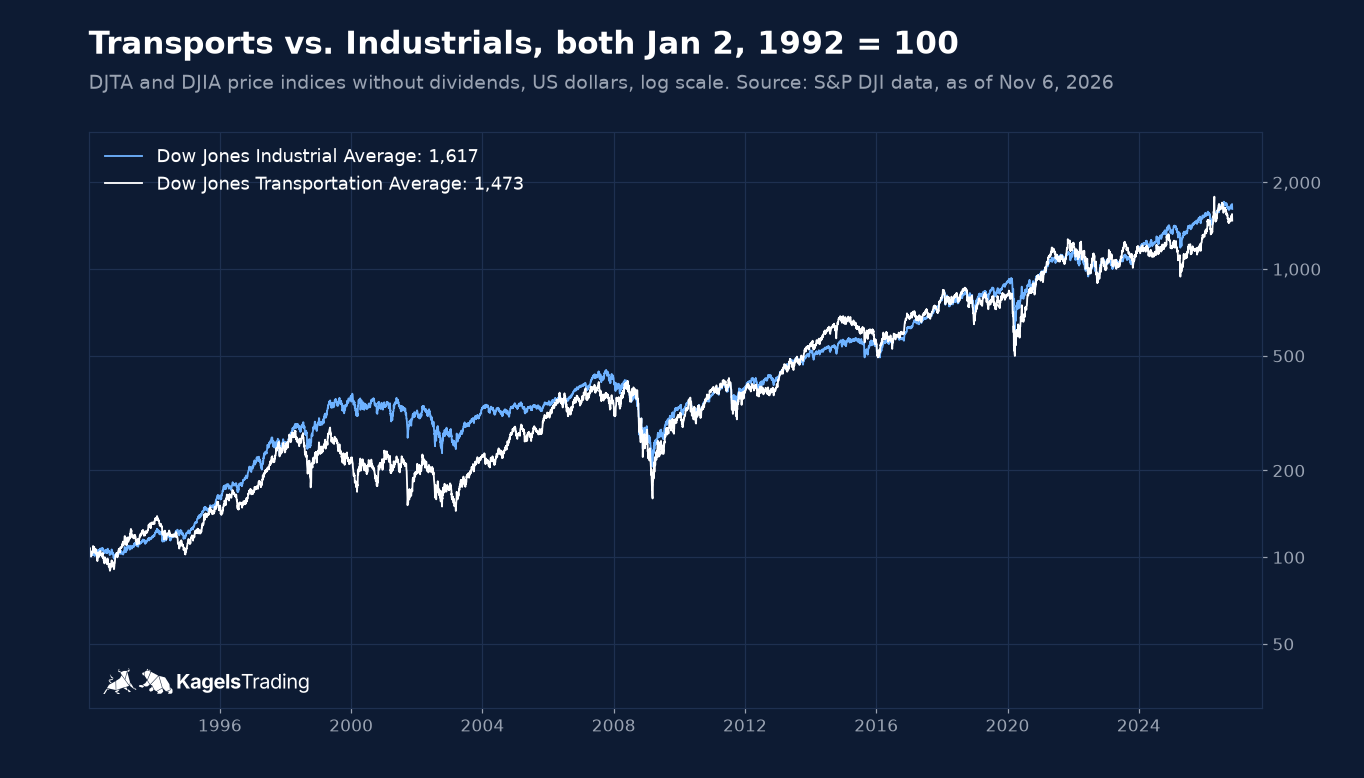
Over almost 35 years, the two indices are closer than their reputation suggests. The chart below sets both to 100 on 2 January 1992. On 6 November 2026 the transport index stands at 1,473 and the Industrial Average at 1,617. That equals about 8.0 against 8.3 percent a year, both without dividends.
 Click to enlarge
Source: Data from S&P Dow Jones Indices, chart by Kagels Trading.
The path there was very different. From 1998 to 2003 the transport index lagged far behind the Industrial Average; from 2004 it caught up and was at times ahead until 2015. In the crises of 2008, 2020 and 2022 it fell further each time. The transport line is more jagged because it holds only 20 stocks from a cyclical industry.
Divide the transport index by the Industrial Average and you get its relative strength. If this line rises, transport stocks are doing better than the broad Dow, as explained in our guide to relative strength. Our sector rotation guide shows how money moves between industries. The line is not a forecast for next month; it shows who leads now, not for how long.
What moves transport stocks and the index?
Transport stocks react to the economy, but not all in the same way. A railroad, an airline and a truck lessor have different cost structures and customers. These forces shape the sector:
- Freight volumes: how much industry and retail ship. This hits railroads, trucking companies and parcel carriers directly.
- Prices: whether higher freight rates or fares stick. In weak phases, carriers fight for volume.
- Fuel: jet fuel and diesel are large costs. Airlines feel this strongly; railroads and trucking companies often pass part of it on to customers through surcharges. There is no simple rule that a high oil price pushes all transport stocks down equally.
- Wages: pilots, train crews and drivers are scarce, and labor contracts move profits.
- Interest rates: aircraft, locomotives and trucks are expensive and often financed. Rising rates make the fleet more expensive.
- Regulation: for railroads, the US Surface Transportation Board rules on mergers and disputes over freight rates; for airlines, the aviation authorities.
A current example of regulation is the planned merger of Union Pacific and Norfolk Southern. Both are in the index and together weigh almost a fifth. The Surface Transportation Board accepted the application in May 2026 and is reviewing it on the merits; a decision is still open. If the merger goes ahead, one of the two stocks will disappear and the committee will have to decide how to fill the place. How it will decide cannot be predicted.
Key dates are the earnings of the high-priced stocks and US economic data. Because Norfolk Southern, FedEx, Union Pacific and Ryder together make up almost 40 percent, their quarterly reports move the whole index.
Can you invest in the Dow Jones Transportation Average?
You cannot buy the index directly, and we did not find a fund that tracks it today. The two best-known US funds with transport in their name have switched indices. We checked the providers’ filings with the US Securities and Exchange Commission (SEC) as of 7 November 2026.
- iShares U.S. Transportation ETF (IYT): today tracks the S&P Transportation Select Industry FMC Capped Index; it tracked the Dow Jones Transportation Average until around 19 July 2021.
- Direxion Daily Transportation Bull 3X ETF (TPOR): three times leveraged on the same S&P index today; it tracked three times the Dow Jones Transportation Average until 1 August 2022.
Index according to the iShares product page (read on 7 November 2026) and the prospectuses filed with the SEC: iShares supplement of 10 May 2021 (switch on or around 19 July 2021), Direxion prospectus of 3 March 2026 (switch on 1 August 2022).
The well-known IYT used to be called the iShares Transportation Average ETF, and some lists still show that name. According to a prospectus supplement filed with the SEC, it switched around 19 July 2021 to an S&P index that is weighted by market value and capped. According to the provider it holds 44 stocks, not 20, and gives large companies more weight. If you buy IYT, you buy something different from the Dow transport index.
Outside the US, access depends on local rules. In the European Union, retail brokers generally cannot offer a fund to retail investors without the key information document that the PRIIPs regulation requires, and US-domiciled ETFs usually do not provide one. Leveraged products such as TPOR also set their target for one day only; over longer periods the result can differ a lot from three times the index.
If you want to rebuild the index, you can buy the 20 stocks yourself. For a price-weighted index, one share per member is enough in arithmetic terms, about $3,105 on 6 November 2026. You then carry fees, currency risk for non-dollar investors and every later index change yourself. Our Nasdaq Biotechnology Index guide shows the same fund trap for biotech ETFs.
Strengths and limits of the Dow transport index
The transport index is an old, well-documented gauge, but a very narrow one. It bundles 20 large transport companies from rail to air in one number, with data since 1896, and its calculation is simple: with the 20 prices and the divisor you can recalculate every level. Together with the Industrial Average it provides the classic comparison of Dow Theory, and it reacts strongly to the economy and freight demand.
Its limits are just as clear. It weights by price, not size, so high-priced stocks count more and splits change weights. With 20 members it is narrow, and a few companies move the whole index. A committee chooses the members by judgment, without fixed dates or a formula. And Dow Theory non-confirmations have also been wrong, for example from 2018 to 2020.
Dow Jones Transportation Average: our conclusion
The Dow Jones Transportation Average goes back to the oldest US stock index and today measures rail, road, air and logistics. It holds 20 members weighted by share price, so it is shaped by high-priced stocks such as Norfolk Southern, FedEx and Union Pacific, not by the largest companies.
It swings much more than the Industrial Average and fell by more than a quarter nine times since 1992. Over the whole period it still earned a similar return. As part of Dow Theory it helps you put trends in context; a non-confirmation alone is not a reliable sell signal. Our assessment: the transport index is a useful second look at how broadly an upswing is carried. If you use it that way, decide in advance which highs and lows count instead of searching for a fitting divergence afterwards.
When investing, the small print decides. The best-known transport ETFs no longer track it. If you want to bet on the sector, check the index in the factsheet, its weighting and whether the product is available to you.
Frequently asked questions about the Dow Jones Transportation Average
What does the Dow Jones Transportation Average measure?
It tracks the share prices of 20 large US transport companies. They include railroads, parcel carriers, trucking companies, shipping lines, airlines and Uber. The index is price weighted and calculated by S&P Dow Jones Indices.
Which companies are in the Dow transport index?
The index has 20 members. On 6 November 2026, Norfolk Southern, FedEx, Union Pacific, Ryder and J.B. Hunt had the largest weights. Most recently, on 1 June 2026, FedEx Freight replaced American Airlines. The full list is in our table above.
Why does Uber have so little weight in the transport index?
Because the index weights by share price, not by market value. On 6 November 2026, Uber was worth almost twice as much as Norfolk Southern on the stock market, but it cost only $68.59 a share and weighed 2.2 percent. Norfolk Southern cost $319.94 and weighed 10.3 percent.
What does it mean when transports do not confirm the Dow?
Under Dow Theory, an uptrend counts as confirmed only when both indices make new highs. A missing confirmation is a warning sign, but not a reliable one. From 2018 to 2020 the transport index did not confirm for 17 months, and the Industrial Average still rose 13 percent.
Is there an ETF that tracks the Dow Jones Transportation Average?
We did not find a fund that tracks it today. The iShares IYT has followed a different S&P index since July 2021, the leveraged TPOR from Direxion since August 2022. EU retail investors generally cannot buy US-domiciled ETFs that lack the required PRIIPs key information document.
What is the symbol for the Dow Jones Transportation Average?
It depends on the platform. Google and many quote sites use DJT, Yahoo ^DJT, Bloomberg TRAN and Refinitiv .DJT. The version with dividends reinvested is called DJTTR.
This English edition is based on our German edition on kagels-trading.de and has been adapted for international readers.
More Markets and Brokers guides
- Open your first account
What Is a Brokerage Account? A US Beginner's Guide
How to open and fund a US brokerage account, cash vs margin, what it costs and what SIPC and FDIC really cover.
- Choose a broker
Interactive Brokers Review 2026: Fees and Platforms
Fees, platforms, investor protection and real futures commissions from a client since 1996.
- Check an offshore broker
PU Prime Review 2026: FCA Warning, Licences and Costs
Which PU Prime company you contract with, what the FCA warning means, and what 1:1000 leverage and the deposit bonus do to your account.
- Understand your price
Market Makers: Who Sets Your Price and How They Profit
How market makers earn on the spread, who sets prices at German trading venues and what the EU ban on payment for order flow changed.
- Read bond market stress
MOVE Index: The VIX of the Bond Market, Explained
What the MOVE index measures, which readings signal stress, how it differs from the VIX and where its limits are.
- Read market sentiment
Fear and Greed Index: How It Works, Tested Since 2021
How CNN builds its Fear and Greed Index from seven measures, what the zones mean and how the S&P 500 moved after readings below 20.
- Size an index future
Micro Futures: MES vs MNQ, Tick Values and Risk
MES and MNQ tick values, a worked sizing example from the stop with costs and slippage, and why margin is not your risk.
- Read the futures curve
Contango vs Backwardation: Futures Curves Explained
What contango and backwardation mean, what rolling does to a position in each case, and real gold, oil and gas curves from 28 October 2026.
- Choose a silver future
Silver Futures: SI vs Micro Silver vs 100-oz SIC
SI, Micro Silver and the 100-ounce SIC compared by tick value, risk per contract, margin and December 2026 deadlines.
- Read the chip sector
SOX Index: Holdings, Weighting and How to Use It
What the SOX holds, how Nasdaq caps the weights, its largest declines since 2004 against the Nasdaq-100 and which ETFs really track it.
- Read the biotech sector
Nasdaq Biotechnology Index: Holdings, Weighting and Risks
What the NBI holds, how Nasdaq caps the weights, its long declines since 2003 against the Nasdaq-100 and which ETFs really track it.
- Research stocks
InvestingPro Review: Screener, ProPicks AI and WarrenAI
What the InvestingPro screener, ProPicks AI and WarrenAI do, what Pro and Pro+ cost and who needs which plan.
- Use the free news portal
Investing.com Review: Free Tools, Data and Limitations
What the free Investing.com portal does well, where the quote prices come from and when InvestingPro is worth paying for.
- Find real AI revenue
AI Stocks 2026: How Listed Companies Earn From AI
Which listed companies earn from AI in cloud, software, infrastructure and chips, disclosed AI revenue against hope, plus AI ETFs and risks.
- Follow an IPO
Anthropic Stock: IPO Date, Valuation and How to Invest
Where the Anthropic IPO stands, how the valuation compares with revenue and how to get exposure before and after the listing.
- Invest in OpenAI before the IPO
OpenAI Stock: Can You Buy It, and Who Owns OpenAI?
Why there is no OpenAI stock yet, who owns OpenAI, where the IPO stands and how much OpenAI you get through Microsoft or SoftBank.
- Understand a stock split
Stock Splits Explained: Forward and Reverse Splits
What forward and reverse splits change and what they do not, the dates that matter, what happens to options and the $1 listing rule.
- Value a stock
Value Investing: Intrinsic Value, Margin of Safety, Traps
Intrinsic value against price, a worked DCF with a sensitivity table, Coca-Cola as a real example, the value premium since 1926 and value traps.
- Value a new listing
SpaceX Stock (SPCX): Valuation, Risks and How to Buy
How to buy SpaceX stock, what the company is worth after the IPO and which risks the lock-up calendar brings.