
Bull Market: How Long It Lasts and How to Spot the End


Contents
- Bull market in 30 seconds
- What is a bull market?
- Why bull and bear? Where the market symbols come from
- What are the signs of a bull market?
- Are we in a bull market right now?
- How long does a bull market last?
- What phases does a bull market go through?
- Which historical bull markets were there?
- What is a bull trap?
- How do you spot the end of a bull market?
- How do you invest in a bull market?
- Opportunities and risks in a bull market
- Conclusion: a bull market is a counting rule, not a forecast
- Frequently asked questions about bull markets
- About the author
A bull market is the phase when almost everything at the stock exchange goes up. Prices rise for months or years, the mood is good, and every dip gets bought. That is exactly what makes it tricky: whoever joins late takes the biggest gains for granted and the risks for settled. Both are mistakes.
This guide answers the questions that really sit behind the term. You will learn when a rise officially becomes a bull market, why the bull and the bear became the symbols of the stock market, and how long a bull market lasts on average. For the numbers I counted the price history of the S&P 500 (with its historical predecessor before 1957) since 1928, the DAX since 1988 and Bitcoin since 2014 myself instead of copying them. You also get the strategies that work in rising markets and the warning signs before an end. This article follows our editorial policy.
Bull market in 30 seconds
- Definition: a bull market is a phase in which prices close at least 20% above their last low and keep rising.
- Today: the S&P 500 has been in a bull market since October 12, 2022 and closed about 113% above that low on November 11, 2026.
- Duration: of 27 completed bull markets since 1928, the median one lasted 1.7 years; the average is 2.7 years.
- Gain: the typical bull market brought about 80%; the longest, from 1987 to 2000, brought 582% in a little over 12 years.
- End: a bull market ends only when prices close 20% below the high. Anything less is a correction, not a bear market.
What is a bull market?
A bull market is a lasting rise in a financial market in which prices close at least 20 percent above their last low.
The 20 percent mark is a convention, not a law. The financial industry uses it because it draws a clear line between a normal swing and a real change of trend. It is almost always measured on closing prices, the price at the end of the trading day, not on a short spike during the day. That detail matters more than it seems, as the 1990 case further down shows.
In European texts you will also meet the word hausse. It comes from French and means rise; the opposite is baisse. Economists speak of a boom or an expansion, but that describes the whole economy, not prices. An expansion can accompany a bull market, yet the two are measured differently and need not start or end together.
The opposite is a bear market. There, prices close at least 20 percent below their last high. Together the two phases form a market cycle. Our guide to the stock market crash shows the sharpest turns in that cycle since 1929.
The direction of view matters: a bull market is identified in hindsight, not forecast. Only once the 20 percent are reached is it clear that one is running. By then the best part of the move is often behind you. Whoever waits for the official confirmation rarely buys near the low.
Why bull and bear? Where the market symbols come from
The two animals describe how they attack, not their character. A bull thrusts its horns from below upward, which stands for rising prices. A bear swipes its paw from above downward, which stands for falling prices. That is the common explanation, and its simplicity is why the image has lasted so long.
The words are older than the pictures. At the London exchange of the 18th century, traders who sold stock they did not yet own were mocked with the proverb about selling the bear’s skin before catching the bear. These short sellers became the bears, and the bull was added as the opposite figure. You can read how short selling works today in our guide to short selling.
Words you meet every day come from the two animals. Bullish means expecting rising prices, bearish means the opposite. A bullish signal is a hint in the chart that speaks for a rise. Whoever is positioned as a bull has bought and profits when prices go up.
The best known bull stands in New York. The bronze Charging Bull by Arturo Di Modica appeared in front of the New York Stock Exchange in December 1989 and soon moved to Bowling Green, a small park at the south end of Broadway. In front of the Frankfurt exchange, a bull and a bear stand side by side. The bull leading the way fits the statistics: over long periods, stock markets rise more often than they fall.
What are the signs of a bull market?
The first sign is the number; everything else comes along with it. A bull market exists when an index like the S&P 500, the Dow Jones or the DAX closes 20 percent above its last low. The same applies to single sectors, single stocks, commodities and currencies. Which sectors lead a bull market changes again and again; this is called sector rotation.
Second, many descriptions want time as well. For them, a rebound over two weeks is no bull market, even if it gains 20 percent; the move should carry over months. My count below is mechanical and sets no minimum duration. Of the 27 completed S&P 500 bull markets in my count since 1928, the shortest lasted only 24 days in June 1931, while the longest lasted more than twelve years.
Third, the mood turns. Investors take higher risks because they expect higher returns. Professionals call this risk-on: stocks and commodities are in demand, safe havens like government bonds less so. The opposite is risk-off. A quick gauge of the mood is the Fear and Greed Index.
Fourth, monetary policy plays along. Low interest rates make loans cheaper and bonds less attractive as an alternative. Both push money into stocks. When the Federal Reserve raises rates clearly, this tailwind loses strength.
A warning about this list: the points do not always appear together. The bull market since 2022 started while the Fed was still raising rates; the hikes began in March 2022 and reached 5.25 to 5.50 percent in July 2023. Whoever waits for the perfect combination waits too long. The 20 percent are the only hard criterion.
Are we in a bull market right now?
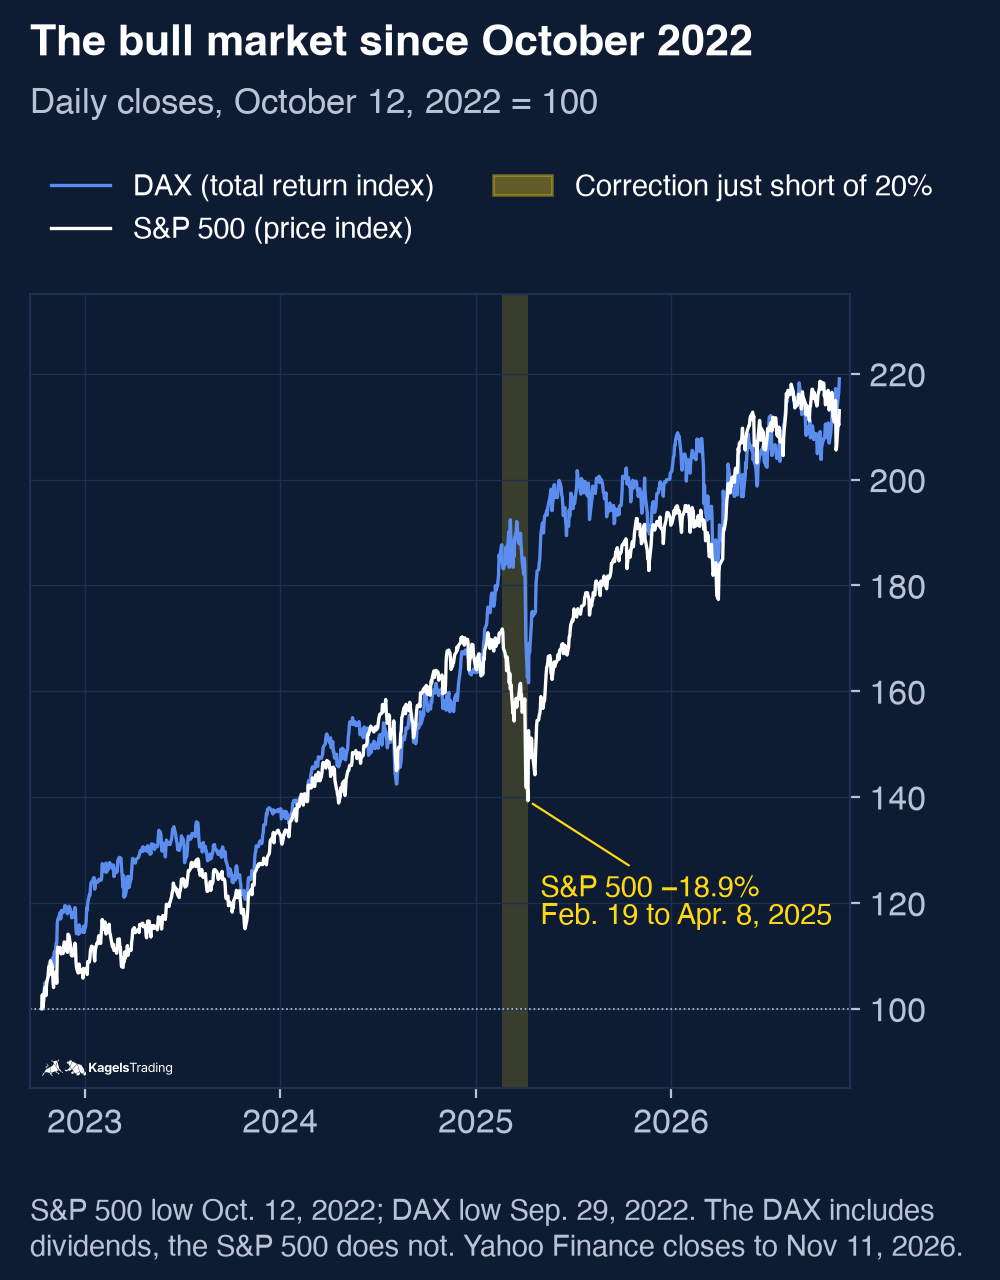
Yes, the S&P 500 has been in a bull market since October 12, 2022. On that day the index closed at 3,577.03 points, the low of the bear market before it. Its record close so far came on October 6, 2026 at 7,818.93 points.
From the low to that record, the bull market gained 118.6 percent. On November 11, 2026 the S&P 500 closed at 7,619.38 points, about 2.6 percent below its record. Measured to that close, the gain stands at 113.0 percent. Both numbers are correct; one runs to the high, the other to the latest close.
The DAX runs in parallel but has its own start date. Its closing low came on September 29, 2022 at 11,975.55 points. On November 11, 2026 it closed at a record of 26,662.77 points, a gain of 122.6 percent.
A direct comparison of the two numbers is misleading. The DAX is a total return index: it adds paid dividends to the price. The S&P 500 is a price index and does not. The DAX therefore looks systematically stronger than it is in a like for like comparison.
 Click to enlarge
Source: Prices from Yahoo Finance, calculation and chart by Kagels Trading.
At 4.1 years, this bull market is clearly older than the average. It has passed both the median of 1.7 years and the mean of 2.7 years. That does not mean it has an expiry date: the bull market from 1987 to 2000 ran for more than twelve years, the one from 2009 to 2020 for almost eleven. Age alone does not end a trend.
It almost ended in the spring of 2025. Between February 19 and April 8, 2025, the S&P 500 fell from 6,144.15 to 4,982.77 points, a decline of 18.9 percent on a closing basis. That is the definition of a correction, and it stopped a little over one percentage point short of the 20 percent mark. By the usual count, the bull market stayed intact.
This near miss shows how arbitrary the line is. Had the index closed a little more than one percentage point lower, every statistic today would show a new bull market from April 2025, about 1.6 years old instead of four. The number does not describe the market; it only sorts it.
Bitcoin shows how differently the same rule works in a volatile market. By the same 20 percent rule, Bitcoin has had 36 completed bull markets since 2014 plus the current one, with a median length of just 48 days. Here I leave out the first record at the start of the data in 2014, because it lasted zero days and never confirmed a rise of 20 percent. The current one began on June 30, 2026 at about $58,600; on November 11, Bitcoin stood about 26 percent above that low and 15 percent below its September 21 high. For such a market, the 20 percent rule says little about the trend.
How long does a bull market last?
For this question I worked through the closing prices of the S&P 500 since 1928. A bull market counts as every phase in which the index rose from a closing low to its next closing high without a decline of 20 percent in between. This gives 27 completed bull markets plus the current one. The first of them starts with the data series in December 1927, not at a bear market low; without it there are 26, with a median of 1.4 years and a gain of 77 percent.
The median bull market lasted 1.7 years, the average 2.7 years. This gap is no calculation error but the message itself: a few very long phases pull the average up, while most bull markets were clearly shorter. The median of 1.7 years describes the typical case better.
The gains show the same picture. The typical bull market brought about 80 percent, the average is 113 percent. Whoever plans with the average plans with an exception. Over the whole period since 1927, the S&P 500 spent about 79 percent of the time in bull markets by this count.
| Period | Duration | Gain |
|---|---|---|
| Dec. 4, 1987 to Mar. 24, 2000 | 12.3 years | 582% |
| Mar. 9, 2009 to Feb. 19, 2020 | 10.9 years | 401% |
| Jun. 13, 1949 to Aug. 2, 1956 | 7.1 years | 266% |
| Oct. 3, 1974 to Nov. 28, 1980 | 6.2 years | 126% |
| Jul. 23, 2002 to Oct. 9, 2007 | 5.2 years | 96% |
| Aug. 12, 1982 to Aug. 25, 1987 | 5.0 years | 229% |
| Oct. 12, 2022 to today | 4.1 years | 119% to the high |
The two longest phases in detail. From December 1987 to March 2000, the S&P 500 rose from 223.92 to 1,527.46 points; from March 2009 to February 2020, from 676.53 to 3,386.15 points. The current bull market started at 3,577.03 points.
Which bull market was the longest is disputed, and the reason is instructive. You often read that the phase from 2009 to 2020 was the longest in history. By the strict 20 percent rule on closing prices, that is not true: the phase from December 1987 to March 2000 ran even longer. The decline of 1990 stopped at 19.9 percent and therefore did not break the count.
So which number someone names depends only on whether they count 1990 as a bear market. Many sources do, because the decline exceeded 20 percent on an intraday basis. The bull market since 2009 had two such near misses as well: 19.4 percent in 2011 and 19.8 percent in 2018, both on closing prices. Both answers are defensible, as long as the counting rule is stated. This is exactly where most descriptions get vague.
What phases does a bull market go through?
The fund manager Sir John Templeton gave the best known description. He named four stages that describe the mood of investors more than the price. His summary fits into one sentence.
“Bull markets are born on pessimism, grow on skepticism, mature on optimism, and die on euphoria.” That is how Sir John Templeton put it, and the four phases below follow this line.
In the pessimistic phase, fear is greatest. The news is bad, prices have just come through a bear market, and hardly anyone wants to buy. Whoever enters here has historically had the best starting point, but has to act against their own perception.
In the skeptical phase, prices rise but nobody trusts the peace. The move is volatile, meaning it swings strongly, and many dismiss it as a mere rebound. Only now do larger investors start building positions again.
In the optimistic phase, the broad public joins in. The news is good, company earnings too, and the trend attracts more money. This phase is usually the longest and the most pleasant to trade, because pullbacks stay shallow.
In the euphoric phase, prices rise faster than company earnings. New all-time highs follow close together, and even the most cautious investors buy. Whoever misses the exit here carries the following decline in full.
This model is a frame for interpretation, not a timing tool. Which phase you are in can only be said clearly in hindsight. Use it to place your own mood, not to time entries and exits. If you like more detailed phase models, the Elliott Wave Theory counts five waves within a rising trend.
Which historical bull markets were there?
 Click to enlarge
Source: Prices from Yahoo Finance, calculation and chart by Kagels Trading.
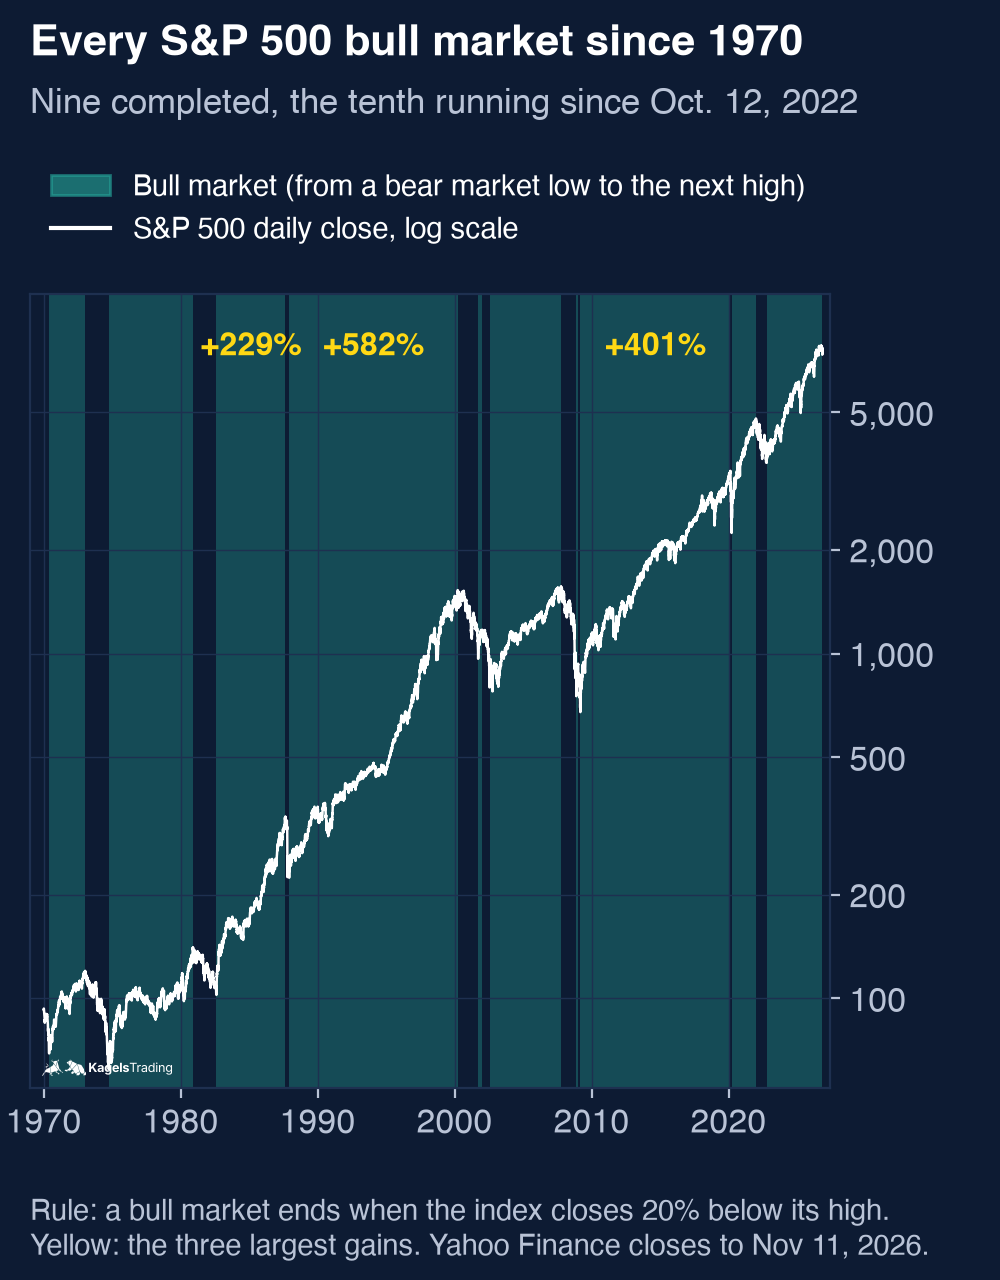
Since 1970 the S&P 500 has had nine completed bull markets plus the current one. The chart shows them as green bands. Two of them are short rallies inside larger declines, in 2001 to 2002 and 2008 to 2009, which the 20 percent rule counts as separate bull markets. What stands out is how much room the bull markets take: over long periods, the market is far more often in an uptrend than in a downtrend.
The postwar boom until 1973
The decades after the Second World War are known as the Golden Age of Capitalism. Strong economic growth, rising incomes and low unemployment carried the markets. The longest bull market of that era ran from June 1949 to August 1956 and gained 266 percent in 7.1 years.
At the stock exchange, this era ended in January 1973. The last bull market of the period, from May 1970 to January 11, 1973, gained 73.5 percent. After it came one of the worst bear markets of the postwar years, together with the oil crisis. For stocks, the 1970s as a whole were a lost decade, not a boom.
The 1980s upswing under Reagan and Volcker
The bull market from August 1982 to August 1987 gained 229 percent in five years. Before it came a hard monetary cut: the Federal Reserve under Paul Volcker pushed short-term rates to around 20 percent to break the high inflation of the late 1970s. Consumer price inflation peaked near 15 percent in 1980 and was down to about 3 percent by 1983.
This is important for the timeline. Inflation was a problem of Ronald Reagan’s first term, not his second. When he started his second term in 1985, it had already been broken. The bull market peaked in August 1987, and the bear market that followed included the crash of October 1987.
The bull market of the 1990s
From December 1987 to March 2000 the longest uninterrupted rise since 1928 took place. The S&P 500 rose from 223.92 to 1,527.46 points, or 582 percent. Counted for the 1990s alone, from the end of 1989 to the end of 1999, the gain was 315.7 percent.
It was ended by the dotcom bubble. Investors bought internet companies without profits at valuations that could only be justified with hopes for the future. Many of these companies disappeared again.
The upswing before the 2008 financial crisis
From July 2002 to October 2007, prices rose 96 percent. The phase was carried by high debt and a boom in subprime mortgages, meaning home loans to borrowers with weak credit. Low interest rates made these loans cheap.
At the end stood the housing bubble and with it the financial crisis. The following bear market cost the S&P 500 more than half of its value. The rule counts a short rally from November 2008 to January 2009 in between.
The bull market from 2009 to 2020
From the low on March 9, 2009 at 676.53 points to the high on February 19, 2020 at 3,386.15 points, the S&P 500 rose 400.5 percent. That took 10.9 years and is the second longest phase since 1928. It ended abruptly with the Covid crash.
This bull market was not calm. The European debt crisis in 2011 and growth fears in the fourth quarter of 2018 brought sharp setbacks without breaking the 20 percent mark. This is typical: a long bull market consists of many small shocks.
The short bull market from 2020 to 2022
After the Covid low on March 23, 2020, the S&P 500 more than doubled in less than two years. It rose from 2,237.40 to 4,796.56 points on January 3, 2022, a gain of 114.4 percent in 1.8 years. Near zero interest rates and large stimulus programs carried this phase; the rate hikes of 2022 ended it.
What is a bull trap?
A bull trap is a breakout to the upside that fails right away and leaves the buyers with losses.
The sequence is always the same. A price breaks above a clear high, investors read this as a buy signal and enter. Shortly after, the price turns and falls back below the breakout level. Whoever bought now sits on a loss and sells, which adds to the decline.
The name is easily misread. Trapped is not whoever bought too late, but whoever bought at all and does not find the exit in time. The trap closes while holding, not at the entry. The mirror image on the sell side is called a bear trap.
Two candlestick patterns often appear at such turning points. The dark cloud cover and the bearish engulfing pattern both form after a strong rise and point to a reversal. Both are hints, not guarantees; our guide to candlestick patterns shows how to read them.
A bull trap is not the same as the end of a bull market. It is an event of days or weeks. The larger trend can continue unbroken afterward. Only a decline of 20 percent ends the bull market.
How do you spot the end of a bull market?
There is no reliable answer to this question, and any source that claims otherwise overrates itself. There are warning signs that often piled up in hindsight. They do not all appear at once, and they also appear without a bear market following.
- Slower economic growth over several quarters.
- Cautious companies that invest less and take on fewer loans.
- More careful consumers whose spending weakens.
- Shocks from outside: wars, financial crises, natural disasters, pandemics.
The only clear signal is the price itself. If an index closes 20 percent below its high, the bull market is over by the usual definition. Everything before that remains interpretation.
A widely used technical warning signal is the death cross. The death cross forms when the 50 day moving average crosses below the 200 day average. Its opposite, the golden cross, counts as the start signal of an uptrend. Both signals are slow: they report the turn only when part of the move is already done, and they give regular false signals. A second warning signal looks not at the price but at the breadth of the market: the Hindenburg Omen fires when many stocks make new yearly highs and lows at the same time.
As a trader, I therefore work with levels, not forecasts. I read in the chart which price levels must hold for the uptrend to stay intact. If the market breaks below them, I react. That is unspectacular, but it works without a prediction; more on this in our guide to support and resistance.
What is the shoeshine boy signal?
The shoeshine boy signal stands for the late phase in which even people far from the market start to speculate. The best known version is told about Joseph P. Kennedy, who is said to have sold his stocks before the crash of 1929 after a shoeshine boy gave him tips. The story is popular, but there is no reliable source for it. In German texts the same idea has its own name, the “maid’s boom”.
The warning sign is not participation itself but its reason. People buy because prices rise, not because companies earn more. When even the most cautious savers are invested, the buyers for the next rise are missing.
As a timing tool, the idea still fails. There is no measure for when enough small investors have joined. It describes a mood, and moods can only be dated in hindsight.
How do you invest in a bull market?
The basic rule: in a bull market you work with the trend, not against it. The hardest task is not the entry but sitting through the pullbacks without closing the position out of nervousness.
Buy and hold
Buy and hold means buying and leaving it. You buy stocks or funds and hold them for years, regardless of interim swings. The advantage is low costs and little effort. The disadvantage is that you take every bear market in full.
Trend following
Trend following bets that an existing move continues. You enter when the trend is confirmed and exit when it breaks. A stop-loss order, an automatic sell order below the price, helps manage the loss, but in a gap or a fast market it can fill well below the stop price. This strategy suits bull markets well because it rewards long moves.
Buying pullbacks
Instead of buying at the high, you wait for a decline inside the uptrend. Professionals call this a retracement. The entry price gets better, but you miss moves that run on without a pullback. What matters is deciding beforehand at which price you buy and where your stop sits; our guide to pullback trading shows the method step by step.
Momentum
Momentum strategies buy what is already rising the most. The approach is easy to apply and has historically worked well in uptrends. It is also the riskiest on this list, because such stocks fall more than average in corrections. Without risk management I do not recommend it; relative strength explains how such leaders are measured.
Index ETFs
A broad stock index ETF tracks a whole index instead of betting on single stocks. With one fund you can own hundreds of companies and do not have to analyze single names. The fees are low because no fund manager picks actively.
One honest limit belongs here: cheaper does not automatically mean more profitable. An ETF delivers the return of its index minus costs, not more. In a bear market it falls just like the index. The often heard claim that index funds beat active funds holds only on average across many funds and long periods, not in every single case.
What I do not recommend in a bull market is trading on credit. A margin loan enlarges gains and losses alike. In the US, Regulation T lets you borrow up to half of the purchase price of eligible stocks, and FINRA requires your equity to stay at least 25 percent of the current market value of the securities; many brokers demand more. In a phase where everything rises anyway, leverage tempts you to mistake risk for skill. In a drop like spring 2025, a leveraged account can fall below that line, and then the broker issues a margin call or sells positions without asking; our guide to position sizing shows how to keep each trade small enough.
Opportunities and risks in a bull market
A bull market is the friendliest phase at the stock exchange, and that is exactly its danger. The following points sum up what works for you and what can cost you money, in four points each.
Opportunities in a bull market come from the trend working in your favor and from time.
- The larger trend forgives timing mistakes more easily.
- Pullbacks usually stay shallow and end faster than in sideways phases.
- Simple approaches like trend following or a regular index plan work without complex analysis.
- History: uptrends lasted longer than downtrends and made up most of the price gains.
Risks in a bull market come from overconfidence and late signals.
- Rising prices are easily mistaken for your own skill, and risk awareness drops.
- Late entry: whoever waits for the official confirmation often misses the strongest part of the move.
- Bull traps cost money even while the larger trend stays intact.
- No forecast: the end cannot be predicted, and corrections of almost 20 percent happen in the middle of a bull market too.
Conclusion: a bull market is a counting rule, not a forecast
A bull market is nothing more than a rise of at least 20 percent, identified after the fact. It tells you what happened, not what comes next. Whoever accepts this uses the term correctly: as a classification, not as a buy signal.
The numbers from my count speak for calm, not for action. Of 27 completed bull markets since 1928, the typical one lasted 1.7 years and gained about 80 percent. The current one is older at 4.1 years, but the one from 1987 to 2000 ran for more than twelve years. Age alone does not end a trend.
In practice this means: work with levels, not opinions. Decide which price level has to hold for you to stay invested and where you get out. You make this decision before the entry, not in the middle of a pullback. Everything else you leave to the market.
This article is market analysis, not investment advice. Past bull markets do not show future results, and every number here depends on the counting rule described above.
Frequently asked questions about bull markets
What does bull market mean?
A bull market is a phase in which prices close at least 20 percent above their last low and the uptrend continues. It is usually measured on closing prices. In French and German texts the same phase is called hausse.
Are we in a bull market in 2026?
Yes, the S&P 500 has been in a bull market since October 12, 2022. On November 11, 2026 it closed at 7,619.38 points, about 113 percent above the low of 3,577.03 points. The DAX has been in the same phase since September 29, 2022 and closed at a record that day.
How long does a bull market last on average?
Of 27 completed bull markets in the S&P 500 since 1928, the median one lasted 1.7 years. The average is 2.7 years, and the range runs from 24 days to 12.3 years. There is no fixed length.
What is the difference between a bull market and a bear market?
In a bull market prices rise at least 20 percent above their last low; in a bear market they fall at least 20 percent below their last high. Together the two phases form a market cycle. By my count, the S&P 500 spent about 79 percent of the time since 1927 in bull markets.
Why do the bull and the bear stand for the stock market?
Both animals stand for the way they attack. The bull thrusts its horns upward and stands for rising prices, the bear swipes its paw downward and stands for falling prices. The best known statue is the Charging Bull near Wall Street in New York.
When does a bull market end?
Formally, it ends as soon as an index closes 20 percent below its high. Before that there are only warning signs like slower growth or weaker consumer spending. None of them is reliable, and a decline of almost 20 percent, like in the spring of 2025, can also happen in the middle of a bull market.
How do you invest in a bull market?
Common approaches are buy and hold, trend following, buying pullbacks, momentum strategies and index funds. What matters more than the choice of strategy is risk management: decide before the entry at which price you will get out.
This US edition is based on our German edition on kagels-trading.de and has been adapted for US readers.
More Markets and Brokers guides
- Open your first account
What Is a Brokerage Account? A US Beginner's Guide
How to open and fund a US brokerage account, cash vs margin, what it costs and what SIPC and FDIC really cover.
- Choose a broker
Interactive Brokers Review 2026: Fees and Platforms
Fees, platforms, investor protection and real futures commissions from a client since 1996.
- Check an offshore broker
PU Prime Review 2026: FCA Warning, Licences and Costs
Which PU Prime company you contract with, what the FCA warning means, and what 1:1000 leverage and the deposit bonus do to your account.
- Check CopyX
CopyX Review 2026: Is TAG Markets Copy Trading Legit?
Who runs the TAG Markets copy trading platform, which regulators warn about it, why US residents are excluded and how fast the 12x Amplify account eats your deposit.
- Understand your price
Market Makers: Who Sets Your Price and How They Profit
How market makers earn on the spread, who sets prices at German trading venues and what the EU ban on payment for order flow changed.
- Read bond market stress
MOVE Index: The VIX of the Bond Market, Explained
What the MOVE index measures, which readings signal stress, how it differs from the VIX and where its limits are.
- Read stock market fear
VIX Index: What the Fear Gauge Measures and Normal Levels
What the VIX measures, which levels have been normal since 1990, how closely it tracks the S&P 500 and how VIX futures, options and ETPs work.
- Read market sentiment
Fear and Greed Index: How It Works, Tested Since 2021
How CNN builds its Fear and Greed Index from seven measures, what the zones mean and how the S&P 500 moved after readings below 20.
- Trade an index CFD
Index CFDs at Interactive Brokers: Symbols, Costs and Trading
All 13 IBKR index CFDs, margin, stop and close-out worked through for IBDE40, financing, UK hours and the TradingView limit.
- Size an index future
Micro Futures: MES vs MNQ, Tick Values and Risk
MES and MNQ tick values, a worked sizing example from the stop with costs and slippage, and why margin is not your risk.
- Read the futures curve
Contango vs Backwardation: Futures Curves Explained
What contango and backwardation mean, what rolling does to a position in each case, and real gold, oil and gas curves from 28 October 2026.
- Choose a silver future
Silver Futures: SI vs Micro Silver vs 100-oz SIC
SI, Micro Silver and the 100-ounce SIC compared by tick value, risk per contract, margin and December 2026 deadlines.
- Read the chip sector
SOX Index: Holdings, Weighting and How to Use It
What the SOX holds, how Nasdaq caps the weights, its largest declines since 2004 against the Nasdaq-100 and which ETFs really track it.
- Read the biotech sector
Nasdaq Biotechnology Index: Holdings, Weighting and Risks
What the NBI holds, how Nasdaq caps the weights, its long declines since 2003 against the Nasdaq-100 and which ETFs really track it.
- Read the transport sector
Dow Jones Transportation Average: Stocks and Dow Theory
The 20 stocks in the Dow transport index, why the share price sets their weight, declines since 1992 and what Dow Theory can and cannot tell you.
- Read the French market
CAC 40 Index Explained: All 40 Stocks, Weights and Trading Hours
All 40 CAC 40 stocks, how Euronext caps the weights at 15 percent, trading hours in Eastern Time and how it differs from the DAX.
- Research stocks
InvestingPro Review: Screener, ProPicks AI and WarrenAI
What the InvestingPro screener, ProPicks AI and WarrenAI do, what Pro and Pro+ cost and who needs which plan.
- Judge a stock-picking newsletter
Motley Fool Stock Advisor Review: Cost and Track Record
What Motley Fool Stock Advisor costs after the first year, how the advertised return is calculated, refund and renewal terms, and who it suits.
- Use the free news portal
Investing.com Review: Free Tools, Data and Limitations
What the free Investing.com portal does well, where the quote prices come from and when InvestingPro is worth paying for.
- Find real AI revenue
AI Stocks 2026: How Listed Companies Earn From AI
Which listed companies earn from AI in cloud, software, infrastructure and chips, disclosed AI revenue against hope, plus AI ETFs and risks.
- Compare AI data center suppliers
AI Infrastructure Stocks: 10 Data Center Suppliers Compared
Ten suppliers for power, cooling, servers and optics compared on free cash flow, customer concentration and next dates, with filters and a two-stock comparison.
- Follow an IPO
Anthropic Stock: IPO Date, Valuation and How to Invest
Where the Anthropic IPO stands, how the valuation compares with revenue and how to get exposure before and after the listing.
- Invest in OpenAI before the IPO
OpenAI Stock: Can You Buy It, and Who Owns OpenAI?
Why there is no OpenAI stock yet, who owns OpenAI, where the IPO stands and how much OpenAI you get through Microsoft or SoftBank.
- Understand a stock split
Stock Splits Explained: Forward and Reverse Splits
What forward and reverse splits change and what they do not, the dates that matter, what happens to options and the $1 listing rule.
- Analyze a company
Fundamental Analysis: 12 Ratios, a Worked Example, 5 Steps
Twelve ratios with formulas and rules of thumb, worked through Microsoft's 2026 annual report, a five-step process and the fundamentals of forex, commodities and crypto.
- Value a stock
Value Investing: Intrinsic Value, Margin of Safety, Traps
Intrinsic value against price, a worked DCF with a sensitivity table, Coca-Cola as a real example, the value premium since 1926 and value traps.
- Value a new listing
SpaceX Stock (SPCX): Valuation, Risks and How to Buy
How to buy SpaceX stock, what the company is worth after the IPO and which risks the lock-up calendar brings.