
Gold-Silver Ratio Today: Chart Since 2000 and History


Contents
- Gold-silver ratio in 30 seconds
- What is the gold-silver ratio?
- What is the gold-silver ratio today?
- Gold-silver ratio history: chart since 2000
- What do high and low readings mean?
- What happened after extreme readings: our analysis
- How do traders use the gold-silver ratio?
- Strengths and limits of the gold-silver ratio
- Gold-silver ratio forecast: what the data says
- Gold-silver ratio: our conclusion
- Frequently asked questions about the gold-silver ratio
- About the author
On 18 March 2020 one ounce of gold cost as much as about 126 ounces of silver; in April 2011 it cost only about 32. That is what our analysis of the gold and silver futures since 2000 shows, and other price series differ slightly. The gold-silver ratio swings between these extremes: in January 2026 it fell to about 44, and on 10 November it closed at 78.9.
Here you get the current value, our own chart since 2000 and our analysis of what happened to gold and silver after readings above 90 and below 50. You also learn how traders use the ratio, how a futures spread is sized and where the ratio can mislead you. This article follows our editorial policy and is for education, not investment advice.
Gold-silver ratio in 30 seconds
- The gold-silver ratio is the gold price divided by the silver price per troy ounce. It tells you how many ounces of silver one ounce of gold buys, and it is the same in dollars and euros.
- On 10 November 2026 it closed at 78.9. Gold cost $4,030.20 and silver $51.10 per ounce (closing prices of COMEX futures from Yahoo Finance).
- Since 2000 the average was 69. In our futures series the highest close was about 126 in March 2020 and the lowest about 32 in April 2011.
- After readings above 90, silver rose more than gold over the next year in three of four cases. Across all trading days that happened in only 39.5 percent of cases, and four cases are no reliable statistic.
- The ratio shows relative value, not your entry. Both metals can fall at the same time, even when the ratio looks attractive.
What is the gold-silver ratio?
The gold-silver ratio is the price of one troy ounce of gold divided by the price of one troy ounce of silver. It tells you how many ounces of silver you get for one ounce of gold, and it is a pure number without a currency.
The calculation is a simple division. On 10 November 2026 the gold future closed at $4,030.20 and the silver future at $51.10. Divide 4,030.20 by 51.10 and you get 78.9.
Because both prices are in the same currency, the currency cancels out. That is why the ratio is the same in dollars, euros or any other currency. Small differences between websites come only from the time of the quote, or from one site using spot prices and another using futures.
The idea is old. The US Coinage Act of 1792 fixed the value of gold to silver by law at 15 to 1. Today the market sets the ratio every day, and it moves far more than it did then.
Gold-silver ratio, gold/silver ratio or gold to silver ratio: all the same
You will find the figure under several names. Gold-silver ratio, gold to silver ratio and gold/silver ratio all mean the same quotient. Do not confuse it with the XAU index, a stock index of gold and silver miners.
What is the gold-silver ratio today?
On 10 November 2026 the gold-silver ratio closed at 78.9. That is above the average since 2000 of 69.2, but below the mark of 80, from which silver is usually seen as cheap relative to gold.
| Figure | Value | Date |
|---|---|---|
| Gold-silver ratio | 78.9 | 10 Nov 2026 |
| Gold price (COMEX future) | $4,030.20 | 10 Nov 2026 |
| Silver price (COMEX future) | $51.10 | 10 Nov 2026 |
| 12-month high | about 82 | 21 Nov 2025 |
| 12-month low | about 44 | 26 Jan 2026 |
| Average since 2000 | 69.2 | 30 Aug 2000 to 10 Nov 2026 |
All values come from daily closing prices of COMEX futures on Yahoo Finance, not from the exchange’s official settlement prices. Spot prices and other data providers therefore show slightly different numbers.
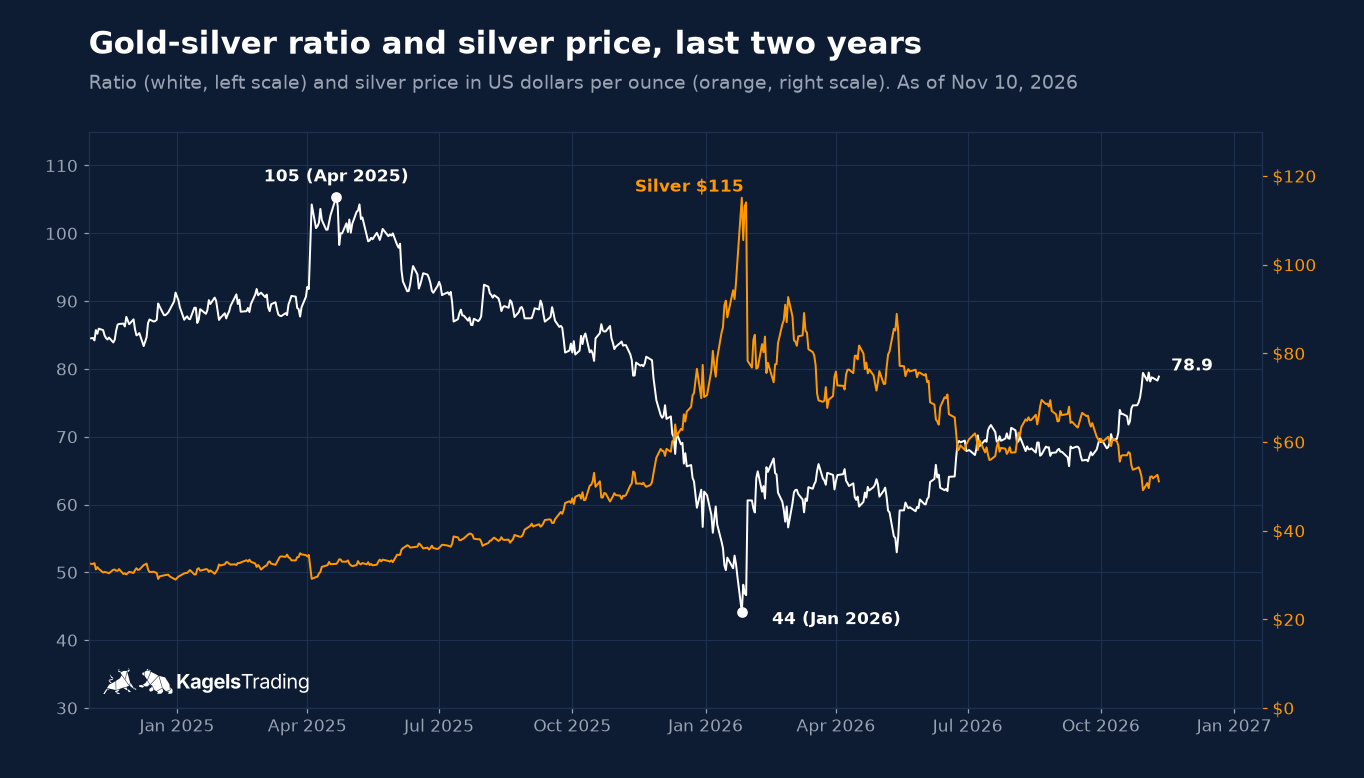
The last twelve months were unusual. Silver rose to about $115 by 26 January 2026, and the ratio fell to about 44, its lowest level since 2011. On 30 January silver fell by about 31 percent in a single day.
 Click to enlarge
Since then the ratio has risen step by step. Silver lost much more than gold, and the ratio climbed from about 44 to 79. Where silver stands on the chart is covered in our silver price forecast, and gold in our gold price forecast.
Gold-silver ratio history: chart since 2000
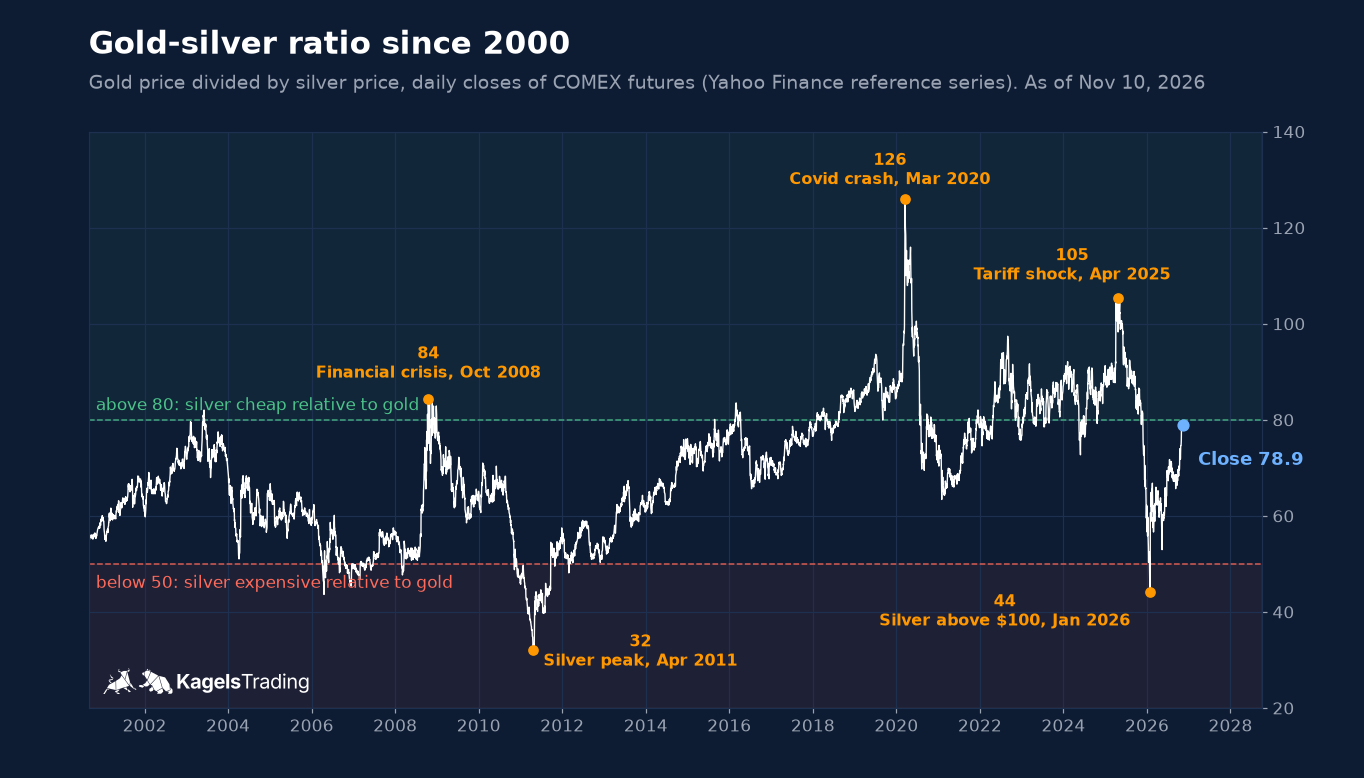
Since 2000 the ratio averaged 69.2, with a median of 68.5. It stood above 80 on 21.9 percent of all trading days and below 50 on 6.1 percent. Extremes are rare, but they come in every decade.
 Click to enlarge
Five spikes shape the chart. The values in the table are rounded closing prices of the Yahoo Finance futures series. Apart from 2011 and 2026 they came in crises, when investors bought gold as a safe haven and sold silver as an industrial metal.
| Date | Ratio | Event |
|---|---|---|
| 17 Oct 2008 | about 84 | Financial crisis after Lehman Brothers |
| 25 Apr 2011 | about 32 | Silver peak |
| 18 Mar 2020 | about 126 | Covid crash |
| 21 Apr 2025 | about 105 | Gold record after the US tariff shock |
| 26 Jan 2026 | about 44 | Silver rally above $100 |
Since 2014 the ratio has been clearly higher than before. Before 2014 it stood above 70 on only 14 percent of days; from 2014 to mid 2025 it did so on 86 percent. Between 2018 and 2024 it never fell below 63, until the silver rally of 2025 and 2026 broke the pattern.
If you look for longer histories, you will find charts going back 100 years. Our own data starts in 2000, because from then on there are complete daily closes of both futures. For older values we do not quote figures we cannot recalculate ourselves.
What do high and low readings mean?
A high ratio means silver is cheap relative to gold. A low ratio means the opposite. There is no official standard for the thresholds, but these zones have become common in the market.
| Ratio | Reading | Share of days since 2000 |
|---|---|---|
| above 80 | silver cheap relative to gold | 21.9% |
| 50 to 80 | normal range | 72.0% |
| below 50 | silver expensive relative to gold | 6.1% |
Why does the ratio move at all? Gold and silver react to the same drivers: real interest rates, the dollar and fear of crises. But silver has a second role. According to the Silver Institute, 680.5 million of the 1.16 billion ounces demanded in 2024 went into industry, just under 59 percent.
Silver can therefore fall further than gold during economic stress and rise faster during recoveries. The overreaction in both directions creates the swing of the ratio.
On the gold side, other forces are at work. Central banks have been buying gold in large amounts for years: according to the World Gold Council, 321 tonnes in the third quarter of 2026 alone, 42 percent more than a year earlier. This supports gold on one side and can keep the ratio higher than in the past.
What happened after extreme readings: our analysis
The common rule says: buy silver above 80 or 90, switch back to gold below 50. We checked what happened since 2000 in the twelve months after the first day above 90 or below 50. A new case only counts once the threshold has not been touched for at least six months. The end point is the first trading day 365 calendar days after the start.
| Start and ratio | Ratio 12 months later | Price change silver / gold |
|---|---|---|
| 5 Jun 2019: 90.0 | 95.8 | +22% / +30% |
| 28 Jan 2020: 90.2 | 72.7 | +46% / +18% |
| 1 Jul 2022: 91.9 | 84.3 | +17% / +7% |
| 22 Jan 2024: 91.2 | 88.1 | +41% / +36% |
| 6 Apr 2006: 49.6 | 48.8 | +15% / +13% |
| 27 Feb 2008: 49.9 | 72.7 | −33% / −2% |
| 9 Nov 2010: 48.8 | 52.1 | +19% / +27% |
| 23 Jan 2026: 49.3 | still open | still open |
The percentages are price changes of our futures reference series. They exclude the costs of rolling contracts, fees and margin. What a trader would actually have earned can differ.
Above 90, silver rose more than gold in three of four cases. For comparison: across all 6,322 start days with a full following year, that happened in only 39.5 percent of cases.
The exception is instructive. Anyone who switched into silver at 90 in June 2019 saw the ratio at about 126 nine months later. Only then did the big turn come.
Below 50 the picture was mixed. In 2008 silver fell by a third within a year while gold barely moved. In 2006 both were almost level, and in 2010 gold did better.
The case from January 2026 is still open. By 10 November silver had lost about 49 percent since then, and gold about 19 percent.
Four and three cases are no statistic, and the windows of the June 2019 and January 2020 cases even overlap. The analysis shows a tendency, but no reliable trading edge. Never use the ratio alone; always combine it with the chart of the metal you want to trade.
How do traders use the gold-silver ratio?
Traders use the ratio in three ways. Which one fits depends on whether you hold physical metal or trade on an exchange.
1. Switching between gold and silver
This is the classic approach for investors with bars and coins. When the ratio is high, part of the gold is swapped into silver, and back again when it is low. The aim is more ounces, not more dollars. Every swap costs the spread between buying and selling price, which is often much wider for silver than for gold.
2. Choosing the metal that lags
If you plan to buy into precious metals anyway, the ratio can work as a filter. When it is high, you pick silver; when it is low, gold. If you prefer stocks, you will find the miners in our guides to silver stocks and gold stocks.
3. Trading the spread with futures
Professionals trade the ratio directly: buy gold and sell silver, or the other way round. For the two legs to balance, their contract values must be similar. One gold future (GC) covers 100 ounces, about $403,000 at $4,030.20.
At a ratio of 79, 100 ounces of gold match about 7,900 ounces of silver. That is about eight micro silver futures (SIL) of 1,000 ounces each, together about $409,000. A futures spread is a leveraged trade and only suitable for experienced traders.
You can chart the ratio yourself in most charting programs. In TradingView, you type a division of two symbols into the search box, for example the gold and the silver future.
Strengths and limits of the gold-silver ratio
The ratio shows in one number which of the two metals is cheap or expensive relative to the other. It is currency-neutral, you can calculate it yourself from two prices, and above 90 silver rose more than gold in the following year in three of four cases. It also forces you to look at gold and silver together rather than in isolation.
Its limits are just as clear. It says nothing about direction: both metals can fall at the same time. Extremes can stretch further, as in 2019, when the ratio rose from 90 to about 126. Central bank buying and industrial demand can shift the normal range for years, and since 2000 there have been only a handful of extreme cases, too few for a fixed rule.
Gold-silver ratio forecast: what the data says
There is no reliable forecast for the ratio. It depends on two markets at once, each with its own drivers. But the data since 2000 allows a classification.
At 78.9, the ratio is above its long-term average and just below the mark of 80. If it rises above that, silver would again be cheap relative to gold by the usual zones. If it falls towards 70, silver is catching up.
For the direction of each metal, our regularly updated forecasts are the better source. How the third major precious metal is doing is covered in our platinum price forecast, and the gold and silver forecasts are linked above.
Gold-silver ratio: our conclusion
The gold-silver ratio shows which of the two metals the market is currently overdoing. At 78.9 in November 2026 it is above its average since 2000, after its lowest level since 2011 in January.
Our analysis confirms the old rule of thumb only in part. Above 90, the silver price usually rose more than the gold price; below 50 the picture was mixed, and extremes could stretch further. Use the ratio for the weighting between gold and silver and time your entry with the chart.
Our assessment: at 78.9 the ratio is not sending an extreme signal. By the usual zones, it only becomes interesting again above 80 or below 50.
Frequently asked questions about the gold-silver ratio
What is the gold-silver ratio today?
On 10 November 2026 the gold-silver ratio closed at 78.9. Gold cost $4,030.20 and silver $51.10 per ounce (closing prices of COMEX futures from Yahoo Finance). The average since 2000 is 69.2.
How do you calculate the gold-silver ratio?
Divide the gold price per ounce by the silver price per ounce. $4,030.20 divided by $51.10 gives 78.9. Both prices must be in the same currency and ideally from the same time.
Is the gold-silver ratio different in euros than in dollars?
No, the currency cancels out. Gold and silver are converted at the same exchange rate, so the ratio stays the same. Differences between websites come only from the time of the quote or from spot versus futures prices.
At what gold-silver ratio is silver considered cheap?
The usual mark is 80. Above it, silver is seen as cheap relative to gold; below 50, as expensive. Since 2000 the ratio stood above 80 on 21.9 percent of trading days and below 50 on 6.1 percent.
What has the gold-silver ratio been historically?
In the closing price series of COMEX futures on Yahoo Finance, the range since 2000 was from about 32 to about 126. Spot and intraday values can differ slightly. The low came on 25 April 2011, shortly before the silver peak of that time, and the high on 18 March 2020 in the Covid crash. The US Coinage Act of 1792 had fixed the ratio at 15 to 1.
Is a high gold-silver ratio a buy signal for silver?
Only to a limited extent. In our analysis, silver rose more than gold in the year after the first day above 90 in three of four cases, but across all trading days in only 39.5 percent. In 2019 the ratio first rose from 90 to about 126. The ratio shows relative value; your entry should come from the chart.
This English edition is based on our German edition on kagels-trading.de and has been adapted for international readers.
More Stocks & Commodities guides
- Choose a silver stock
Best Silver Stocks 2026: 10 Companies Compared
Ten silver producers, streamers and explorers compared on 2025 output, costs, dividends and chart levels after the record highs of early 2026.
- Choose a gold stock
Best Gold Stocks 2026: Miners and Royalty Companies
Eleven gold producers, royalty companies and developers compared on output, costs, dividends and 2026 takeovers, plus gold miner ETFs.
- Read the gold miners sector
XAU Gold/Silver Index Explained: Holdings, Weighting and Risks
What the XAU holds, how Nasdaq caps the weights, its declines since 1983 against gold and whether a fund tracks it.
- Choose an oil stock
Best Oil Stocks 2026: Majors, Pipelines and Refiners
The largest oil producers, pipelines and refiners by market value and dividend, the MLP tax traps and the main energy ETFs.
- Choose a chip stock
Semiconductor Stocks 2026: AI Chips, Memory and Equipment
Chip designers, foundries, memory and equipment makers by market value, revenue and guidance, plus how the main semiconductor ETFs differ.
- Compare defense stocks
Defense Stocks 2026: US and European Stocks Compared
US and European defense stocks compared by backlog and price moves since 2025, what the main defense ETFs hold and the risks by region.
- Compare drone stocks
Drone Stocks: Makers, Counter-Drone Firms and Risks
Drone makers, counter-drone firms and defense groups compared by real drone exposure, losses and dilution, plus drone ETFs and how US investors can buy.
- Track sector rotation
Sector Rotation: How to Spot Shifts in Market Leadership
Read an XLE/SPY ratio chart, check the business-cycle model against three recessions and see our 27-year sector momentum backtest.