
Risk-On vs Risk-Off: Meaning, Assets and Indicators


Contents
- Risk-on and risk-off in 30 seconds
- What do risk-on and risk-off mean?
- Market sentiment drives risk appetite
- What the data show: five market shocks since 2008
- Risk-off, then risk-on: the 2020 example
- Where does the big money flow?
- What happens in a risk-on market?
- What happens in a risk-off market?
- Risk-on and risk-off patterns change over time
- How to read risk-on and risk-off: the key indicators
- Using risk-on and risk-off in your trading
- Frequently asked questions about risk-on and risk-off
- About the author
Risk-on and risk-off in 30 seconds
- Risk-on means investors are willing to take risk. Money flows into stocks, emerging markets, oil, copper and higher-yielding currencies such as the Australian dollar.
- Risk-off means investors want safety. Money flows into Treasuries, the Japanese yen, the Swiss franc and often the US dollar. Stocks fall across the board.
- Triggers are weak economic data, central bank surprises, wars, elections and bank failures.
- Best gauges: the VIX, the US Dollar Index (DXY), AUD/JPY and the 10-year Treasury yield.
- Our data check: in five market shocks since 2008, Treasuries rose in four. Gold and utility stocks were not reliable shelters: gold rose early in 2008 and 2020, then fell when investors needed cash.
- Why it matters: in risk-off phases many trades move together. Five positions can turn into one big bet.
What do risk-on and risk-off mean?
Risk-on and risk-off describe how much risk investors as a group are willing to take at a given moment. When fear is low, money moves into riskier assets with higher expected returns. When fear rises, money moves into assets that are seen as safe. Traders often shorten the pair to RoRo, and the two moods drive stocks, currencies and bonds at once.
The terms became popular after the 2008 financial crisis. In those years whole asset classes rose and fell together in response to one question: is the world getting safer or more dangerous? US market commentary picked up “risk-on, risk-off” for this switching after the Lehman collapse, and the phrase is now used on trading desks worldwide. In this guide I explain what it means, which assets belong to each side, and how you can use it in your own trading.
RoRo can push investors into a herd. In uncertain times, many market participants react to the same news in the same way. A risk-off move can last a day, a week or several months. Sometimes the market is so firmly in one mode that even a strong economic report does not change the direction, and a short move against the trend is used to add to existing positions.
How the news is perceived matters more than the news itself. The same inflation number can trigger risk-on if traders expect lower rates and risk-off if they fear a Fed that stays tight for longer.
Market sentiment drives risk appetite
Risk-on is a positive market mood in which return comes first. Traders and investors buy riskier, higher-yielding investments. Risk-on assets are in demand and tend to move together. You could also say the market is driven by greed.
Risk-off is a negative mood in which protecting capital comes first. Investors look for defensive assets with lower returns but, as they see it, lower risk. Risk-off assets are in demand and move together. The market is driven by fear.
Definition of risk-on
In a risk-on market, investors are confident about the economy and willing to take risk. Stocks tend to rise, while safe havens such as Treasuries and the Japanese yen tend to lag or fall. Bond prices fall and yields rise. Money also flows into higher-yielding currencies such as the Australian dollar (AUD) and the New Zealand dollar (NZD).
Lower-yielding assets rise less or lose value at the same time. This is the environment in which the carry trade tends to work well, as long as volatility stays low: borrowing in a low-yield currency and investing in a high-yield one. What happens when the mood turns is explained further down.
Typical risk-on assets:
- Stock markets: S&P 500, Nasdaq 100, Dow Jones, emerging markets
- Higher-yielding currencies: Australian dollar, New Zealand dollar, Canadian dollar
- Industrial metals: copper and aluminum
- Crude oil
Definition of risk-off
Risk-off is the opposite: the mood is bearish and investors avoid risk. Stock markets tend to fall across the board. The yen and the Swiss franc usually rise. Bond prices rise and yields fall. For US traders, the clearest signal is a rally in Treasuries.
Defensive stocks such as utilities and consumer staples are preferred in a slowdown. Their earnings and dividends are more stable than those of the broad market. They usually have a beta below 1 and steadier dividends, which means they move less than the market. In a slow recession they tend to beat the market, and in strong bull phases they tend to lag. In a sudden panic, however, they can fall almost as hard as everything else, as our data below show.
A risk-off phase often shows up first in the yen. How a Japanese rate move can start such a wave is covered in the guide to the Bank of Japan interest rate decision. The Swiss franc’s reaction to its own central bank is measured in the SNB interest rate decision guide, and for the Australian dollar, a typical risk-on currency, in the RBA interest rate decision guide.
Typical risk-off assets:
- Long volatility: VIX futures and options
- High-grade bonds: US Treasuries, AAA corporate bonds
- Lower-yielding currencies: Japanese yen, Swiss franc, often the US dollar
- Defensive stocks: utilities, consumer staples (they fall less, they rarely rise)
- Gold (often, but not in every panic)
Risk-on and risk-off at a glance
| Feature | Risk-on | Risk-off |
|---|---|---|
| Market mood | Optimistic, willing to take risk | Pessimistic, avoiding risk |
| Money flows into | Return-seeking assets | Safe havens |
| Stocks | Rise (S&P 500, Nasdaq, emerging markets) | Fall broadly, emerging markets often hardest |
| Currencies | AUD, NZD, CAD up; JPY, CHF down | JPY, CHF, often USD up; AUD, NZD, CAD down |
| Commodities | Oil, copper, industrial metals up | Oil and industrial metals down |
| Treasuries | Prices fall, yields rise | Prices rise, yields fall |
| Gold | Weaker or sideways | Often up, but sold in liquidity panics |
| VIX | Low and falling | High and rising |
| US dollar (DXY) | Tends to weaken | Tends to strengthen |
| Carry trades | Work well | Get unwound, which adds volatility |
What the data show: five market shocks since 2008
A textbook table is a starting point, not proof. We checked how the main assets actually moved in five well-known shocks and in one risk-on phase. The figures are price changes from close to close, from Yahoo Finance data. A minus sign for USD/JPY means the yen gained against the dollar.
| Period | S&P 500 | TLT | Gold | USD/JPY | AUD/JPY |
|---|---|---|---|---|---|
| Lehman 2008 | -39.9% | +10.0% | -1.5% | -12.9% | -35.9% |
| US downgrade 2011 | -16.8% | +9.9% | +6.8% | -0.4% | -4.6% |
| Covid crash 2020 | -33.9% | +14.1% | -2.5% | +0.5% | -13.6% |
| Yen carry unwind 2024 | -6.1% | +4.2% | +0.7% | -4.6% | -5.3% |
| Rate shock 2022 | -24.9% | -32.3% | -8.3% | +26.8% | +9.6% |
| Risk-on rebound 2020 | +44.5% | -5.6% | +8.8% | -0.7% | +20.8% |
Periods: Lehman Sep 12 to Nov 20, 2008; US downgrade Jul 22 to Aug 8, 2011; Covid crash Feb 19 to Mar 23, 2020; yen carry unwind Jul 31 to Aug 5, 2024; rate shock Dec 31, 2021 to Oct 12, 2022; rebound Mar 23 to Jun 8, 2020. Closes from Yahoo Finance; TLT is the iShares 20+ Year Treasury Bond ETF (long Treasuries), prices without dividends; gold is the front gold future. Our analysis.
Treasuries were the most reliable shelter, with one big exception. In the four classic shocks, long Treasuries rose by 4.2% to 14.1%, while the S&P 500 fell. In 2022 the shock came from inflation and rising rates. Then stocks and bonds fell together, the 10-year yield climbed from 1.51% to 3.90%, and the “safe” bond ETF lost 32.3%.
Gold rose at first in both big panics, then gave back its gains. After the Lehman collapse it climbed almost 19% by September 22, 2008, but by November 20 it was down 1.5% from the start. In 2020 it rose about 4% until March 9, then fell to 8% below its starting level by March 18 and was still down 2.5% at the stock market low. A likely reason is that investors sold what they could to meet margin calls and raise cash; the World Gold Council describes these mechanics for March 2020. In the 2011 sell-off, gold rose 6.8%.
Defensive stocks usually fell less, but not every time. The utilities ETF XLU lost 28.2% in the Lehman phase, against 39.9% for the S&P 500, and only 0.7% in the 2024 yen shock. In the Covid crash, however, it lost 36.0%, more than the S&P 500 with 33.9%. Defensive stocks guarantee neither gains nor a smaller loss in every crisis, which is why they are not a safe haven.
AUD/JPY was the clearest currency signal. It fell in every classic risk-off episode, by up to 35.9% in 2008, and rose 20.8% in the 2020 rebound. Emerging markets, copper and oil fell even more than US stocks in 2008: the EEM emerging markets ETF lost 50.0%, copper 51.1% and crude oil 51.0%.
Risk-off, then risk-on: the 2020 example
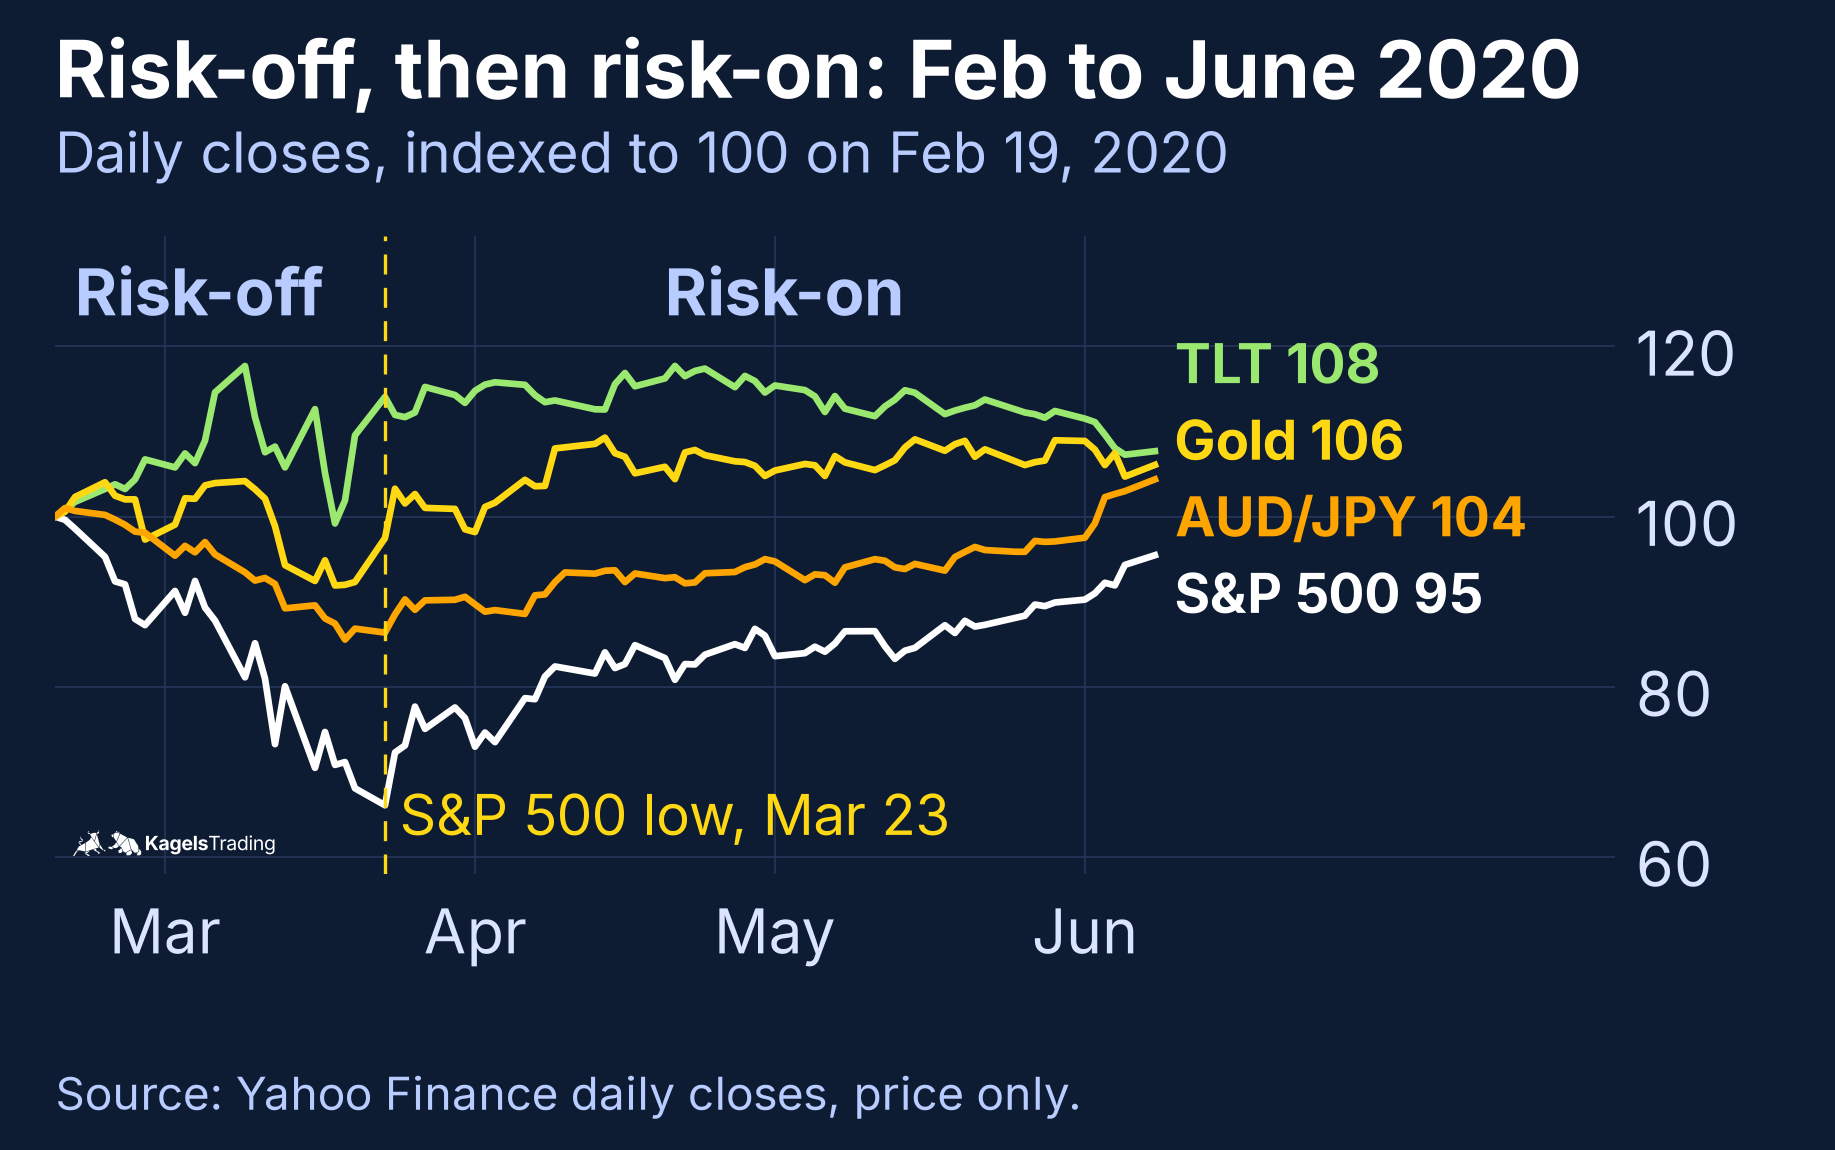
The Covid crash shows both modes within four months. From the record close on February 19, 2020 to the low on March 23, the S&P 500 lost a third of its value. The VIX closed at 82.69 on March 16, 2020, its highest close on record.
 Click to enlarge
Even Treasuries were sold for a few days in mid-March. TLT had risen almost 18% by March 9, then dropped back close to its starting level by March 18 as investors raised cash at any price. Only after the Federal Reserve stepped in with large bond purchases did the classic pattern return. From March 23 to June 8, 2020, the mood was risk-on: the S&P 500 rose 44.5%, AUD/JPY 20.8% and crude oil 63.5%.
Where does the big money flow?
The key question for every trader is where the big money is moving right now. If you know whether fear or greed is in charge, you can judge which market segments are on the offensive and which are on the defensive. How this shift shows up inside the stock market is explained in the guide to sector rotation.
Some trades are popular with large investors because they pay in calm markets. Examples are the carry trade and momentum trades that buy recent winners and sell recent losers. The market alternates between risk-on phases, when money flows into these trades, and risk-off phases, when it flows out.
A simple model of this cycle works like a loop. In risk-on, rising demand lifts profits on these trades and volatility falls. That attracts more money. Higher prices make future returns look thinner, which tempts traders to use more leverage, which creates more demand. In risk-off, the loop runs in reverse.
What happens in a risk-on market?
In normal markets, many participants use leverage to stretch their capital. Asset managers, individual traders and investors buy or sell assets to profit from price moves and volatility. Many use leveraged instruments such as futures, options, leveraged ETFs and ETNs. Leverage raises both the possible return and the possible loss.
In risk-on periods total leverage in the system rises. Most professionals and private investors judge the risks from inside and outside the market to be low. Liquidity is high: trading volume is high and bid-ask spreads are tight. In liquid markets it is easy to buy, and easy to sell when you want to cut risk. Most of the time, markets are in risk-on mode.
Low-yield currencies are sold to fund purchases of high-yield currencies. Selling a low-yield currency and buying a high-yield one at the same time is the carry trade. For US retail traders the leverage is capped by CFTC and NFA rules: the minimum security deposit is 2% of the position for major currency pairs and 5% for all others, which means at most 50:1 and 20:1 (NFA Financial Requirements, Section 12). The NFA decides which currencies count as major and can raise the deposits for a time, and brokers may ask for more.
What happens in a risk-off market?
In a risk-off market sentiment is negative and traders run for safety. The Swiss franc (CHF) and the Japanese yen (JPY) are bought because they are seen as safe havens, so USD/CHF and USD/JPY tend to fall. Our data show that this rule has gaps: in 2008, USD/CHF rose 8.5% as demand for dollars soared, while USD/JPY fell 12.9%.
Risk-off weighs on US stock indices, and the rest of the world follows. Global markets are closely linked. Emerging markets usually fall harder, because investors sell speculative positions first and keep established companies.
USD/CAD usually rises in risk-off. The Canadian dollar is tied to the oil market, and oil tends to fall when the mood turns. In the Lehman phase USD/CAD rose 22.0%, in the Covid crash 9.1%. The Bank of Canada’s own influence on the loonie is measured in the Bank of Canada interest rate decision guide.
Example: the 2016 US election
The night of November 8 to 9, 2016 showed a switch from risk-off to risk-on within hours. As the results pointed to a win by Donald Trump, S&P 500 futures fell by the maximum 5% allowed overnight on the CME and hit limit down (Bloomberg, November 9, 2016). By the next morning the market had turned, and the following week was clearly risk-on.
Our data for November 8 to November 15, 2016 show the classic pattern. The S&P 500 rose 1.9%, USD/JPY 3.6%, USD/CHF 2.4% and USD/CAD 1.2%. Gold fell 3.9%, and long Treasuries lost 6.3% as the 10-year yield jumped from 1.86% to 2.24%. The VIX dropped from 18.74 to 13.37.
Margin, spreads and slippage
Risk-off moves are usually faster than bull moves, so traders must react quickly. Before an event that brokers and banks see as risky, they often raise margin requirements. Wider spreads are also likely, and stop loss and take profit orders can be filled with more slippage. How a stop loss order behaves in a gap is explained in its own guide, and what happens when your account falls below the margin requirement in the margin call guide.
Why safe havens attract money: the carry trade unwind
Carry positions are closed fast when markets get nervous. Some brokers show the daily swap or rollover rate for crosses such as AUD/JPY. A trader who is long AUD/JPY and holds it overnight may receive positive carry when Australian rates are higher, and a short position usually pays. The actual credit or charge depends on the broker’s swap rates and mark-ups, so check the current long and short swap before you trade. When trouble starts, these positions are dumped as quickly as possible, which drives correlations and volatility higher.
August 2024 was a textbook carry unwind. The Bank of Japan ended its negative rate on March 19, 2024 and raised its policy rate to around 0.25% on July 31, 2024 (BoJ statement). Over the next three trading days, USD/JPY fell 4.6% and AUD/JPY 5.3%. On August 5, the Nikkei 225 lost 12.4% in one day, and the S&P 500 was down 6.1% from July 31.
In these phases long volatility and bonds tend to profit. Even after local shocks such as the Brexit vote or the Lehman collapse, investors move into safe havens and defensive assets. High-grade bonds are attractive because their interest payments are fixed by contract and the issuer is very likely to pay them. That does not protect against price losses when rates rise, as 2022 showed.
Risk-off and the black swan
Some traders call an extreme risk-off phase a black swan. Nassim Taleb, who made the term popular, defines a black swan as an event that is very rare, has an extreme impact, and is explained afterwards as if it had been predictable. The Asian crisis of 1997 and the 2008 financial crisis are often named as examples, although Taleb himself called the 2008 crisis a “white swan”, because the fragility of the banks was visible beforehand (The New Yorker interview).
In such periods many market participants close all positions at once. The move usually happens fast, and price swings can be huge because many traders act at the same time. Prices can move further than the trigger event alone would justify, because liquidity dries up and spreads widen. In less liquid markets it becomes difficult and expensive to get in or out.
Risk-off in commodity markets
In commodities, risk-off can cause violent bursts of volatility. Commodities often swing more than stocks, bonds or currencies, even in calm risk-on times. When the mood turns, the moves can become extreme.
Crude oil in 2008 is the best-known example. The front WTI crude oil future closed at $145.29 on July 3, 2008 and at $33.87 on December 19, 2008. That is a drop of 76.7% in less than six months, from the closes in our Yahoo Finance data.
Severe risk-off periods are rare but hard to forget. Wars, crises, natural disasters and other outside shocks have caused many of them. Because markets are usually caught by surprise, preparation is difficult. Banks and regulators spend a lot of time on stress scenarios. Private traders should also have a plan for how to protect their capital, starting with position sizing.
Risk-on and risk-off patterns change over time
The old textbook pattern was clear: risk-on meant a weak US dollar. EUR/USD, GBP/USD, AUD/USD and NZD/USD rose together, while USD/CAD fell. The risk currencies are still closely linked: in our weekly data, AUD/USD and NZD/USD had a correlation of 0.84 from 2007 to November 2026, and 0.88 in the last five years. Where the Australian dollar stands right now is covered in the AUD/USD forecast.
Zero and negative rates changed the pattern after 2008. Many central banks cut rates to zero or below and bought large amounts of their own government bonds (quantitative easing) to lift growth and inflation. Interest rate gaps between currencies shrank, and with them the classic carry trade. The Bank of Japan was the last major central bank to leave negative rates, in March 2024 (BoJ statement).
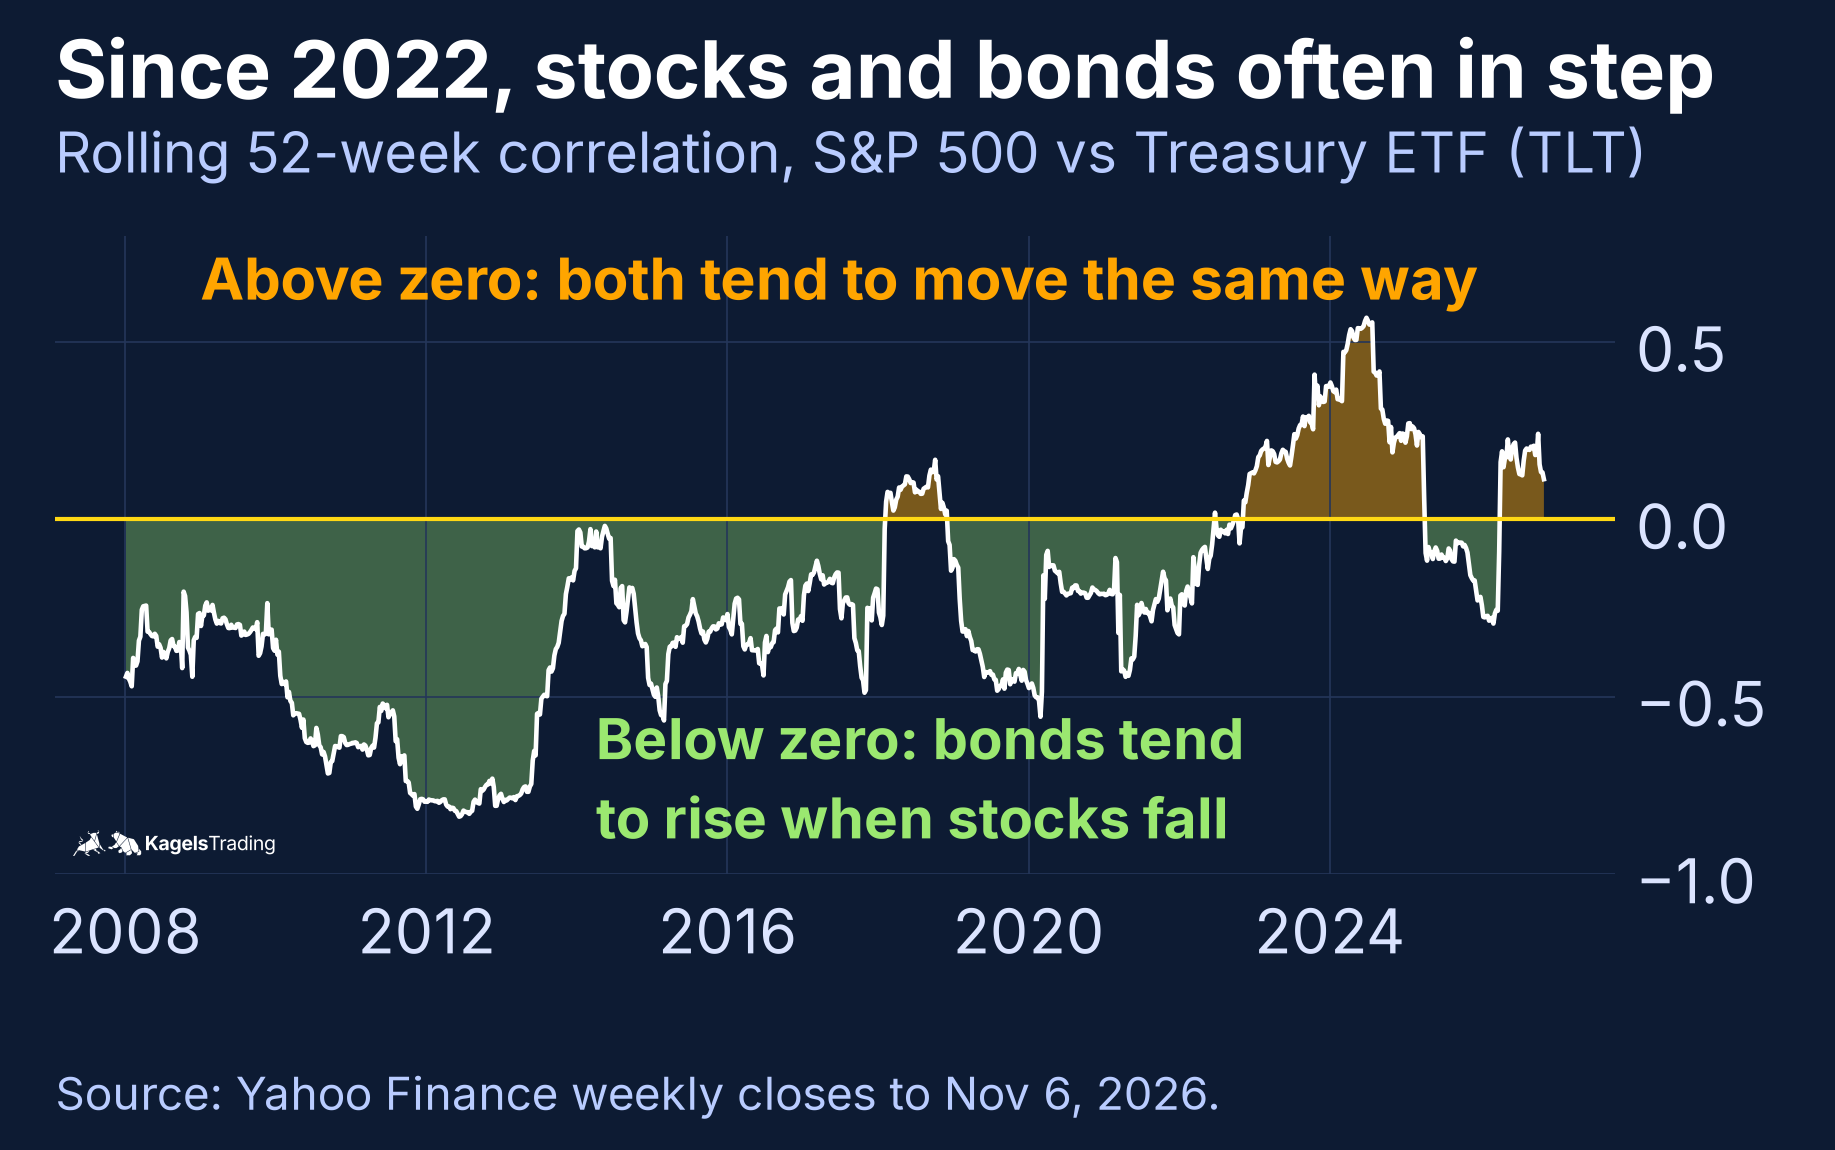
Since 2022 the link between stocks and bonds has changed as well. From 2008 to 2021, the 52-week correlation between the S&P 500 and long Treasuries was below zero in 94% of all weeks. Since January 2022 it has been above zero in 64% of weeks. In plain words: when inflation is the problem, bonds no longer hedge stocks as reliably.
 Click to enlarge
AUD/JPY has also lost some of its signal value. Its weekly correlation with the S&P 500 was 0.62 from 2007 to 2021, but only 0.25 in the five years to November 2026. One likely reason: rate differences between Japan and Australia moved the pair strongly in these years. The rule of thumb still holds: a real risk-off trade is under way when riskier currencies are sold across the board against the yen and the Swiss franc.
How to read risk-on and risk-off: the key indicators
No single signal tells you the current mood, but a few indicators are enough. Look at them together, and look at the direction, not only at the level.
VIX: the fear gauge
The VIX measures the volatility that options traders expect for the S&P 500 over the next 30 days. It is calculated by Cboe from S&P 500 option prices (Cboe VIX) and is often called the fear gauge. Our VIX guide counted 9,265 trading days from January 1990 to September 3, 2026: the index closed below 20 on 62.9% of them.
- VIX below 20: low fear, a typical risk-on environment
- VIX from 20 to 30: rising nervousness, a possible shift to risk-off
- VIX of 30 or higher: stress and panic, only about 8% of trading days since 1990
Watch the direction more than the level. A rising VIX is an early warning of a risk-off shift, often before the stock market falls clearly. In our five shocks, the VIX rose to between 33.57 and 80.86. In the bond market, the MOVE index plays the same role for Treasury volatility.
US Dollar Index (DXY)
The US Dollar Index measures the dollar against a basket of six major currencies. The basket is weighted heavily toward the euro (57.6%), followed by the yen, the pound, the Canadian dollar, the Swedish krona and the Swiss franc (ICE US Dollar Index). Because global debt and trade are largely priced in dollars, many investors buy dollars when they get scared.
- DXY falling: investors sell dollars and buy riskier assets, a risk-on signal
- DXY rising: money flows back into the dollar as a safe haven, a risk-off signal
The strongest signal is the combination. A rising VIX together with a rising DXY is a strong risk-off signal, a falling VIX with a falling DXY confirms risk-on. Be careful when the shock comes from Japan: in the August 2024 carry unwind the DXY fell 1.4%. The rising yen, its second-largest component, contributed to that decline.
Other gauges at a glance
- AUD/JPY: the unofficial RoRo currency pair. Rising means risk-on, falling means risk-off. Its link to stocks is weaker than before 2022, so use it as confirmation.
- 10-year Treasury yield: rising yields usually mean risk-on, falling yields mean money is flowing into bonds. Not in an inflation shock like 2022.
- Copper: often called “Dr. Copper” because it reacts early to the global economy. Rising copper points to risk-on. Our copper price forecast shows the current chart.
- CNN Fear and Greed Index: combines seven measures into one daily reading. How it works is explained in our Fear and Greed Index guide.
On November 11, 2026, the gauges pointed to a calm market. The VIX closed at 17.49, below its long-term median, and the DXY stood at 102.91. AUD/JPY closed at 109.02, and the 10-year yield was close to 5.0% (Yahoo Finance closes). These readings can change within a day, so check them again before you act.
Using risk-on and risk-off in your trading
Knowing the current mode helps you avoid hidden overtrading. In risk-off, many markets move together. A long position in the S&P 500, a long in AUD/USD and a long in copper look like three trades, but they are one bet on risk appetite. If the mood turns, all three lose at the same time.
- Count correlated positions as one. Check whether your open trades all depend on the same risk mood.
- Reduce size when the VIX rises. Higher volatility means wider swings for the same stop distance.
- Expect wider spreads and gaps around elections, central bank meetings and big data releases.
- Do not trust a single safe haven. Our data show that gold, utilities and even Treasuries failed in some shocks.
This is market analysis, not investment advice. Past patterns can break, as 2022 showed. Use risk-on and risk-off as a frame for reading the market, not as a trading signal on its own.
Frequently asked questions about risk-on and risk-off
What do risk-on and risk-off mean?
Risk-on is a market mood in which investors are willing to take risk. They buy assets with higher expected returns, such as stocks, higher-yielding currencies or crude oil. Risk-off is the opposite: investors avoid risk and move into safe havens such as Treasuries, the Japanese yen or the Swiss franc. Together the two terms are often shortened to RoRo.
Which assets benefit in a risk-on market?
In a risk-on market, stocks and other growth assets usually rise. This includes the S&P 500, the Nasdaq and emerging markets, higher-yielding currencies such as AUD, NZD and CAD, and commodities such as oil and copper. Bond prices tend to fall and yields rise, the VIX falls, and carry trades work well.
Which assets benefit in a risk-off market?
In a risk-off market, Treasuries, the yen and the Swiss franc are in demand. The US dollar usually rises too. In our data, long Treasuries rose in four of five shocks since 2008, the exception being the inflation shock of 2022. Gold often helps, but in 2008 and 2020 it first rose and then fell when investors needed cash. Stocks fall broadly, and emerging markets are often hit hardest.
How can I tell whether the market is risk-on or risk-off?
The two most useful gauges are the VIX and the US Dollar Index. A rising VIX together with a rising DXY signals risk-off, both falling confirm risk-on. AUD/JPY adds a third view: it rises in risk-on and falls in risk-off. Looking at all three gives a better picture than any single one.
What triggers a switch from risk-on to risk-off?
Typical triggers are surprises that raise the perceived risk of losses. Examples are geopolitical events such as wars, elections and sanctions, unexpected central bank decisions, weak economic data, and system events such as bank failures. In the extreme case, people speak of a black swan: a rare event with a huge impact that pushes markets into deep risk-off within days.
What is the carry trade and how is it linked to risk-off?
In a carry trade, investors borrow in a low-yield currency and invest in a higher-yield one. A classic example is borrowing yen to buy Australian dollars and earn the rate difference. In risk-off phases these positions are closed quickly. Traders buy back yen in large amounts, which lifts the yen and adds to volatility, as in August 2024.
Have risk-on and risk-off patterns changed over time?
Yes, the classic patterns have shifted since the 2008 crisis. Years of zero and negative rates and quantitative easing shrank the rate gaps that drive carry trades. Since 2022, stocks and Treasuries have often moved in the same direction, so bonds hedge less reliably. A real risk-off trade is still visible when risky currencies are sold across the board against the yen and the Swiss franc.
This US edition is based on our German edition on kagels-trading.de and has been adapted for US readers.
More Markets and Brokers guides
- Open your first account
What Is a Brokerage Account? A US Beginner's Guide
How to open and fund a US brokerage account, cash vs margin, what it costs and what SIPC and FDIC really cover.
- Know what trading really costs
Trading Costs: Every Fee You Pay and How to Cut It
Spread, commissions, SEC and FINRA fees, market data, margin interest and tax, with yearly totals for three trading styles.
- Choose a broker
Interactive Brokers Review 2026: Fees and Platforms
Fees, platforms, investor protection and real futures commissions from a client since 1996.
- Check an offshore broker
PU Prime Review 2026: FCA Warning, Licences and Costs
Which PU Prime company you contract with, what the FCA warning means, and what 1:1000 leverage and the deposit bonus do to your account.
- Check an EU CFD broker
Tradeview Review 2026: Tradeview Europe, MFSA and Costs
What the Malta licence of Tradeview Europe covers, how it differs from the Cayman company, and what the three MetaTrader 5 accounts cost.
- Check CopyX
CopyX Review 2026: Is TAG Markets Copy Trading Legit?
Who runs the TAG Markets copy trading platform, which regulators warn about it, why US residents are excluded and how fast the 12x Amplify account eats your deposit.
- Choose a US forex broker
OANDA Review 2026: Fees, TradingView and US Rules
OANDA from its own pages and NFA records: spreads and fees, TradingView and the demo, FIFO and three penalties.
- Understand your price
Market Makers: Who Sets Your Price and How They Profit
How market makers earn on the spread, who sets prices at German trading venues and what the EU ban on payment for order flow changed.
- Size up a bull market
Bull Market: How Long It Lasts and How to Spot the End
When a rise becomes a bull market, how long the 27 completed S&P 500 bull markets since 1928 lasted and gained, and where the current one stands.
- Read bond market stress
MOVE Index: The VIX of the Bond Market, Explained
What the MOVE index measures, which readings signal stress, how it differs from the VIX and where its limits are.
- Read stock market fear
VIX Index: What the Fear Gauge Measures and Normal Levels
What the VIX measures, which levels have been normal since 1990, how closely it tracks the S&P 500 and how VIX futures, options and ETPs work.
- Read market sentiment
Fear and Greed Index: How It Works, Tested Since 2021
How CNN builds its Fear and Greed Index from seven measures, what the zones mean and how the S&P 500 moved after readings below 20.
- Size up a bear market
Bear Market: How Long It Lasts and How to Spot One
When a decline becomes a bear market, how long the 27 S&P 500 bear markets since 1928 lasted, how long the recovery took and why Bitcoin had three since 2025.
- Trade an index CFD
Index CFDs at Interactive Brokers: Symbols, Costs and Trading
All 13 IBKR index CFDs, margin, stop and close-out worked through for IBDE40, financing, UK hours and the TradingView limit.
- Size an index future
Micro Futures: MES vs MNQ, Tick Values and Risk
MES and MNQ tick values, a worked sizing example from the stop with costs and slippage, and why margin is not your risk.
- Choose between futures and CFDs
Futures vs CFDs: Regulation, Order Execution and Costs
Who your counterparty is, EU, UK and US rules, how stops are triggered on CME and at CFD providers, and booked costs in a DAX example.
- Read the futures curve
Contango vs Backwardation: Futures Curves Explained
What contango and backwardation mean, what rolling does to a position in each case, and real gold, oil and gas curves from 28 October 2026.
- Understand the spot market
Spot Market Explained: Definition and Settlement Times
What a spot market is, why two days is a minimum and not a limit, and when stocks settle at T+1 in the US, EU, UK and Switzerland.
- Choose a silver future
Silver Futures: SI vs Micro Silver vs 100-oz SIC
SI, Micro Silver and the 100-ounce SIC compared by tick value, risk per contract, margin and December 2026 deadlines.
- Read the chip sector
SOX Index: Holdings, Weighting and How to Use It
What the SOX holds, how Nasdaq caps the weights, its largest declines since 2004 against the Nasdaq-100 and which ETFs really track it.
- Read the biotech sector
Nasdaq Biotechnology Index: Holdings, Weighting and Risks
What the NBI holds, how Nasdaq caps the weights, its long declines since 2003 against the Nasdaq-100 and which ETFs really track it.
- Read the transport sector
Dow Jones Transportation Average: Stocks and Dow Theory
The 20 stocks in the Dow transport index, why the share price sets their weight, declines since 1992 and what Dow Theory can and cannot tell you.
- Read the French market
CAC 40 Index Explained: All 40 Stocks, Weights and Trading Hours
All 40 CAC 40 stocks, how Euronext caps the weights at 15 percent, trading hours in Eastern Time and how it differs from the DAX.
- Research stocks
InvestingPro Review: Screener, ProPicks AI and WarrenAI
What the InvestingPro screener, ProPicks AI and WarrenAI do, what Pro and Pro+ cost and who needs which plan.
- Judge a stock-picking newsletter
Motley Fool Stock Advisor Review: Cost and Track Record
What Motley Fool Stock Advisor costs after the first year, how the advertised return is calculated, refund and renewal terms, and who it suits.
- Use the free news portal
Investing.com Review: Free Tools, Data and Limitations
What the free Investing.com portal does well, where the quote prices come from and when InvestingPro is worth paying for.
- Find real AI revenue
AI Stocks 2026: How Listed Companies Earn From AI
Which listed companies earn from AI in cloud, software, infrastructure and chips, disclosed AI revenue against hope, plus AI ETFs and risks.
- Compare AI data center suppliers
AI Infrastructure Stocks: 10 Data Center Suppliers Compared
Ten suppliers for power, cooling, servers and optics compared on free cash flow, customer concentration and next dates, with filters and a two-stock comparison.
- Follow an IPO
Anthropic Stock: IPO Date, Valuation and How to Invest
Where the Anthropic IPO stands, how the valuation compares with revenue and how to get exposure before and after the listing.
- Invest in OpenAI before the IPO
OpenAI Stock: Can You Buy It, and Who Owns OpenAI?
Why there is no OpenAI stock yet, who owns OpenAI, where the IPO stands and how much OpenAI you get through Microsoft or SoftBank.
- Understand a stock split
Stock Splits Explained: Forward and Reverse Splits
What forward and reverse splits change and what they do not, the dates that matter, what happens to options and the $1 listing rule.
- Analyze a company
Fundamental Analysis: 12 Ratios, a Worked Example, 5 Steps
Twelve ratios with formulas and rules of thumb, worked through Microsoft's 2026 annual report, a five-step process and the fundamentals of forex, commodities and crypto.
- Value a stock
Value Investing: Intrinsic Value, Margin of Safety, Traps
Intrinsic value against price, a worked DCF with a sensitivity table, Coca-Cola as a real example, the value premium since 1926 and value traps.
- Value a new listing
SpaceX Stock (SPCX): Valuation, Risks and How to Buy
How to buy SpaceX stock, what the company is worth after the IPO and which risks the lock-up calendar brings.