
COT Report: How to Read Commitments of Traders


Contents
- COT report in 30 seconds
- What is the Commitments of Traders report?
- Choose the right report: Legacy, Disaggregated or TFF
- Read a COT report: one real example, line by line
- COT Index: put a net position in historical context
- Use COT in trading: context before an entry
- Gold and currencies: what the same numbers can mean
- Common mistakes: dates, categories and false precision
- Download the data: a repeatable weekly reading routine
- Frequently asked questions about the COT report
- About the author
Gold commercials are net short by almost a quarter of a million contracts. Does that mean the price must fall? No. In the COT report, the commercial group in gold was net short in 453 of 459 weekly reports from 2 January 2018 to 13 October 2026, in rising and in falling markets. What helps is the comparison with its own history, the right report type and a clear view of the dates. Even an extreme reading can last for months, as the gold and yen examples below show.
This guide shows you how to choose the right COT report, read one real row and redo its calculations yourself. All figures come from the original CFTC records, checked on 23 October 2026, and the download section shows how to repeat the calculations. It is a guide to reading the data, not a trading signal. This article follows our editorial policy.
COT report in 30 seconds
- What it is: a free weekly report of the US regulator CFTC. It shows how the open futures positions in US markets are split between groups of large traders and the rest.
- When: positions as of Tuesday’s close, normally published on Friday at 3:30 p.m. Eastern Time. Federal holidays can move the release by a day or two.
- Which report: Legacy for the classic three groups, Disaggregated for commodities, Traders in Financial Futures (TFF) for currencies, interest rates, stock indices and crypto futures. Never mix futures-only and combined data.
- Main number: the net position of a group, long minus short. The COT Index puts it into its own history on a scale of 0 to 100.
- Main limit: the data is normally three days old when it is published, and extremes can last for months. It describes positioning, not timing.
What is the Commitments of Traders report?
The Commitments of Traders (COT) report is a weekly breakdown of open interest in US futures and options markets by type of trader, published by the Commodity Futures Trading Commission (CFTC).
The data comes from the firms that report their clients’ large positions to the CFTC every day. A trader at or above the reporting level in a market is reported with the whole position. Together, these reportable positions usually make up 70 to 90 percent of open interest, according to the CFTC’s explanatory notes. A market appears only while at least 20 traders are above the reporting level.
The groups describe a trader’s business, not the reason for each position. A trader is classified from the Form 40 it files with the CFTC, and CFTC staff can reclassify it. The CFTC itself says that it does not know the specific reasons for traders’ positions. So a “commercial” is a company whose business uses futures for hedging, but not every one of its contracts has to be a hedge. The CFTC also says it does not analyze the data or make recommendations.
Open interest is not the same as volume. Open interest counts the contracts that are still open at the close: every contract has one long and one short side, so the total long equals the total short. Volume counts how many contracts changed hands during the day. If you want to know what traded during a session, that is the job of volume analysis and order flow, not of the COT report.
Choose the right report: Legacy, Disaggregated or TFF
The CFTC publishes the same open interest in several cuts, and the first job is to pick the right one. The Legacy report is the oldest and shows the familiar three groups. The Disaggregated report splits commodity markets more finely. The Traders in Financial Futures (TFF) report does the same for financial futures.
| Report | Markets | Groups | Good for |
|---|---|---|---|
| Legacy | All reported markets | Commercial, non-commercial, nonreportable | Long histories back to 1986, the classic COT Index |
| Disaggregated | Agriculture, energy, metals and other physical markets | Producer/merchant/processor/user, swap dealers, managed money, other reportables, nonreportable | Separating real producers from banks and funds |
| Traders in Financial Futures | Currencies, interest rates, stock indices, crypto futures | Dealer/intermediary, asset manager/institutional, leveraged funds, other reportables, nonreportable | Currency, bond, index and Bitcoin futures |
| Supplemental | Selected agricultural markets | Adds commodity index traders | Index money in grains and softs |
Producer and merchant labels belong to commodities only. In a yen or S&P 500 future there is no miner or farmer. The TFF report therefore uses dealers, asset managers and leveraged funds (hedge funds and commodity trading advisors) instead. The Legacy report still shows a “commercial” group in financial futures, but it means something different there: banks and institutions that use futures for their own business risk.
Legacy, Disaggregated and TFF each come as “futures only” and as “futures and options combined”. The Supplemental report exists only in the combined version. In the combined version, options are converted into futures equivalents with delta factors from the exchanges. For gold on 13 October 2026 this lifts open interest from 396,345 to 526,276 contracts and changes the commercial net from -242,531 to -236,164. Pick one version and keep it for the whole history, because a series that switches between them creates jumps that never happened.
All figures are added up across all delivery months of a market. The report shows the whole gold futures market at COMEX, not the December contract you may have on your chart. A delivery-month chart and the COT row therefore measure different things.
Read a COT report: one real example, line by line
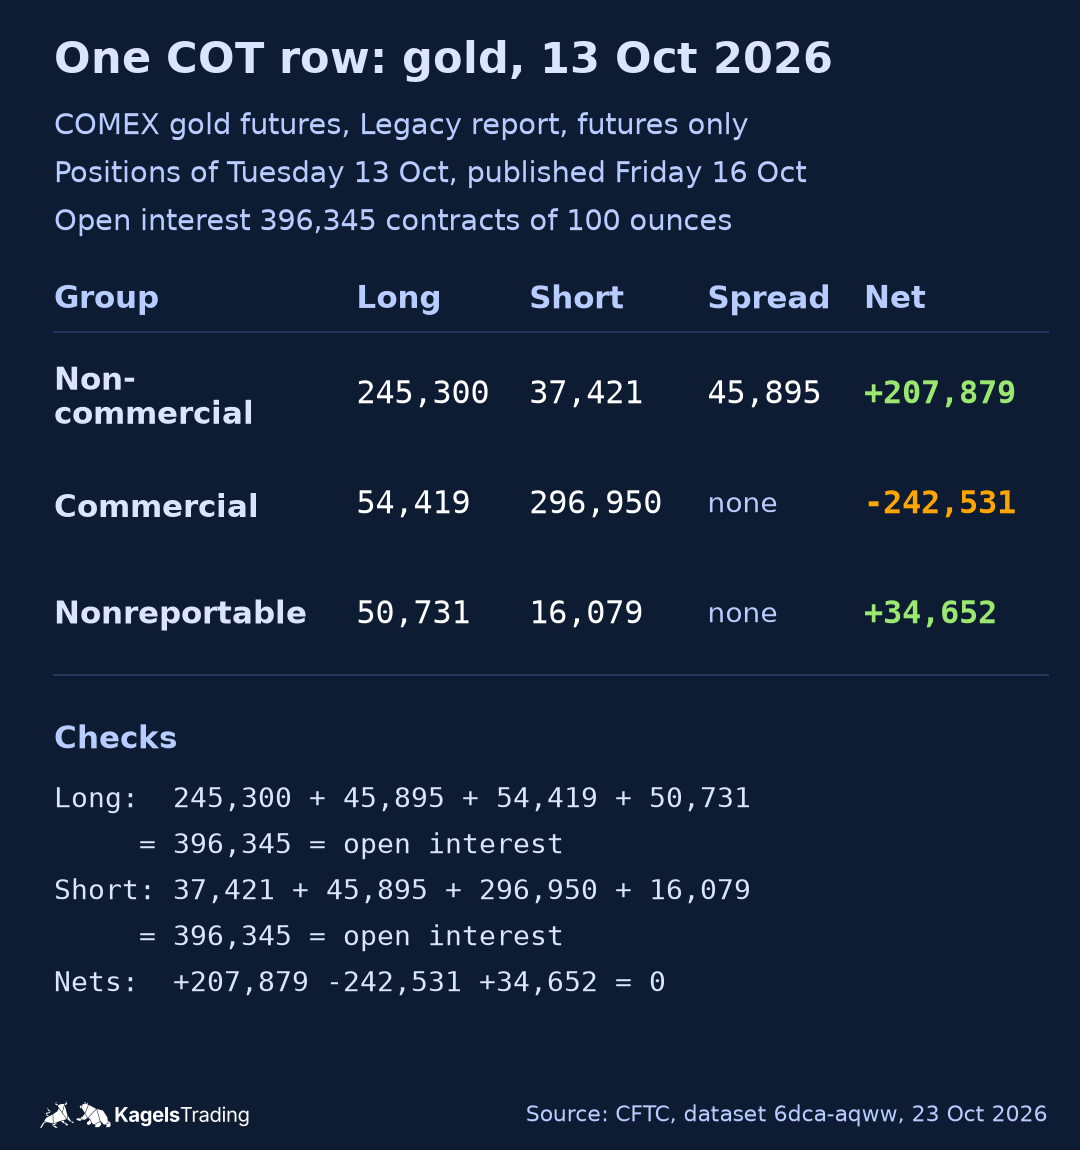
Our example is the Legacy futures-only row for COMEX gold of Tuesday 13 October 2026. It was published on Friday 16 October 2026 at 3:30 p.m. Eastern Time. It is a historical example: a newer report may be out when you read this. The CFTC code 088691 identifies the market, and one contract is 100 troy ounces.
 Click to enlarge
Source: CFTC Public Reporting Environment, Legacy futures only.
| Group (13 Oct 2026) | Long | Short | Spreading | Net |
|---|---|---|---|---|
| Non-commercial | 245,300 | 37,421 | 45,895 | +207,879 |
| Commercial | 54,419 | 296,950 | -242,531 | |
| Nonreportable | 50,731 | 16,079 | +34,652 | |
| Open interest | 396,345 | 396,345 | 0 |
The net position is simply long minus short. For the commercials that is 54,419 minus 296,950, which gives -242,531 contracts, or about 24 million ounces of gold. For the non-commercials it is 245,300 minus 37,421, which gives +207,879. The nonreportable net is 50,731 minus 16,079, or +34,652.
Spreading is not a third direction. It counts the part of a non-commercial trader’s position where long and short futures are equal. A trader with 2,000 long and 1,500 short shows 500 long and 1,500 spreading. Spreading therefore appears on both sides of the total and cancels out in the net. The commercial group has no spreading column in the Legacy report, but that does not mean commercials never hold spreads: their offsetting positions are simply counted in the long and the short column.
Two checks catch almost every copying error. First, the long column plus spreading (counted once) must equal open interest: 245,300 + 45,895 + 54,419 + 50,731 = 396,345. The short side gives the same total. Second, the three net positions must add up to zero: +207,879 - 242,531 + 34,652 = 0. Do not add the long and short totals together, because every contract would then be counted twice.
The nonreportable group is a remainder, not a list of small traders. The CFTC gets this number by subtracting all reported positions from open interest. Nobody knows how many traders are in it or what kind of business they run. It is often called the small speculators, but that is an assumption, not data.
The weekly change line shows who moved. Compared with 6 October 2026, open interest rose by only 236 contracts. The commercial net short shrank by 1,996 contracts, from -244,527 to -242,531, and the non-commercial net long fell by 2,456. Small changes like these say little on their own; they matter when they add up over several weeks.
The Disaggregated report shows who is inside “commercial” in gold. On the same date, producers and merchants were only 18,437 contracts net short, while swap dealers were 224,094 net short. Most of the commercial net short in gold was therefore held by swap dealers, not by mines. The totals do not show why each firm holds its position. On the other side, managed money was 107,089 contracts net long and other reportables 100,790.
COT Index: put a net position in historical context
The COT Index tells you where a group’s net position sits within its own range over a chosen period. The formula is: COT Index = 100 x (current net - lowest net) / (highest net - lowest net). The window includes the current week. Always say which trader group, which report and which window you used, or the number cannot be compared.
Here is the calculation for gold commercials on 13 October 2026, over 52 weeks. The current net is -242,531. The lowest net in the 52 weekly reports up to that date was -297,106 on 13 January 2026, the highest was -185,766 on 26 May 2026. So the index is 100 x (-242,531 + 297,106) / (-185,766 + 297,106) = 100 x 54,575 / 111,340 = 49.0. Over 26 weeks the low was -279,585 on 25 August 2026, which gives 39.5. The same week, two windows, two different readings.
If the highest and the lowest value in the window are the same, the index is undefined. The formula would divide by zero. Do not show such a week as 0 or 50; leave it empty. The same goes for the first weeks of a series, before the window is full.
26 and 52 weeks, and zones below 25 and above 75, are habits of traders, not official levels. The CFTC publishes no index and no buy or sell zones. A short window reacts faster, a long window changes less often. A reading of 0 for gold commercials means they are as net short as at any time in the window, which says something about positioning, but not when the price will turn.
Use COT in trading: context before an entry
COT data is a weekly background check, not an entry rule. It can tell you that one group is unusually crowded on one side. It cannot tell you when that will matter. I use it before the week starts, as one input next to the chart.
- MarketTuesday closeThe positions are fixed at the close of business. This is the date of the data.
- Reporting firmsWednesday morningFirms send the data. The CFTC checks and corrects it.
- CFTCFriday 3:30 p.m. ETThe report is published. Holidays can delay it by a day or two.
- YouYour next sessionOnly now can you use the data. Price may have moved since Tuesday.
Never place a decision on Tuesday using data that only became public on Friday. Historical files show every week, but not when it became public.
A sensible weekly routine has five steps. First, choose one report, one version (futures only or combined) and one group, and keep them. Second, compare the new net position with its history using the COT Index. Third, look at the price chart: is there a trend, a range or a level that the positioning could support or question? Fourth, if you trade, define where your idea is wrong. Fifth, size the position so that this exit costs only what your risk management allows.
The COT step never replaces steps three to five. A position can be right about the crowd and still lose money on the timing. That is why the stop and the position size come from the chart and your account, not from the report.
Gold and currencies: what the same numbers can mean
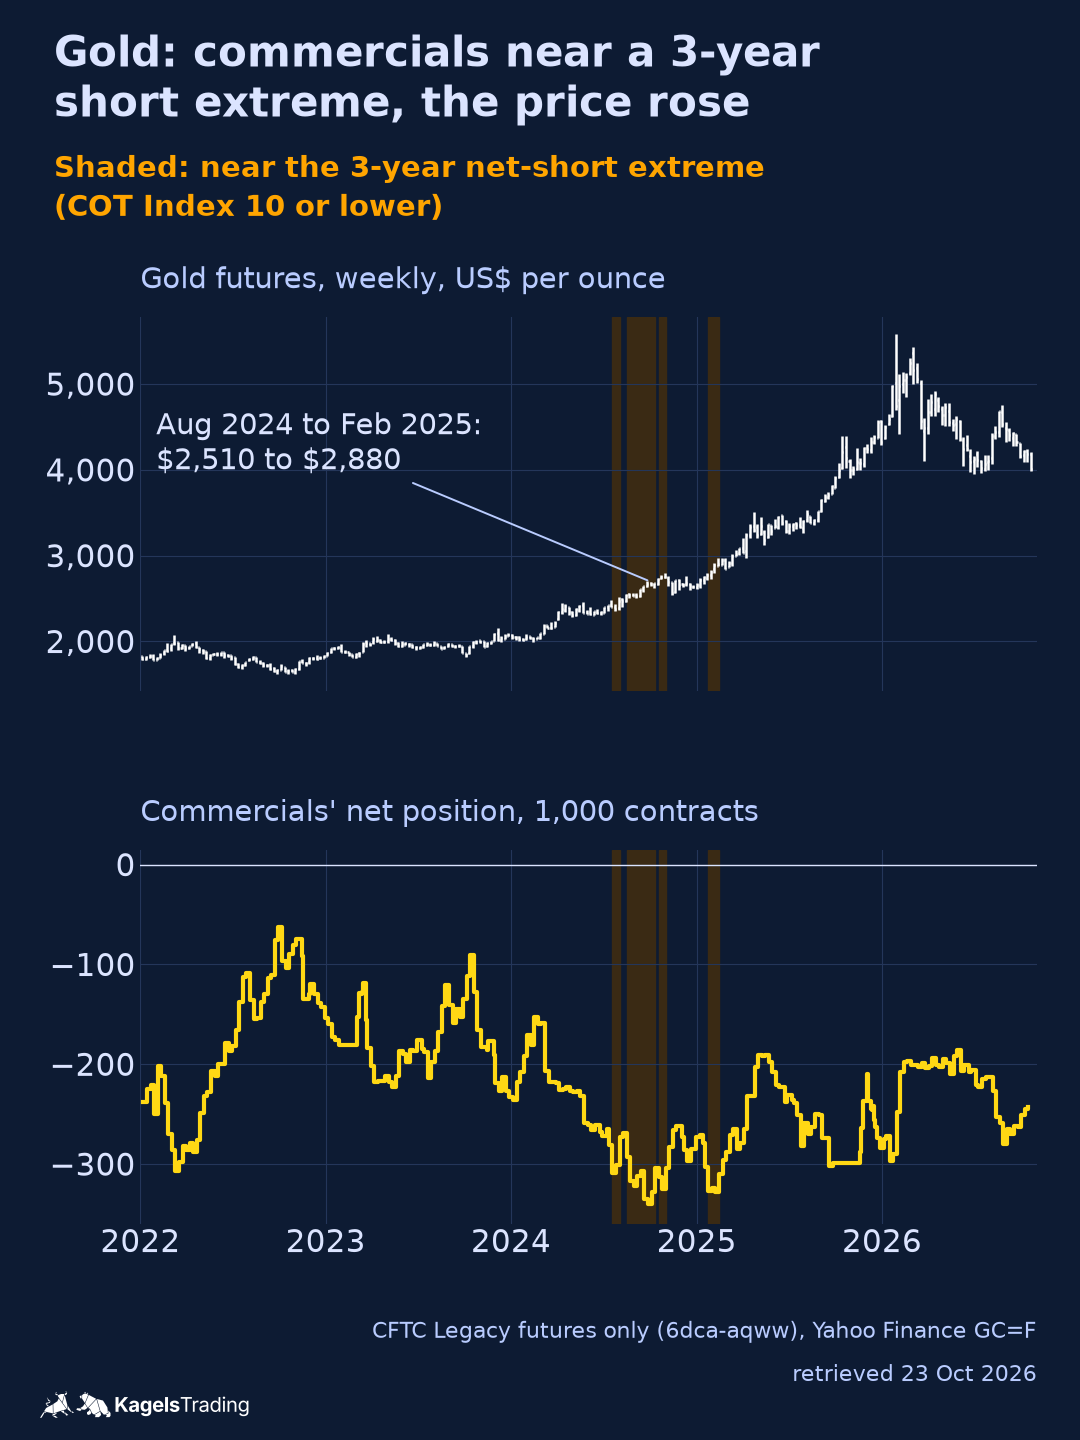
Gold shows why an extreme is not a turning point. From August 2024 to early February 2025, the commercials were at times near their most net short level of the previous three years (156-week COT Index of 10 or lower). The most short reading was -339,706 contracts on 24 September 2024. A reader who took this as a bearish signal would have been wrong: the gold futures price rose from about $2,510 on 13 August 2024 to about $2,880 on 4 February 2025, and later went above $5,000 in January 2026.
 Click to enlarge
Source: Yahoo Finance GC=F (price); CFTC dataset 6dca-aqww (positions).
The Disaggregated numbers suggest one possible mechanism. Managed money and other reportables held large net-long positions in gold futures, and swap dealers held most of the commercial net short. A larger commercial net short can therefore mirror strong buying by funds. The report does not show who traded with whom or why, so this is a reading, not proof. For the current gold picture in the chart, see our gold price forecast.
Currency futures need one extra step: the quotation direction. CME yen futures are quoted in US dollars per yen. The usual spot pair USD/JPY is quoted in yen per dollar. A fund that is net short yen futures therefore profits when USD/JPY rises. Before you compare a COT line with a forex chart, check which way both are quoted, or you will read the chart upside down.
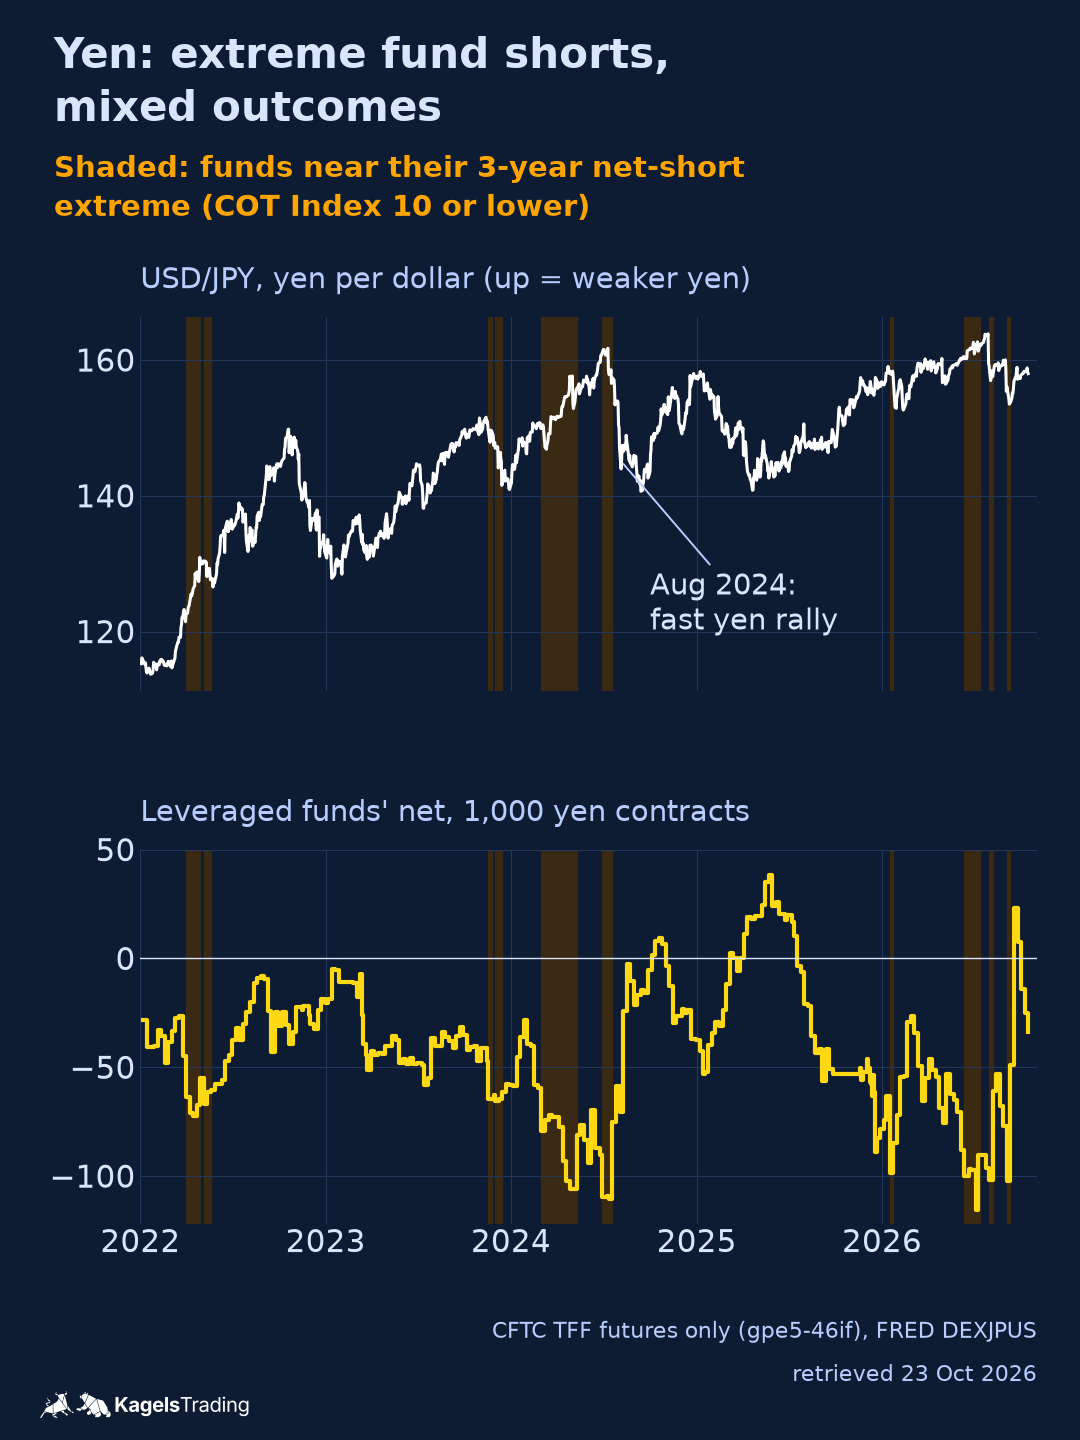
The yen case was right for months, then mixed. Leveraged funds in the TFF report were near three-year short extremes from late February to April 2024 and again in late June and early July 2024. During that time USD/JPY rose from about 150 to above 161, so the crowded short was the profitable side for months. The report of 9 July 2024 showed the most short reading of that run, -110,635 contracts. Under the normal schedule it was published on Friday 12 July. By then USD/JPY had already peaked at 161.73 on 10 July; the yen rally that followed took it to about 145 within a month.
 Click to enlarge
Source: CFTC dataset gpe5-46if; FRED DEXJPUS.
In 2026 the same signal gave a different story. Funds reached -115,400 contracts on 30 June 2026, more short than in 2024, with USD/JPY at about 162.6. Because of the 3 July holiday, that report was only published on Monday 6 July. This time there was no comparable rally: USD/JPY traded between about 153.5 and 163.9 until mid October and stood at 158.0 on 16 October. Our USD/JPY forecast covers the current chart.
Currency futures are only one part of the currency market. Most currency trading happens over the counter between banks, and that does not appear in the COT report. The report shows positioning in US-listed futures, which is useful, but it is not the whole forex market.
Common mistakes: dates, categories and false precision
The most common mistake is to use the wrong date. A COT file lists the observation date, the Tuesday. The data became public on the release date, normally three days later. The day you downloaded it is the retrieval date. Charts built from historical files usually draw the data on the Tuesday, which makes it look available earlier than it was.
The 2025 shutdown shows how large this gap can get. Because of a lapse in US federal funding, the CFTC did not process or publish COT data from 1 October to 12 November 2025. The report with the positions of 30 September 2025 was scheduled for 3 October but came out on 19 November 2025: 50 days after the positions were recorded and 47 days after its scheduled date, and the backlog was cleared with the report of 23 December, released on 29 December, according to the CFTC’s special announcements. Today’s history file shows every week, but in real time there was a gap of seven weeks.
Other common mistakes are about categories and precision:
- Reading net short as bearish. Gold commercials were net short in all but six weekly reports from January 2018 to October 2026. Only the comparison with their own history says anything.
- Treating commercials as insiders. The group includes swap dealers, and the CFTC does not know why each position exists.
- Mixing report versions. Futures only and combined, or Legacy and Disaggregated, give different numbers for the same week.
- Comparing raw contract numbers across markets. 10,000 contracts mean something else in gold than in yen. Use the COT Index or the share of open interest.
- Trusting decimals. An index of 49.0 instead of 39.5 is mainly the result of the chosen window.
Download the data: a repeatable weekly reading routine
The data is free and needs no account. The CFTC’s Commitments of Traders page has the current reports as text and the history as yearly files. The Public Reporting Environment lets you filter by market and download CSV files. Its datasets have fixed names, for example “Legacy - Futures Only” (6dca-aqww) or “TFF - Futures Only” (gpe5-46if).
A simple routine fits in a spreadsheet. Filter one market by its CFTC code, such as 088691 for COMEX gold or 097741 for CME yen. Calculate long minus short for your group in a new column. Then calculate the COT Index with the minimum and maximum of the last 26 or 52 rows. Add a column with the release date, so you never use a number before it was public.
Before you rely on any tool, check one week by hand. Website charts and indicator scripts often use other windows, other report versions or the Tuesday instead of the Friday. Our own numbers come from small Python scripts that download the raw CFTC records and the two public price series, check that every row adds up to open interest and calculate the index. The CFTC keeps no list of historical release dates, so for older holiday weeks we assume a later date rather than an earlier one. The release times to remember: 3:30 p.m. Eastern Time is 19:30 UTC while the US is on summer time and 20:30 UTC in winter. In London that is usually 8:30 p.m., in India 1:00 or 2:00 a.m. on Saturday.
Larry Williams made COT data popular among futures traders. His approach, with its own COT indices for commercials and speculators, is covered in our Larry Williams profile. This guide is about reading the report itself, so that you can check any COT claim, including his, against the original numbers.
Frequently asked questions about the COT report
When is the COT report released?
The COT report is normally released on Friday at 3:30 p.m. Eastern Time. It contains the positions as of the previous Tuesday. When a federal holiday falls in the week, the release can move to Monday, as on 22 June and 16 November 2026. The CFTC’s release schedule lists these dates in advance.
Which COT report should I use?
Use the report that matches your market and keep it. For commodities, the Disaggregated report separates producers from swap dealers and funds. For currencies, bonds, stock indices and crypto futures, use Traders in Financial Futures. The Legacy report is fine for long histories, as long as you know that its “commercial” group is broad.
Is the COT report free?
Yes, the COT data is free. The CFTC publishes every report and the full history on cftc.gov without registration. The Public Reporting Environment adds filters and CSV downloads. You pay only if you buy a third-party tool that charts the data for you.
Is the COT report an entry signal?
No, the COT report is background information, not an entry signal. The data is normally three days old when it is published and only appears once a week. As the gold and yen examples show, an extreme can last for months, and the same reading can be followed by a reversal one year and by a sideways market the next. Entries, stops and position size come from your chart and your risk rules.
Does the COT report cover Bitcoin?
Yes, but only Bitcoin futures on US exchanges regulated by the CFTC. The TFF report of 13 October 2026 lists CME Bitcoin (open interest 20,752 contracts of 5 bitcoin), CME Micro Bitcoin, Ether contracts and several Coinbase Derivatives contracts. On CME Bitcoin, leveraged funds were 5,844 contracts net short. Spot trading and offshore crypto exchanges are not included. Part of the fund short can also belong to basis trades, where a fund holds bitcoin and sells the future against it.
Can I use the COT report for the DAX?
No, there is no CFTC COT data for the DAX. DAX futures trade on Eurex in Germany, which is outside the CFTC’s reporting. EU rules require weekly position reports for commodity derivatives, and exchanges such as Euronext publish them, but these do not cover equity index futures. US index futures such as the S&P 500 appear in the TFF report, but they describe positioning in US markets, not in the DAX.
This English edition is based on our German edition on kagels-trading.de and has been adapted for international readers.
More Market Data & Research Tools guides
- Check the Bloomberg Terminal
Bloomberg Terminal: Cost, Features and Who Needs It
What a Bloomberg Terminal is reported to cost, which products exist, who should pay for one and the cheaper tools private investors use instead.
- Find a cheaper research tool
Bloomberg Terminal Alternatives for Individual Traders
Koyfin, Finviz, Barchart, TradingView and InvestingPro compared on data timeliness, fundamentals, screening and price, plus the institutional alternatives.