
AI Infrastructure Stocks: 10 Data Center Suppliers Compared


Contents
- AI infrastructure stocks in 30 seconds
- What are AI infrastructure stocks?
- The ten AI infrastructure stocks compared
- Data center stocks: where the ten suppliers sit in the supply chain
- Compare two stocks side by side
- The ten companies in profile
- Four groups instead of a ranking
- Work out the P/E ratio yourself: which earnings figure to use
- Check the chart: what traders look at in these stocks
- When do AI infrastructure stocks report next?
- Shared risks of the ten stocks
- Methodology and sources
- Conclusion: where the AI buildout really turns into cash
- Frequently asked questions about AI infrastructure stocks
- About the author
Nvidia sells the computing power, but no AI data center runs without power, cooling and connectors. That is where the second-tier suppliers earn their money. This page compares ten of them side by side, checked against their original reports up to 8 November 2026.
Growth alone says little. Some turn it into a lot of free cash flow, two currently spend more money than the business generates, and three depend heavily on a few customers. This article follows our editorial policy.
AI infrastructure stocks in 30 seconds
- What they are: AI infrastructure stocks are shares of companies that equip AI data centers with power, cooling, server manufacturing and connectivity, without selling AI models or the main AI processors themselves.
- The ten stocks: Comfort Systems USA, Amphenol, nVent, Powell Industries, Astera Labs, Credo, Celestica, Coherent, Modine and Lumentum.
- The finding: the buildout is real, but not everyone turns it into cash. At Coherent and Modine free cash flow was negative in the latest quarter, and at Astera Labs, Credo and Celestica one direct customer accounts for more than a third of revenue.
- Special case: Lumentum is set to be acquired by Marvell. The agreement was signed on 1 November 2026, and nothing has closed.
- As of: company figures checked on 8 November 2026, SEC filings re-checked on 10 November 2026. The four groups are an editorial judgment, not a ranking and not a buy recommendation.
What are AI infrastructure stocks?
AI infrastructure stocks are shares of companies that equip AI data centers with power, cooling, server manufacturing and connectivity, without selling AI models or the main AI processors themselves.
The term is not an official category. We use it for the second and third tier behind the chip companies. For the broad overview of the theme, see our guide to AI stocks. The chipmakers themselves are covered in our overview of semiconductor stocks.
Why the selection is only a slice: these are ten checked companies, not a complete list of the industry. None of them reports a separate pure AI revenue figure. Segments such as “IT datacom” or “Data Centers” also include classic cloud and telecom business, so we do not add them up into an AI total.
The ten AI infrastructure stocks compared
Mind the periods: the table shows the latest reported period for each stock. The periods differ because fiscal years (FY) end at different times. A Credo quarter is therefore not the same quarter as an Amphenol quarter. For customers, only the latest-quarter direct-customer share is comparable.
Filter and sort
Growth comes from different quarters and partly from acquisitions (Amphenol organic +37%). The sort order is a rough overview, not a quality ranking.
| Stock | Revenue growth | Free cash flow | Largest customer |
|---|---|---|---|
| Comfort Systems USA FIXConstruction and building services · Cooling and thermal | +53.7%Q3 2026 | $805.6 millionQ3 2026; company definition incl. $6.1 million asset sales; without: $799.5 million | largest customer 11% to 13%, annual reportlargest customer 12.8% of 2025 revenue (annual report); technology customers 60.8% of Q3 revenue |
| Amphenol APHConnectors and cables | +65% (organic +37%)Q3 2026 | about $1.6 billionQ3 2026; as reported by the company | no customer above 10%, annual reportno customer with 10% or more in 2025 (annual report); not updated after the 2026 acquisitions |
| nVent NVTPower distribution · Cooling and thermal | +44% (organic +44%)Q3 2026 | $268 millionQ3 2026; as reported by the company | largest customer 11% to 13%, annual reportlargest customer about 11% of 2025 revenue (annual report); no newer figure found for 2026 |
| Powell Industries POWLPower distribution | +9%Q3 FY2026 | $184.7 million9 months FY2026; our calculation: operating cash flow minus capital expenditures | no customer above 10%, annual reportno customer above 10% of revenue in FY2025 and FY2024; no newer data. A single data center order of more than $400 million alone equals about one sixth of the $2.4 billion backlog. |
| Astera Labs ALABChips and connectivity | +154%Q3 2026 | $133.9 millionQ3 2026; our calculation: nine months minus half year, operating cash flow minus capital expenditures | one direct customer above 25%, latest quarterlargest direct customer 53% (Q3 2026, prior year 23%); three customers with 10% or more each, 77% together |
| Credo Technology CRDOChips and connectivity · Connectors and cables | +114.7%Q1 FY2027 | $82.9 millionQ1 FY2027; our calculation: operating cash flow minus capital expenditures | one direct customer above 25%, latest quartertwo direct customers with 43% and 28%; by end customer 33%, 28%, 13% and 10% (Q1 FY2027) |
| Celestica CLSServer and rack manufacturing | +83%Q3 2026 | $127.5 millionQ3 2026; company non-GAAP figure, net of capital expenditures; supported by receivable sales | one direct customer above 25%, latest quarterthree direct customers with 35%, 17% and 14%; top 10 = 85% (Q3 2026) |
| Coherent COHROptical components | +49.9%Q1 FY2027 | -$868.2 millionQ1 FY2027; our calculation: operating cash flow minus capital expenditures | two customers above 10% each, exact share opentwo customers above 10% each (FY2026), exact shares not reported in a comparable way |
| Modine MODCooling and thermal | +35% (incl. the spun-off business)Q2 FY2027 | -$140.6 millionQ2 FY2027; as reported by the company | largest customer 11% to 13%, annual reportnot quantified for the new company. In FY2026, still with the spun-off business, one technology customer accounted for about 11% of revenue and the ten largest for 49%. The 10-Q names the risk of greater concentration on a few large customers or projects |
| Lumentum LITEOptical components | +136.5%Q1 FY2027 | $37.9 millionQ1 FY2027; our calculation: operating cash flow minus capital expenditures (10-Q) | end-customer share, fiscal yeartwo end customers with 26.6% and 15.0% (fiscal 2026); an end-customer share, not a direct-customer share, so not directly comparable |
None of the ten stocks meets all the selected conditions at once. Remove one condition or reset the filters.
How to read free cash flow: free cash flow (FCF) is roughly the money left after investment. Each cell says whether the figure follows the company’s definition, sometimes with special items, or our own calculation as operating cash flow minus capital expenditures. The figures are therefore only partly comparable. All evidence is in the list of sources, and share prices are in the live chart further down.
Data center stocks: where the ten suppliers sit in the supply chain
Same buildout, different places: the ten companies work at five stages of the same buildout. The assignment follows their own business descriptions. It says nothing about whether they supply each other.
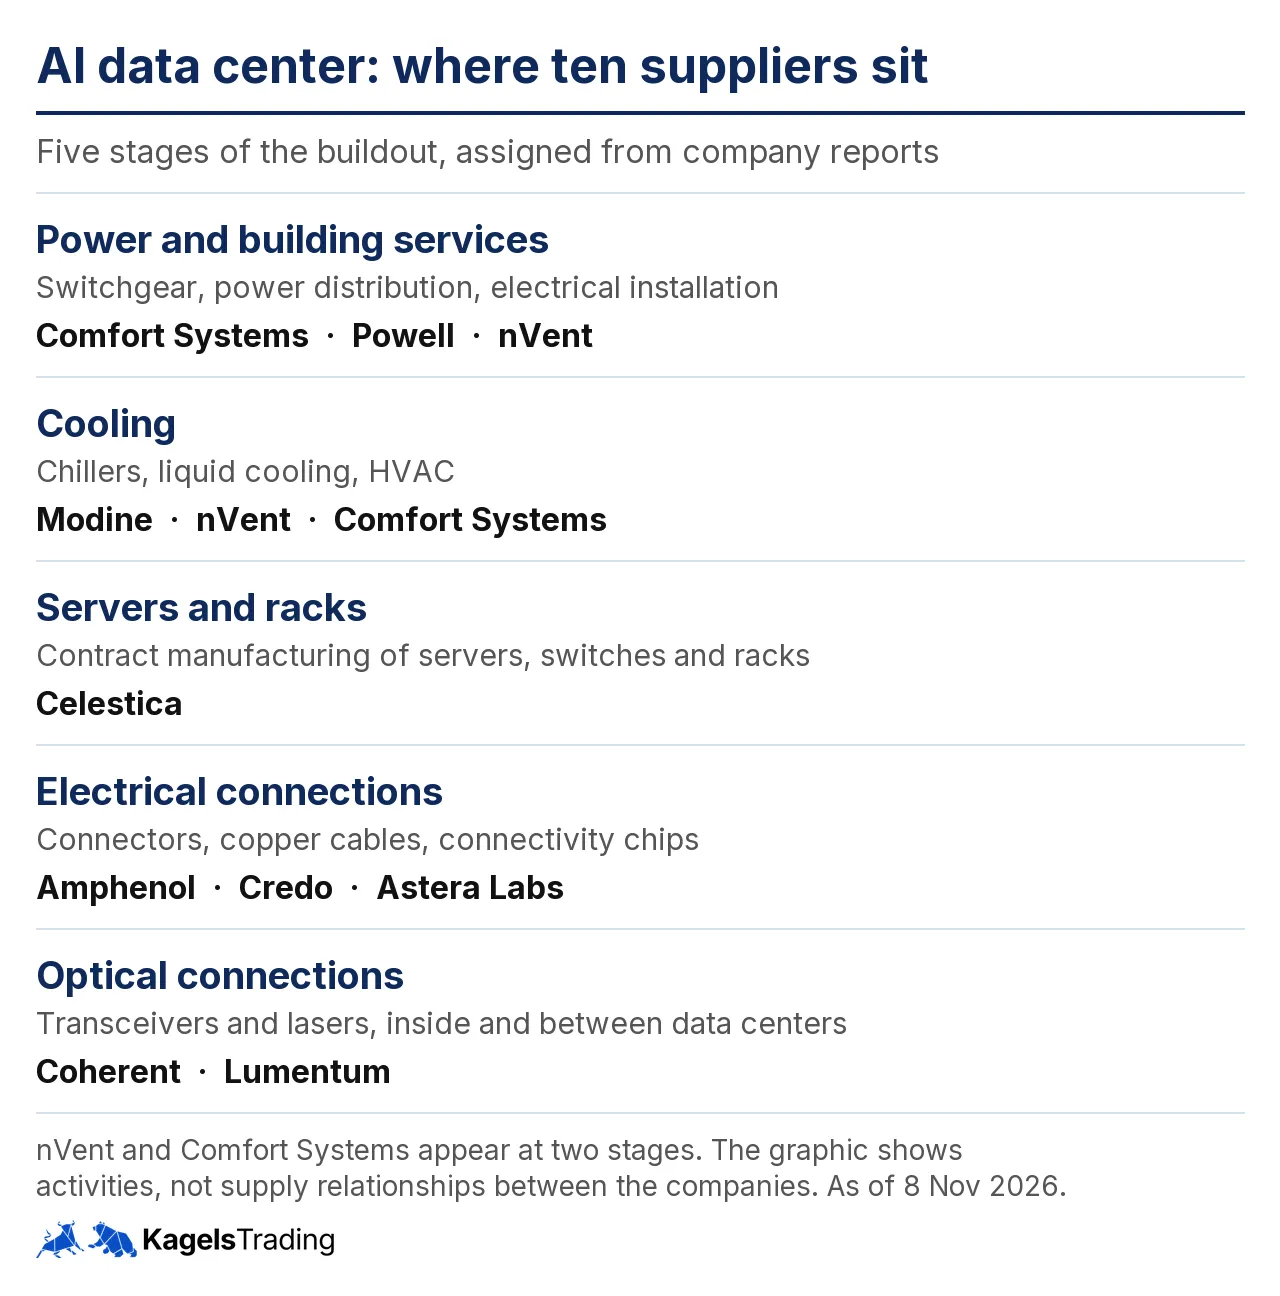
The ten suppliers by what they do in the data center. Our own assignment based on company reports, as of 8 November 2026.
- Power and building services: Comfort Systems installs electrical and HVAC systems in large buildings, Powell builds switchgear, nVent supplies enclosures, power and connection products.
- Cooling: Modine supplies chillers and cooling units, nVent liquid cooling, Comfort Systems the on-site HVAC work.
- Servers and racks: Celestica builds switches, servers and complete racks under contract.
- Electrical connections: Amphenol supplies connectors and also fiber optics, Astera Labs chips for connections inside the server and rack, Credo active electrical cables up to 7 meters and increasingly optics.
- Optical connections: Coherent and Lumentum supply transceivers and lasers. Light carries the data inside the data center and between sites.
Commodities and the sector move along: cables and switchgear also depend on metal, so our copper price forecast can be a useful side view. For sentiment in chip stocks, the SOX index is worth a look. Neither replaces the reports of the individual companies.
Compare two stocks side by side
Pick two stocks: every figure keeps its own period and its own definition. A higher number is therefore not automatically better, and a figure from the latest quarter cannot be weighed against an annual figure.
The ten companies in profile
Three layers kept apart: each profile separates facts the company reported, management guidance and our assessment. “Our calculation” means derived from reported figures. All amounts are in US dollars.
Comfort Systems USA (FIX): installs HVAC, cooling and electrical systems in data centers and other large buildings
Latest: Buyback authorization raised on 4 Nov 2026: 1.0 million shares are available again; since inception 11.75 million shares were bought back for $1.71 billion. Quarterly dividend raised to $1.00. CFO Bill George will retire after the 2026 annual report; Julie Shaeff will succeed him.
- Q3 2026 revenue $3.77 billion, up 53.7% year over year by our calculation; earnings per share $13.91.
- Backlog $17.81 billion, of which $17.39 billion on a same-store basis.
- Technology customers accounted for 60.8% of Q3 revenue and new construction for 76.2%. That is not a pure AI share.
- Revenue and growth
- $3.77 billion, +53.7% (Q3 2026)
- Operating margin
- GAAP operating margin 16.6%; no comparable adjusted margin
- Free cash flow
- $805.6 million (Q3 2026). Company definition, including $6.1 million of proceeds from asset sales; operating cash flow minus capital expenditures gives $799.5 million. Billings in excess of costs and deferred revenue ($3.87 billion) support the cash flow.
- Earnings per share
- $46.31 (trailing twelve months, GAAP)
- Balance sheet
- Cash $2.16 billion, debt about $49.6 million (excluding leases)
- Customers
- largest customer 11% to 13%, annual report: largest customer 12.8% of 2025 revenue (annual report); technology customers 60.8% of Q3 revenue
- Main risk
- project margins on fixed-price work, a decline in billings in excess of costs
Management guidance: The results release gives no full-year earnings per share guidance. The backlog and cash flow in the facts above are reported figures, not forecasts.
Our assessment: Backlog and net cash speak for Comfort Systems. Against the cash, though, stand $3.87 billion of billings in excess of costs, and project margins can normalize.
The next things to check at Comfort Systems USA are billings in excess of costs against work completed, cost revisions, same-store backlog. Next date: next results probably February 2027 (not confirmed). Sources: 1, 2, 3, 4, 5, 6, 7.
Amphenol (APH): makes connectors, fiber-optic and power interconnects for servers, networks and industry
Latest: Quarterly dividend raised to $0.15 from Q4, new $4 billion buyback program from 1 Jan 2027. Three more acquisitions are signed and expected to close by the end of Q1 2027.
- Q3 2026 revenue about $10.2 billion, up 65%, organic growth 37%; adjusted operating margin 29.7%.
- Orders $12.2 billion, book-to-bill 1.19 (orders divided by revenue).
- IT datacom was about 36% of 2025 revenue (annual report). A third-party transcript of the Q3 call cites 48% for Q3 2026; we have not matched it against the original. The term covers more than AI. All figures are split-adjusted (2-for-1 in September 2026).
- Revenue and growth
- about $10.2 billion, +65% (organic +37%) (Q3 2026)
- Operating margin
- GAAP operating margin 29.5%, adjusted 29.7%
- Free cash flow
- about $1.6 billion (Q3 2026). As reported by the company.
- Earnings per share
- $2.30 (trailing twelve months, GAAP, split-adjusted, our sum); $2.65 (2026 guidance midpoint, GAAP); $2.83 (2026 guidance midpoint, adjusted)
- Balance sheet
- Cash and short-term investments $5.30 billion, debt $17.87 billion
- Customers
- no customer above 10%, annual report: no customer with 10% or more in 2025 (annual report); not updated after the 2026 acquisitions
- Main risk
- purchase prices, integration, debt
Management guidance: 2026: revenue $36.9 billion to $37.1 billion; earnings per share $2.64 to $2.66 GAAP and $2.82 to $2.84 adjusted. This excludes the three acquisitions not yet closed (AdvancedPCB, Humanetics Sensors, Dexgreen).
Our assessment: Organic growth plus acquisitions is attractive. But the higher debt limits the defensive effect of the broad business mix.
The next things to check at Amphenol are organic IT datacom growth, net debt, book-to-bill. Next date: next results probably late January 2027 (not confirmed). Sources: 8, 9, 10, 11, 12.
nVent (NVT): supplies power distribution, enclosures and liquid cooling for data centers and industry
- Q3 2026 revenue $1.51 billion, up 44%, organic growth also 44%; adjusted operating margin 22.1%.
- Remaining performance obligations $2.6 billion, mostly due within twelve months.
- Maverick Power was bought on 1 Oct 2026 for about $1.75 billion in cash plus up to $550 million in contingent payments.
- Revenue and growth
- $1.51 billion, +44% (organic +44%) (Q3 2026)
- Operating margin
- GAAP operating margin 18.6%, adjusted 22.1%
- Free cash flow
- $268 million (Q3 2026). As reported by the company.
- Earnings per share
- $4.12 (trailing twelve months, GAAP, continuing operations, our sum); $4.555 (2026 guidance midpoint, GAAP); $5.375 (2026 guidance midpoint, adjusted)
- Balance sheet
- At 30 Sep: cash $1.12 billion, debt $2.18 billion, already including the $800 million notes issued on 29 Sep (6.15%, due 2036). On 1 Oct nVent bought Maverick for about $1.75 billion, financed with the notes, a $600 million term loan and its credit facility
- Customers
- largest customer 11% to 13%, annual report: largest customer about 11% of 2025 revenue (annual report); no newer figure found for 2026
- Main risk
- integration of Maverick Power, rising debt
Management guidance: 2026: revenue up 48% to 49%, organic growth 38% to 39%; earnings per share $4.54 to $4.57 GAAP and $5.36 to $5.39 adjusted.
Our assessment: Organic growth is strong. Now nVent has to show that the Maverick purchase earns the larger amount of capital tied up.
The next things to check at nVent are Maverick financing, pro forma debt, organic growth. Next date: next results probably early February 2027 (not confirmed). Sources: 13, 14, 15, 16, 17, 18.
Powell Industries (POWL): builds switchgear and electrical systems for utilities, industry and data centers
Note on timing: All figures are as of 30 Jun 2026. Results for the fourth fiscal quarter come on 16 Nov 2026 after the US market close.
- Q3 FY2026 revenue $311.7 million, up 9%; earnings per share $1.42 (after the 3-for-1 split).
- Orders $934 million, book-to-bill 3.0 (orders divided by revenue); backlog $2.4 billion, up 69%.
- About $800 million of data center projects won in nine months. That is orders, not AI revenue.
- Revenue and growth
- $311.7 million, +9% (Q3 FY2026)
- Operating margin
- GAAP operating margin 20.6% (our calculation); gross margin 30.6%
- Free cash flow
- $184.7 million (9 months FY2026). Our calculation: operating cash flow minus capital expenditures. Contract payments affect the figure.
- Earnings per share
- $5.22 (trailing twelve months, GAAP, split-adjusted, our sum)
- Balance sheet
- Cash $633.6 million at 30 Jun 2026; credit facility undrawn, no conventional debt reported
- Customers
- no customer above 10%, annual report: no customer above 10% of revenue in FY2025 and FY2024; no newer data. A single data center order of more than $400 million alone equals about one sixth of the $2.4 billion backlog.
- Main risk
- large projects, delays, project mix
Management guidance: No numerical full-year guidance. The orders and backlog in the facts above are reported figures, not guidance.
Our assessment: The backlog has grown strongly, and revenue follows with a lag. What matters is margin and the timing of execution, not a single record order.
The next things to check at Powell Industries are data center deliveries, project margins, cancellations in the backlog; about $1.3 billion of the $2.4 billion backlog is expected to become revenue within twelve months. Next date: Q4 FY2026 results on 16 Nov 2026 after the US market close (announced on 3 Nov). Sources: 19, 20, 21, 22, 23.
Astera Labs (ALAB): designs chips for the connections inside AI servers and racks (retimers, switches)
Latest: Q3 results on 3 Nov 2026: revenue of $584.9 million beat its own guidance of $540 million to $560 million; the largest direct customer rose to 53%.
- Q3 2026 revenue $584.9 million, up 154% year over year and 49% quarter over quarter, above its own guidance of $540 million to $560 million.
- GAAP operating margin 30.6%, adjusted 44.7%; earnings per share $0.99 (GAAP) and $1.32 (adjusted).
- Scorpio switches are the largest product family for the first time; the company does not give revenue by product line.
- One direct customer now accounts for 53% of quarterly revenue and 58% of receivables. Direct customers can be contract manufacturers buying for end customers; the company does not name the end customers.
- Revenue and growth
- $584.9 million, +154% (Q3 2026)
- Operating margin
- GAAP operating margin 30.6%, adjusted 44.7%
- Free cash flow
- $133.9 million (Q3 2026). Our calculation from nine months minus the half year: operating cash flow $179.2 million minus capital expenditures $45.3 million.
- Earnings per share
- $2.51 (trailing twelve months, GAAP, our sum); $3.31 (trailing twelve months, adjusted, our sum)
- Balance sheet
- Cash and marketable securities $1.38 billion, no debt reported
- Customers
- one direct customer above 25%, latest quarter: largest direct customer 53% (Q3 2026, prior year 23%); three customers with 10% or more each, 77% together
- Main risk
- customer concentration, customer warrants and stock-based compensation
Management guidance: Q4 2026: revenue $730 million to $750 million, adjusted earnings per share $1.62 to $1.66 (GAAP $1.13 to $1.17).
Our assessment: The ramp is confirmed and faster than guided. At the same time the dependence has grown: more than half of revenue goes through one direct customer.
The next things to check at Astera Labs are Scorpio switch ramp, breadth of end customers, warrants and stock-based compensation. Next date: Q4 2026 probably February 2027 (not confirmed). Sources: 24, 25, 26, 27, 28.
Credo Technology (CRDO): designs chips and active electrical cables for fast connections between AI servers
- Q1 FY2027 revenue $479.0 million, up 114.7%; GAAP and adjusted gross margin 64.5% and 68.0%.
- Earnings per share $0.67 (GAAP) and $1.20 (adjusted).
- Two direct customers delivered 43% and 28% of quarterly revenue.
- Revenue and growth
- $479.0 million, +114.7% (Q1 FY2027)
- Operating margin
- GAAP operating margin about 25.2% (our calculation), adjusted 48.2%
- Free cash flow
- $82.9 million (Q1 FY2027). Our calculation, well below adjusted net income of $236.3 million; stock-based compensation $88.0 million.
- Earnings per share
- $2.81 (trailing twelve months, GAAP, our sum); $4.10 (trailing twelve months, adjusted, our sum)
- Balance sheet
- Cash and marketable securities $764.3 million; DustPhotonics: total consideration about $1.25 billion, of which $735.6 million net cash outflow after cash acquired
- Customers
- one direct customer above 25%, latest quarter: two direct customers with 43% and 28%; by end customer 33%, 28%, 13% and 10% (Q1 FY2027)
- Main risk
- loss of a large customer, architecture changes, dilution
Management guidance: Q2 FY2027: revenue $525 million to $535 million, adjusted gross margin 67% to 69%.
Our assessment: Profitability is high, but free cash flow is well below adjusted net income. The picture gets stronger if growth turns into higher free cash flow and the customer base broadens.
The next things to check at Credo Technology are customers A and B, working capital, free cash flow after integrating DustPhotonics, prepayments for manufacturing capacity ($102.4 million more in FY2027). Next date: Q2 FY2027: date not yet confirmed by the company; prior year on 1 Dec. Sources: 29, 30, 31, 32, 33.
Celestica (CLS): manufactures servers, network switches and complete racks for large cloud customers
Latest: New share buyback program from 3 Nov 2026 for up to 3.13 million shares (about 2.5% of the public float). Under the previous program, which expired on 2 Nov 2026, 205,184 shares were bought by 20 Oct 2026; the release gives no final total.
- Q3 2026 revenue $5.83 billion, up 83%; adjusted operating margin 8.5%.
- The CCS segment delivers 84% of revenue. Within CCS, HPS accounts for about 40% of total revenue. Neither is a pure AI figure.
- Three customers account for 35%, 17% and 14% of revenue, the ten largest for 85%.
- Revenue and growth
- $5.83 billion, +83% (Q3 2026)
- Operating margin
- GAAP operating margin 7.9%, adjusted 8.5%
- Free cash flow
- $127.5 million (Q3 2026). Free cash flow as reported by the company (non-GAAP). Nine months: $412.5 million, with $700.8 million of sold receivables still outstanding, so the receivables program noticeably supports the cash flow.
- Earnings per share
- $10.60 (trailing twelve months, GAAP, our sum, including effects of a total return swap); $11.55 (2026 guidance, adjusted); $21.50 (2027 target, adjusted)
- Balance sheet
- Cash $3.96 billion against about $0.82 billion of borrowings and finance lease obligations; the cash comes largely from a share offering (net $3.39 billion, August 2026)
- Customers
- one direct customer above 25%, latest quarter: three direct customers with 35%, 17% and 14%; top 10 = 85% (Q3 2026)
- Main risk
- customer bargaining power, program shifts, funding the growth
Management guidance: 2026: revenue $21.0 billion, adjusted earnings per share $11.55, free cash flow $460 million (previously $600 million). 2027: revenue $40 billion, adjusted operating margin 9%, earnings per share $21.50, capital expenditures $1.5 billion to $2.0 billion. For 2027 the company expects a net cash outflow because of higher working capital and higher capital expenditures.
Our assessment: The 2027 target is ambitious: almost twice the revenue of 2026. Celestica itself expects a net cash outflow for it, and three customers carry two thirds of revenue. Later cuts in orders would hit cash flow and earnings at the same time.
The next things to check at Celestica are 2027 ramps, cash flow after capital expenditures, receivable sales, customer shares. Next date: next results probably late January 2027 (not confirmed). Sources: 34, 35, 36, 37.
Coherent (COHR): supplies optical transceivers, lasers and materials for data center and telecom networks
Latest: Q1 results on 4 Nov 2026: revenue of $2.37 billion in the upper half of guidance, earnings above it, free cash flow of -$868 million in one quarter.
- Q1 FY2027 revenue $2.37 billion, up 49.9%; excluding the businesses sold in 2025 and 2026 (Aerospace & Defense, Munich) the company gives pro forma growth of 56%, without a dollar reconciliation. Adjusted operating margin 23.2%.
- Datacenter & Communications segment $1.95 billion, up 79% year over year; it also includes telecommunications.
- Capital expenditures of $775.5 million in one quarter; debt rose to $4.0 billion, partly through new credit lines at foreign subsidiaries.
- Nvidia invested $2 billion in Coherent in March 2026. According to the announcement, the multiyear, non-exclusive agreement also includes a multibillion-dollar purchase commitment by Nvidia.
- Revenue and growth
- $2.37 billion, +49.9% (Q1 FY2027)
- Operating margin
- GAAP operating margin 15.9%, adjusted 23.2%
- Free cash flow
- -$868.2 million (Q1 FY2027). Our calculation: operating cash flow of -$92.7 million minus capital expenditures of $775.5 million in one quarter; for all of FY2026 it was about -$1.02 billion. Another $527.7 million of capital expenditures was unpaid at the balance sheet date.
- Earnings per share
- $4.82 (trailing twelve months, GAAP, our sum); $6.53 (trailing twelve months, adjusted, our sum)
- Balance sheet
- Debt $4.0 billion against $1.75 billion of cash and short-term investments, net about $2.25 billion (our calculation); $773 million drawn from new credit lines
- Customers
- two customers above 10% each, exact share open: two customers above 10% each (FY2026), exact shares not reported in a comparable way
- Main risk
- negative free cash flow, heavy capital spending, a dip in demand
Management guidance: Q2 FY2027: revenue $2.55 billion to $2.75 billion, adjusted earnings per share $2.28 to $2.48. For FY2027, management expects more than 60% pro forma growth, excluding the businesses sold.
Our assessment: Revenue came in the upper half of guidance and earnings above it; cash flow moves the other way. The capital spending has to show up as positive cash flow in the coming quarters. So far Coherent also funds it with new borrowing, lower cash investments and customer prepayments.
The next things to check at Coherent are operating cash flow, inventory, return on the capital spending. Next date: Q2 FY2027 probably early February 2027 (not confirmed). Sources: 38, 39, 40, 41, 42, 43, 44.
Modine (MOD): supplies cooling and climate systems for data centers and commercial buildings
Latest: Q2 results on 3 Nov 2026, spin-off completed on 1 Oct 2026: Data Centers up 95%, segment gross margin 19.7%, free cash flow -$140.6 million, new guidance excluding the spun-off business.
- Q2 FY2027 revenue $994.4 million, up 35%, still including the spun-off Performance Technologies business.
- Data Centers segment $439.7 million, up 95%; segment gross margin 19.7% after 24.4% a year earlier and 20.2% in the prior quarter.
- Free cash flow -$140.6 million; net debt $573.7 million at 30 Sep 2026.
- The spin-off of Performance Technologies and its merger with Gentherm closed on 1 Oct 2026; Modine received $198.6 million and used it to repay credit lines. Shareholders vote on the new name Modexus Solutions on 13 Nov 2026.
- Revenue and growth
- $994.4 million, +35% (incl. the spun-off business) (Q2 FY2027)
- Operating margin
- GAAP operating margin 9.8% (our calculation); adjusted EBITDA $136.2 million (13.7%)
- Free cash flow
- -$140.6 million (Q2 FY2027). As reported by the company; after -$5.0 million in the prior quarter. In the quarter the operating outflow of -$98.5 million outweighs capital expenditures of $42.1 million, mainly because of higher inventory. For the full year Modine guides zero to $25 million, including the spun-off business in the first half.
- Earnings per share
- no supported figure: the reported numbers still include the spun-off business, and there is no per-share guidance
- Balance sheet
- Net debt $573.7 million at 30 Sep, still including Performance Technologies. In October Modine repaid $198.6 million of its credit facility from payments related to the spin-off ($156.0 million distribution, $42.6 million cash transfer). Modine has not yet reported a figure after the spin-off
- Customers
- largest customer 11% to 13%, annual report: not quantified for the new company. In FY2026, still with the spun-off business, one technology customer accounted for about 11% of revenue and the ten largest for 49%. The 10-Q names the risk of greater concentration on a few large customers or projects
- Main risk
- data center margins, negative cash flow, a new company profile
Management guidance: FY2027 excluding Performance Technologies: revenue $3.1 billion to $3.2 billion (up 50% to 55%), adjusted EBITDA $470 million to $500 million. Not directly comparable with the old guidance ($650 million to $680 million including the spun-off business). Data Centers up 80% to 90%, Commercial HVAC up 10% to 15%. Full-year free cash flow zero to $25 million; this range still includes the spun-off business in the first half.
Our assessment: Data center revenue almost doubled within a year, but the gross margin has fallen. Modine points to better margins in the second half and full-year free cash flow of zero to $25 million, with the first half still including the spun-off business. After -$145.6 million in the first half, that is the test, along with the targets from the Investor Day.
The next things to check at Modine are Data Centers margin, cash flow, medium-term targets from the Investor Day on 18 Nov 2026. Next date: shareholder vote on the name change on 13 Nov 2026; Investor Day on 18 Nov 2026; Q3 FY2027 probably February 2027 (not confirmed). Sources: 45, 46, 47, 48, 49, 50.
Lumentum (LITE): supplies lasers, optical modules and optical switches for data centers and telecom
Latest: Takeover by Marvell agreed on 1 Nov 2026, not yet completed. Q1 results on 2 Nov 2026: revenue within its own guidance, adjusted margin and adjusted earnings per share above it.
- Q1 FY2027 revenue $1.26 billion, up 136.5%; adjusted operating margin 42.3%, above its own guidance of 39.5% to 40.5%.
- Earnings per share $3.54 (GAAP) and $4.57 (adjusted); the results came on 2 Nov 2026 instead of the announced 5 Nov.
- Marvell and Lumentum signed a merger agreement on 1 Nov 2026; the takeover is agreed but not completed. It is planned as an all-stock deal with 4.5 Marvell shares per Lumentum share, which the companies’ joint announcement put at about $1,132 per share and a premium of about 23.9%, based on the unaffected closing prices of 28 Oct 2026.
- Closing needs approval from both groups of shareholders and from regulators. The agreement provides for termination fees under certain conditions, including $3.2 billion payable by Marvell if the deal fails on regulatory approvals and the other contractual conditions are met.
- Revenue and growth
- $1.26 billion, +136.5% (Q1 FY2027)
- Operating margin
- GAAP operating margin 28.5%, adjusted 42.3%
- Free cash flow
- $37.9 million (Q1 FY2027). Our calculation from the 10-Q: operating cash flow $267.7 million minus capital expenditures $229.8 million.
- Earnings per share
- $11.84 (trailing twelve months, adjusted, our sum; GAAP negative because of a one-time charge of $7.8 billion)
- Balance sheet
- Cash and short-term investments about $1.98 billion; convertible notes carrying value $1.31 billion; plus Series A convertible preferred stock from March 2026
- Customers
- end-customer share, fiscal year: two end customers with 26.6% and 15.0% (fiscal 2026); an end-customer share, not a direct-customer share, so not directly comparable
- Main risk
- closing of the takeover (shareholders, regulators), fixed exchange ratio, dilution
Management guidance: Q2 FY2027: revenue $1.575 billion to $1.625 billion, adjusted operating margin 45% to 46%, adjusted earnings per share $5.90 to $6.20.
Our assessment: While the takeover is pending, each Lumentum share is set to be exchanged for 4.5 Marvell shares. Whether the deal closes is open. As a stand-alone infrastructure stock, Lumentum is hard to judge until that decision.
The next things to check at Lumentum are status of regulatory approvals, the S-4 filing, shareholder meetings. Next date: Q2 FY2027: no date published. Takeover: closing expected by the companies in the first half of 2028, not guaranteed. Sources: 51, 52, 53, 54, 55, 56, 57, 58.
Four groups instead of a ranking
A judgment, not a calculation: the groups rest on cash flow, customer concentration, balance sheet and the special situation of individual companies. Stock market valuation is not included because it changes with every share price. Within a group, the order means nothing. Ten stocks from the same chain are also no broad diversification, because much of their revenue depends on the same cloud companies.
Strong cash flow or a broad customer base
- Comfort Systems USA: Strong free cash flow, a $17.81 billion backlog and far more cash than debt. Part of the cash flow rests on billings in excess of costs.
- Amphenol: Broad business with a high margin and no customer above 10% in 2025. In return, much more debt after the acquisitions.
- nVent: Strong organic growth and positive free cash flow. New capital tied up in the Maverick Power purchase.
- Powell Industries: A strongly grown backlog and plenty of cash without conventional debt. Revenue ramps more slowly, and project risk remains.
Fast growth, but few large customers
- Astera Labs: The fastest revenue growth of the ten, but more than half of revenue goes through one direct customer.
- Credo Technology: Very high profitability, but two direct customers carry more than two thirds of revenue.
- Celestica: High growth and an ambitious 2027 target, but three direct customers account for 66% of revenue, and the company itself expects a net cash outflow for 2027.
Negative free cash flow
- Coherent: A broad optics business with strong revenue growth, but the buildout currently costs much more money than the business generates.
- Modine: The data center business is growing fast, the margin there has fallen, and the spin-off changes the company.
Special case: pending takeover
- Lumentum: Strong operations, but the takeover by Marvell is agreed and not yet completed.
Work out the P/E ratio yourself: which earnings figure to use
The denominator decides: the price-to-earnings ratio (P/E) divides the share price by earnings per share. With the current price from your chart you work it out here yourself, because a printed P/E would be out of date quickly. The helper shows the supported earnings figures for each stock, with their period and definition.
Three points deserve special attention. At Comfort Systems, part of the high cash flow comes from billings in excess of costs. At Celestica, a program for selling receivables noticeably supports the cash flow. At Astera Labs and Credo, stock-based compensation is a real economic cost even though no cash leaves the company: the gap between the GAAP and the adjusted margin is large there. GAAP is the US accounting standard, and “adjusted” leaves out such items by the company’s own definition.
Check the chart: what traders look at in these stocks
Good numbers are not yet an entry. The reports say something about the business, the chart about the timing. In the live chart you can select each of the ten stocks and check the setup with current prices.
More room to draw: you can add your own lines and indicators in the full TradingView chart. There you can also set price alerts at important levels, for example for the days around a report.
- Trend: is the price above the 50-day and 200-day moving averages, and is the 50-day average rising?
- Relative strength: has the stock outperformed the broad market over about three months? Our guide to relative strength explains the comparison.
- Base: is there a visible price base and a pullback that held?
- Date: is a report due in the next few days? Then price gaps can jump over any stop.
First the stop, then the risk-reward ratio. A purely hypothetical example with round numbers: entry at $100, stop at $96, target $112 gives (112 minus 100) divided by (100 minus 96) = 3 to 1 before costs. If the stop needs $8 of room because of volatility, the ratio drops to 1.5 to 1. Then you skip the trade instead of tightening the stop. More on this in our guide to risk management.
When do AI infrastructure stocks report next?
The next fixed date is 13 November 2026. The first results after that come from Powell on 16 November. The other companies have not yet confirmed their report dates. We derive the months from the prior year, so check them with the company shortly before.
| Company | Date |
|---|---|
| Modine | 13 Nov 2026: shareholder vote on the new name Modexus Solutions (confirmed) |
| Powell Industries | 16 Nov 2026 after the US close: fourth-quarter results (confirmed) |
| Modine | 18 Nov 2026: Investor Day (confirmed) |
| Credo | Q2 FY2027, prior year on 1 Dec (not confirmed) |
| Celestica, Amphenol | probably late January 2027 (not confirmed) |
| Comfort Systems, nVent, Astera Labs, Coherent, Modine | probably February 2027 (not confirmed) |
| Lumentum | Q2 FY2027, no date published |
Shared risks of the ten stocks
One common cycle: the ten companies depend on the same capital spending cycle. If the cloud companies stretch out their spending, that hits many of them at once, only at different times.
| Trigger and effect | Most affected |
|---|---|
| Spending is postponed: fewer orders, inventory builds, capital tied up | CLS, MOD, COHR; later all |
| Power or construction delays: hardware ready, site not yet ready | CLS, FIX, POWL, NVT |
| Architecture shift: the mix of copper, optics and chips changes | CRDO, ALAB, COHR, LITE |
| Customer power: price cuts, in-house designs, second suppliers | CLS, CRDO, ALAB |
| Project errors: fixed-price losses, late cost revisions | FIX, POWL |
| Financing and transactions: new debt, new shares, a changed company scope | NVT, APH, MOD, COHR, LITE |
For investors outside the US, the exchange rate adds a layer. A higher price in US dollars can be partly or fully offset by a weaker dollar. And even when earnings rise, share prices can fall if the market pays less for those earnings.
Methodology and sources
The basis is earnings releases and SEC filings. The SEC is the US securities regulator, where companies file their quarterly reports (10-Q) and annual reports (10-K). We use media reports and transcripts only where no company source exists, and we label them. We do not use analyst estimates, because we have no consistent, archived consensus. We do not print share prices from third-party providers.
Data as of 8 November 2026. “Trailing twelve months” is our own sum of reported quarterly and annual figures, not a company figure. Guidance is management’s expectation, not a realized result. On 10 November 2026 we re-listed the SEC filings of all ten companies and Marvell; there were no new results, and the dates for Powell and Modine were confirmed again.
- Comfort Systems: Q3 2026 results, 22 Oct 2026
- Comfort Systems: 10-Q for 30 Sep 2026
- Comfort Systems: Q4 and full year 2025, 19 Feb 2026
- Comfort Systems: 2025 annual report (10-K)
- Comfort Systems: buyback increase, 4 Nov 2026 (8-K)
- Comfort Systems: dividend, 22 Oct 2026
- Comfort Systems: CFO succession, 22 Oct 2026
- Amphenol: Q3 2026 results and guidance, 28 Oct 2026
- Amphenol: 10-Q for 30 Sep 2026
- Amphenol: FY2025 10-K, 11 Feb 2026
- Amphenol: Q4 2025 results, 28 Jan 2026
- Amphenol: Q3 earnings call, 28 Oct 2026 (third-party transcript)
- nVent: Q3 2026 results and guidance, 30 Oct 2026
- nVent: 10-Q for 30 Sep 2026
- nVent: 2025 annual report (10-K)
- nVent: notes offering, 29 Sep 2026 (8-K)
- nVent: term loan, 17 Sep 2026 (8-K)
- nVent: Q4 2025 results
- Powell: Q3 FY2026 results, 3 Aug 2026
- Powell: 10-Q for 30 Jun 2026
- Powell: FY2025 annual report (10-K)
- Powell: Q4 FY2025 results, 18 Nov 2025
- Powell: Q4 FY2026 results date, 3 Nov 2026
- Astera Labs: Q3 2026 results, 3 Nov 2026 (8-K, EX-99.1)
- Astera Labs: Q2 2026 results
- Astera Labs: 10-Q for 30 Sep 2026, customers
- Astera Labs: 2025 annual report (10-K)
- Astera Labs: Q4 2025 results
- Credo: Q1 FY2027 results, 1 Sep 2026
- Credo: 10-Q for 1 Aug 2026
- Credo: FY2026 annual report (10-K)
- Credo: Q2 FY2026 results
- Credo: Q4 and FY2026 results
- Celestica: Q3 2026 results and outlook, 26 Oct 2026
- Celestica: 10-Q for 30 Sep 2026
- Celestica: 2025 annual report (10-K)
- Celestica: new buyback program (NCIB), 30 Oct 2026
- Coherent: Q1 FY2027 results, 4 Nov 2026 (8-K, EX-99.1)
- Coherent: Q1 FY2027 slides, 4 Nov 2026
- Coherent: 10-Q for 30 Sep 2026
- Coherent: FY2026 annual report (10-K)
- Coherent and Nvidia: agreement, 2 Mar 2026
- Coherent: Q4 and FY2026 results, 12 Aug 2026
- Coherent: Q2 FY2026 results, 4 Feb 2026
- Modine: Q2 FY2027 results, 3 Nov 2026 (8-K, EX-99.1)
- Modine: Q2 FY2027 slides, 4 Nov 2026
- Modine: 10-Q for 30 Sep 2026
- Modine: spin-off and Gentherm merger completed, 1 Oct 2026 (8-K, EX-99.1)
- Modine: FY2026 annual report (10-K)
- Modine: notice of the special meeting on 13 Nov 2026
- Lumentum: Q1 FY2027 results, 2 Nov 2026
- Lumentum: Q4 and FY2026 results, 11 Aug 2026
- Lumentum: 10-Q for 26 Sep 2026, cash flow
- Lumentum: 10-K for 27 Jun 2026
- Marvell and Lumentum: merger agreement, 2 Nov 2026 (8-K)
- Marvell and Lumentum: joint announcement, 2 Nov 2026
- Lumentum: Q1 FY2027 reporting date, 5 Oct 2026
- Lumentum: Q3 FY2026 results
Conclusion: where the AI buildout really turns into cash
The buildout is real, the quality uneven. All ten suppliers grow with the data centers, but only some of them turn that reliably into free cash flow. At Coherent and Modine, more money currently flows out than the business generates. Astera Labs grows fastest and at the same time depends heavily on one direct customer. Lumentum is a special case until the takeover is decided.
My take: with these stocks I would look at cash flow and the customer list first and only then at the growth rate. After that comes the chart, because a good company is not a good trade at any price. This comparison is not investment advice, and stocks can fluctuate considerably, up to a total loss.
Frequently asked questions about AI infrastructure stocks
Which companies count as AI infrastructure stocks?
Companies that equip AI data centers. They include makers of cooling, power distribution, connectors, connectivity chips and optical components as well as server manufacturers and building services contractors. They do not sell AI models or the main AI processors themselves.
Which AI infrastructure stock is the best?
There is no single best stock. The first group of Comfort Systems, Amphenol, nVent and Powell combines positive cash flow with a partly broader customer base, but that says nothing about share price stability. Astera Labs grows fastest but depends heavily on one direct customer. Which stock fits also depends on the current price and your risk.
Why is Nvidia not in this comparison?
Nvidia sells the main AI processors. This comparison looks at the suppliers behind them. They depend on the same buildout but carry different risks.
How much AI revenue do these companies have?
None of the ten reports such a figure. Segments such as Data Centers or IT datacom also include classic cloud and telecom business. We therefore give no AI revenue share, rather than create false precision.
What is the difference between data center stocks and AI infrastructure stocks?
Operators versus suppliers. Data center stocks often means the operators and real estate companies, such as Equinix or Digital Realty, that rent out space and power. The stocks in this comparison are suppliers: they build, cool, wire and equip the data centers.
What does the Marvell takeover of Lumentum mean?
It is agreed but not completed. The merger agreement of 1 November 2026 provides for 4.5 Marvell shares per Lumentum share, with no cash. The companies expect closing in the first half of 2028, and shareholders and regulators still have to approve.
Can I combine the ten stocks for diversification?
Only to a limited extent. Much of their revenue depends on the same cloud companies and the same construction and power schedules. In a spending pause the ten stocks may therefore behave more like one block of risk.
This English edition is based on our German edition on kagels-trading.de and has been adapted for international readers.
More Markets and Brokers guides
- Open your first account
What Is a Brokerage Account? A US Beginner's Guide
How to open and fund a US brokerage account, cash vs margin, what it costs and what SIPC and FDIC really cover.
- Choose a broker
Interactive Brokers Review 2026: Fees and Platforms
Fees, platforms, investor protection and real futures commissions from a client since 1996.
- Check an offshore broker
PU Prime Review 2026: FCA Warning, Licences and Costs
Which PU Prime company you contract with, what the FCA warning means, and what 1:1000 leverage and the deposit bonus do to your account.
- Check CopyX
CopyX Review 2026: Is TAG Markets Copy Trading Legit?
Who runs the TAG Markets copy trading platform, which regulators warn about it, why US residents are excluded and how fast the 12x Amplify account eats your deposit.
- Understand your price
Market Makers: Who Sets Your Price and How They Profit
How market makers earn on the spread, who sets prices at German trading venues and what the EU ban on payment for order flow changed.
- Read bond market stress
MOVE Index: The VIX of the Bond Market, Explained
What the MOVE index measures, which readings signal stress, how it differs from the VIX and where its limits are.
- Read market sentiment
Fear and Greed Index: How It Works, Tested Since 2021
How CNN builds its Fear and Greed Index from seven measures, what the zones mean and how the S&P 500 moved after readings below 20.
- Trade an index CFD
Index CFDs at Interactive Brokers: Symbols, Costs and Trading
All 13 IBKR index CFDs, margin, stop and close-out worked through for IBDE40, financing, UK hours and the TradingView limit.
- Size an index future
Micro Futures: MES vs MNQ, Tick Values and Risk
MES and MNQ tick values, a worked sizing example from the stop with costs and slippage, and why margin is not your risk.
- Read the futures curve
Contango vs Backwardation: Futures Curves Explained
What contango and backwardation mean, what rolling does to a position in each case, and real gold, oil and gas curves from 28 October 2026.
- Choose a silver future
Silver Futures: SI vs Micro Silver vs 100-oz SIC
SI, Micro Silver and the 100-ounce SIC compared by tick value, risk per contract, margin and December 2026 deadlines.
- Read the chip sector
SOX Index: Holdings, Weighting and How to Use It
What the SOX holds, how Nasdaq caps the weights, its largest declines since 2004 against the Nasdaq-100 and which ETFs really track it.
- Read the biotech sector
Nasdaq Biotechnology Index: Holdings, Weighting and Risks
What the NBI holds, how Nasdaq caps the weights, its long declines since 2003 against the Nasdaq-100 and which ETFs really track it.
- Read the transport sector
Dow Jones Transportation Average: Stocks and Dow Theory
The 20 stocks in the Dow transport index, why the share price sets their weight, declines since 1992 and what Dow Theory can and cannot tell you.
- Research stocks
InvestingPro Review: Screener, ProPicks AI and WarrenAI
What the InvestingPro screener, ProPicks AI and WarrenAI do, what Pro and Pro+ cost and who needs which plan.
- Use the free news portal
Investing.com Review: Free Tools, Data and Limitations
What the free Investing.com portal does well, where the quote prices come from and when InvestingPro is worth paying for.
- Find real AI revenue
AI Stocks 2026: How Listed Companies Earn From AI
Which listed companies earn from AI in cloud, software, infrastructure and chips, disclosed AI revenue against hope, plus AI ETFs and risks.
- Follow an IPO
Anthropic Stock: IPO Date, Valuation and How to Invest
Where the Anthropic IPO stands, how the valuation compares with revenue and how to get exposure before and after the listing.
- Invest in OpenAI before the IPO
OpenAI Stock: Can You Buy It, and Who Owns OpenAI?
Why there is no OpenAI stock yet, who owns OpenAI, where the IPO stands and how much OpenAI you get through Microsoft or SoftBank.
- Understand a stock split
Stock Splits Explained: Forward and Reverse Splits
What forward and reverse splits change and what they do not, the dates that matter, what happens to options and the $1 listing rule.
- Value a stock
Value Investing: Intrinsic Value, Margin of Safety, Traps
Intrinsic value against price, a worked DCF with a sensitivity table, Coca-Cola as a real example, the value premium since 1926 and value traps.
- Value a new listing
SpaceX Stock (SPCX): Valuation, Risks and How to Buy
How to buy SpaceX stock, what the company is worth after the IPO and which risks the lock-up calendar brings.