
Relative Strength: Compare Stocks with the Market


Contents
- Relative strength in 30 seconds
- What is relative strength?
- Four versions of relative strength
- A worked example: strong while losing money
- Benchmark and time window: choose before you look
- A watchlist in five steps
- Two Dow examples from the same selection date
- How to show relative strength on a chart
- Limits of relative strength
- Relative strength: my conclusion
- Frequently asked questions about relative strength
- About the author
A stock can be relatively strong and still lose money. If it falls 5 percent while the market falls 10 percent, it did better than the market. Relative strength measures exactly that: a stock’s performance compared with a benchmark, not its gain or loss on its own.
This guide explains the calculation behind every relative strength line. It shows the difference between the simple price ratio, an indexed comparison, the Mansfield version and the IBD RS Rating, and it builds a five-step watchlist process. Two real Dow examples from the same selection date show what happened next, once with strength that held and once with strength that faded. This article follows our editorial policy and is for education, not investment advice.
Relative strength in 30 seconds
- A ratio, not an oscillator. Relative strength = price of the stock ÷ price of the benchmark. A rising line means the stock is doing better than the market, whatever its own direction.
- Not the RSI. The RSI compares a market only with its own past moves. Relative strength compares two markets.
- Start date and benchmark decide the result. In our example, Merck ranked first among the Dow stocks over six months, but sixth over three or twelve months.
- A filter, not a buy signal. Relative strength helps you choose what to watch. The entry, the stop and the position size still come from the chart and your risk plan.
What is relative strength?
Relative strength is the price of a stock divided by the price of a benchmark, tracked over time. Fidelity describes the same calculation as Relative Strength Comparison: one security’s price divided by a base security’s price (Fidelity, read on 25 October 2026). The benchmark is usually a broad index or an index ETF such as SPY.
The direction of the line matters, not its level. A rising ratio means the stock performed better than the benchmark over that stretch. A flat ratio means both moved by the same percentage. A falling ratio means the stock lagged, even if its price went up. The ratio says nothing about whether you made money.
Four versions of relative strength
Several tools carry the name relative strength, and they are not the same number. Mixing up the price ratio, the Mansfield version and a published rating is a common source of confusion.
- Price ratio: stock price ÷ benchmark price. Its direction shows outperformance; the level itself has no meaning.
- Indexed comparison: the ratio set to 100 on a start date, 100 × (ratio today ÷ ratio at start). A value of 105 means the ratio has risen 5 percent since the start; the change itself is 100 × (ratio today ÷ ratio at start − 1).
- Mansfield relative strength: one common form, on weekly bars, is 100 × (ratio ÷ its 52-week simple moving average − 1). It shows whether the ratio is above or below its own longer average.
- IBD RS Rating: a rank from 1 to 99 of a stock’s 52-week price performance against all stocks, published by Investor’s Business Daily.
The IBD RS Rating is a proprietary ranking, not a line you can calculate yourself. Investor’s Business Daily describes it as a score from 1 to 99 based on a stock’s price performance over the last 52 weeks compared with all other stocks, and warns not to confuse it with the RS line against the S&P 500 (IBD, read on 25 October 2026). A ratio or ranking you build yourself is not the IBD rating.
The Mansfield version is a ratio measured against its own average. It is part of Stan Weinstein’s approach, explained in our guide to stage analysis. Mark Minervini’s Trend Template uses relative strength as one criterion among several; our Mark Minervini profile describes it. This guide covers the common base: the ratio itself.
A worked example: strong while losing money
The table shows why relative strength and profit are two different questions. All numbers are invented for the arithmetic, and the benchmark stands for any index.
| Case 1 | Case 2 | |
|---|---|---|
| Stock | 100 → 95 (−5%) | 100 → 120 (+20%) |
| Benchmark | 100 → 90 (−10%) | 100 → 130 (+30%) |
| Ratio change | 0.95 ÷ 0.90 − 1 = +5.56% | 1.20 ÷ 1.30 − 1 = −7.69% |
| Return difference | +5 points | −10 points |
In Case 1, the stock lost money and still gained relative strength. In Case 2, it made 20 percent and lost relative strength. Note that the ratio change (+5.56 percent) is not the same as the difference between the two returns (5 percentage points). Use one of the two consistently.
Never rank stocks by the raw level of the ratio. A $500 stock divided by SPY at 650 gives 0.77; a $50 stock gives 0.077. That says nothing about which one did better. Compare the change of each ratio over the same period, or index all of them to 100 on the same start date.
Benchmark and time window: choose before you look
The benchmark should match the question you are asking. For a US stock against the whole market, the S&P 500 or SPY is the usual choice. To see whether a stock leads its own industry, compare it with a sector ETF or a sector index such as the SOX for chip stocks. Stock and benchmark need the same currency, the same trading days and the same price basis: either both with dividends (total return) or both without.
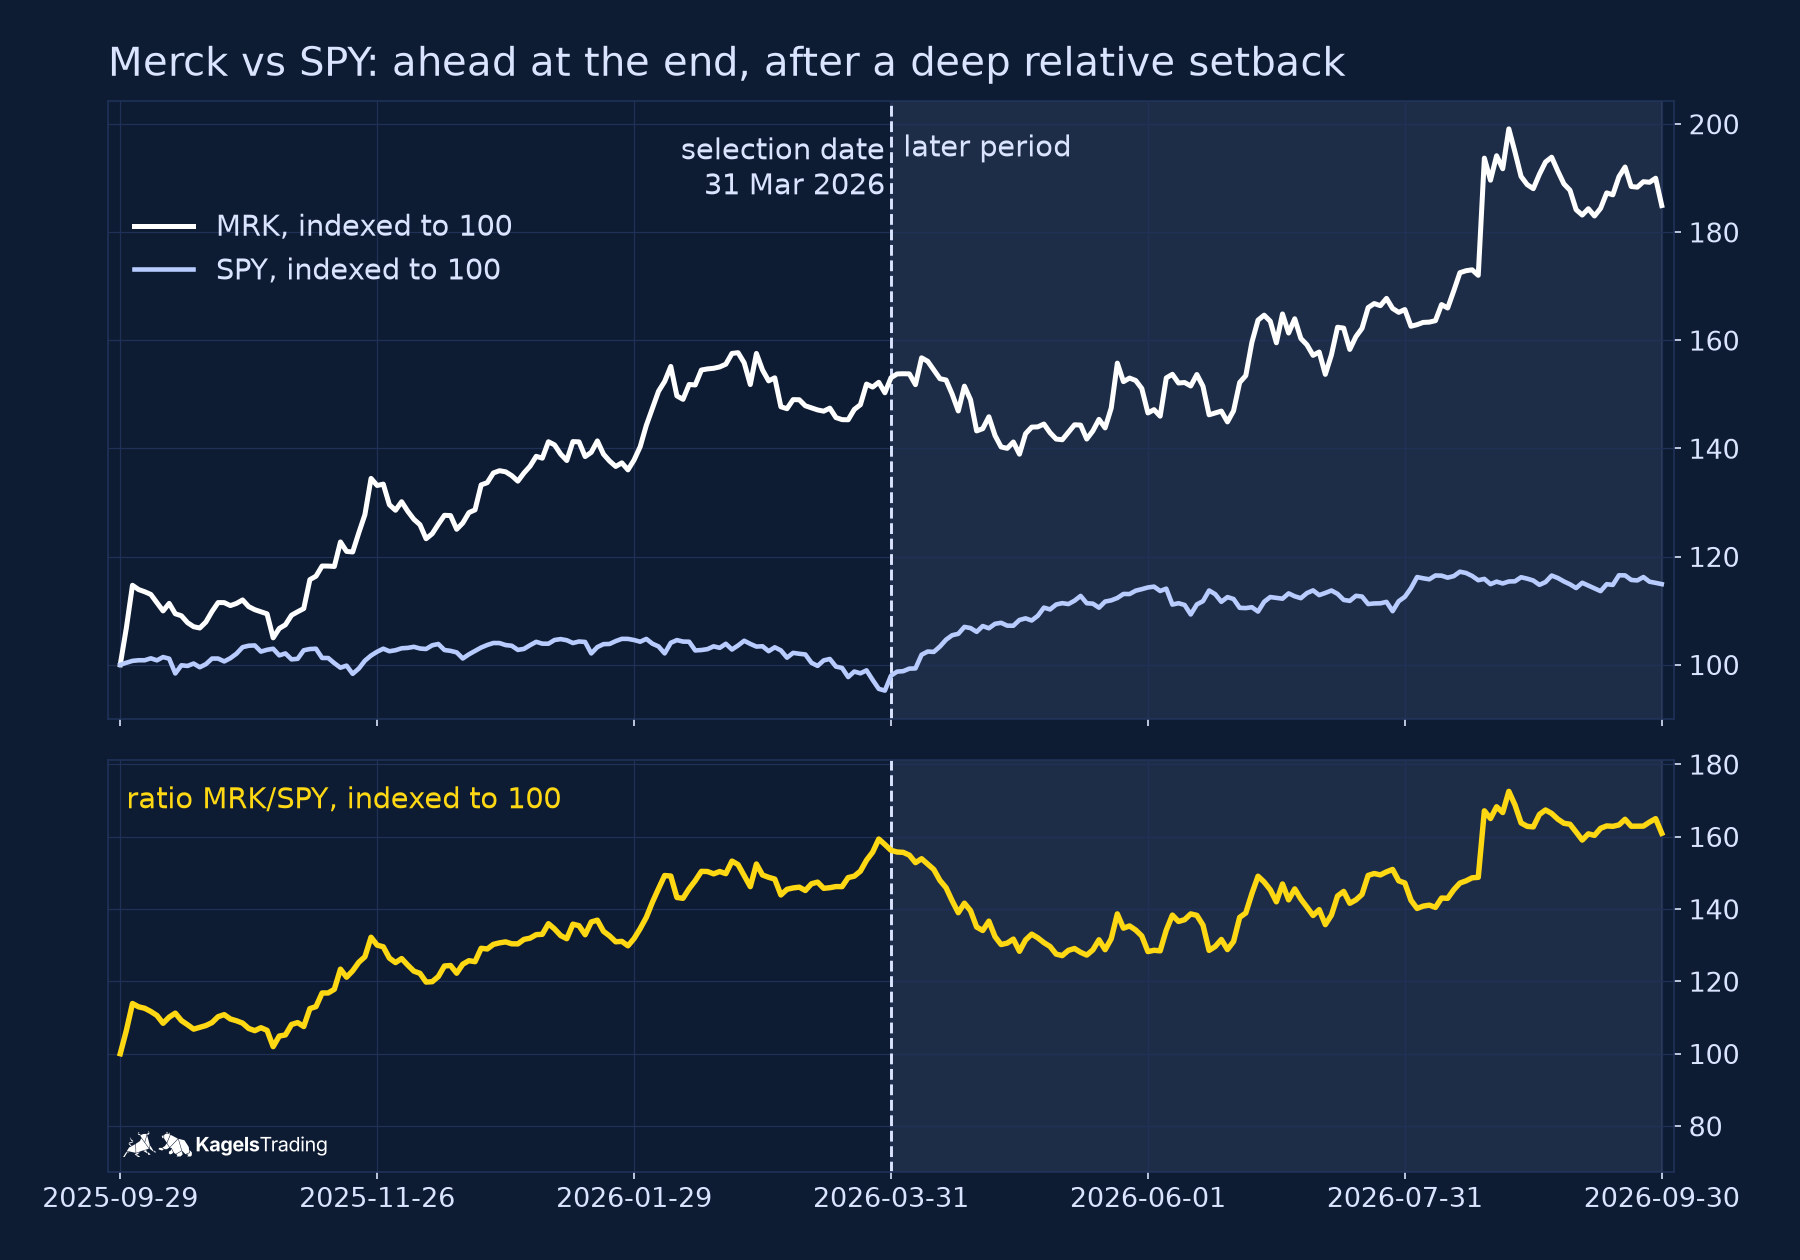
The start date can change the answer completely. On 31 March 2026, Merck had the best six-month relative strength of the 30 Dow stocks in our test. Measured over three months or twelve months to the same day, it ranked sixth. Decide the window before you look at the results, and keep it the same for every stock you compare.
A watchlist in five steps
Relative strength works best as one filter in a short, written process. Here is a version you can apply on a weekly or monthly schedule.
- Universe. Start with liquid stocks you can actually trade, for example an index such as the Dow or the S&P 500. A stock screener or a heatmap helps with the first overview.
- Trend. Keep only stocks in an uptrend by a rule you can check, for example a close above the 200-day average.
- Relative strength. Rank the rest by the change of their ratio against the benchmark over a fixed window, and keep the top few.
- Chart structure. Look for a base, a pullback or a breakout level on the chart. A strong ratio without a clear entry point is a stock to watch, not to buy.
- Risk plan. Define the stop before the entry and size the position from it, as shown in our guide to position sizing.
Two Dow examples from the same selection date
We fixed the selection rule before we downloaded a single price. The universe was the 30 Dow stocks as of 31 March 2026 (Alphabet replaced Verizon only on 29 June 2026, according to S&P Dow Jones Indices). The benchmark was SPY. We ranked the stocks by the change of their ratio over the 126 trading days to 31 March 2026, kept those above their 200-day average and took the top three.
| Stock | Ratio, 6 months before | Ratio after | Price after |
|---|---|---|---|
| MRK | +56.2% | +3.0% | +20.8% |
| CAT | +53.3% | −2.4% | +14.4% |
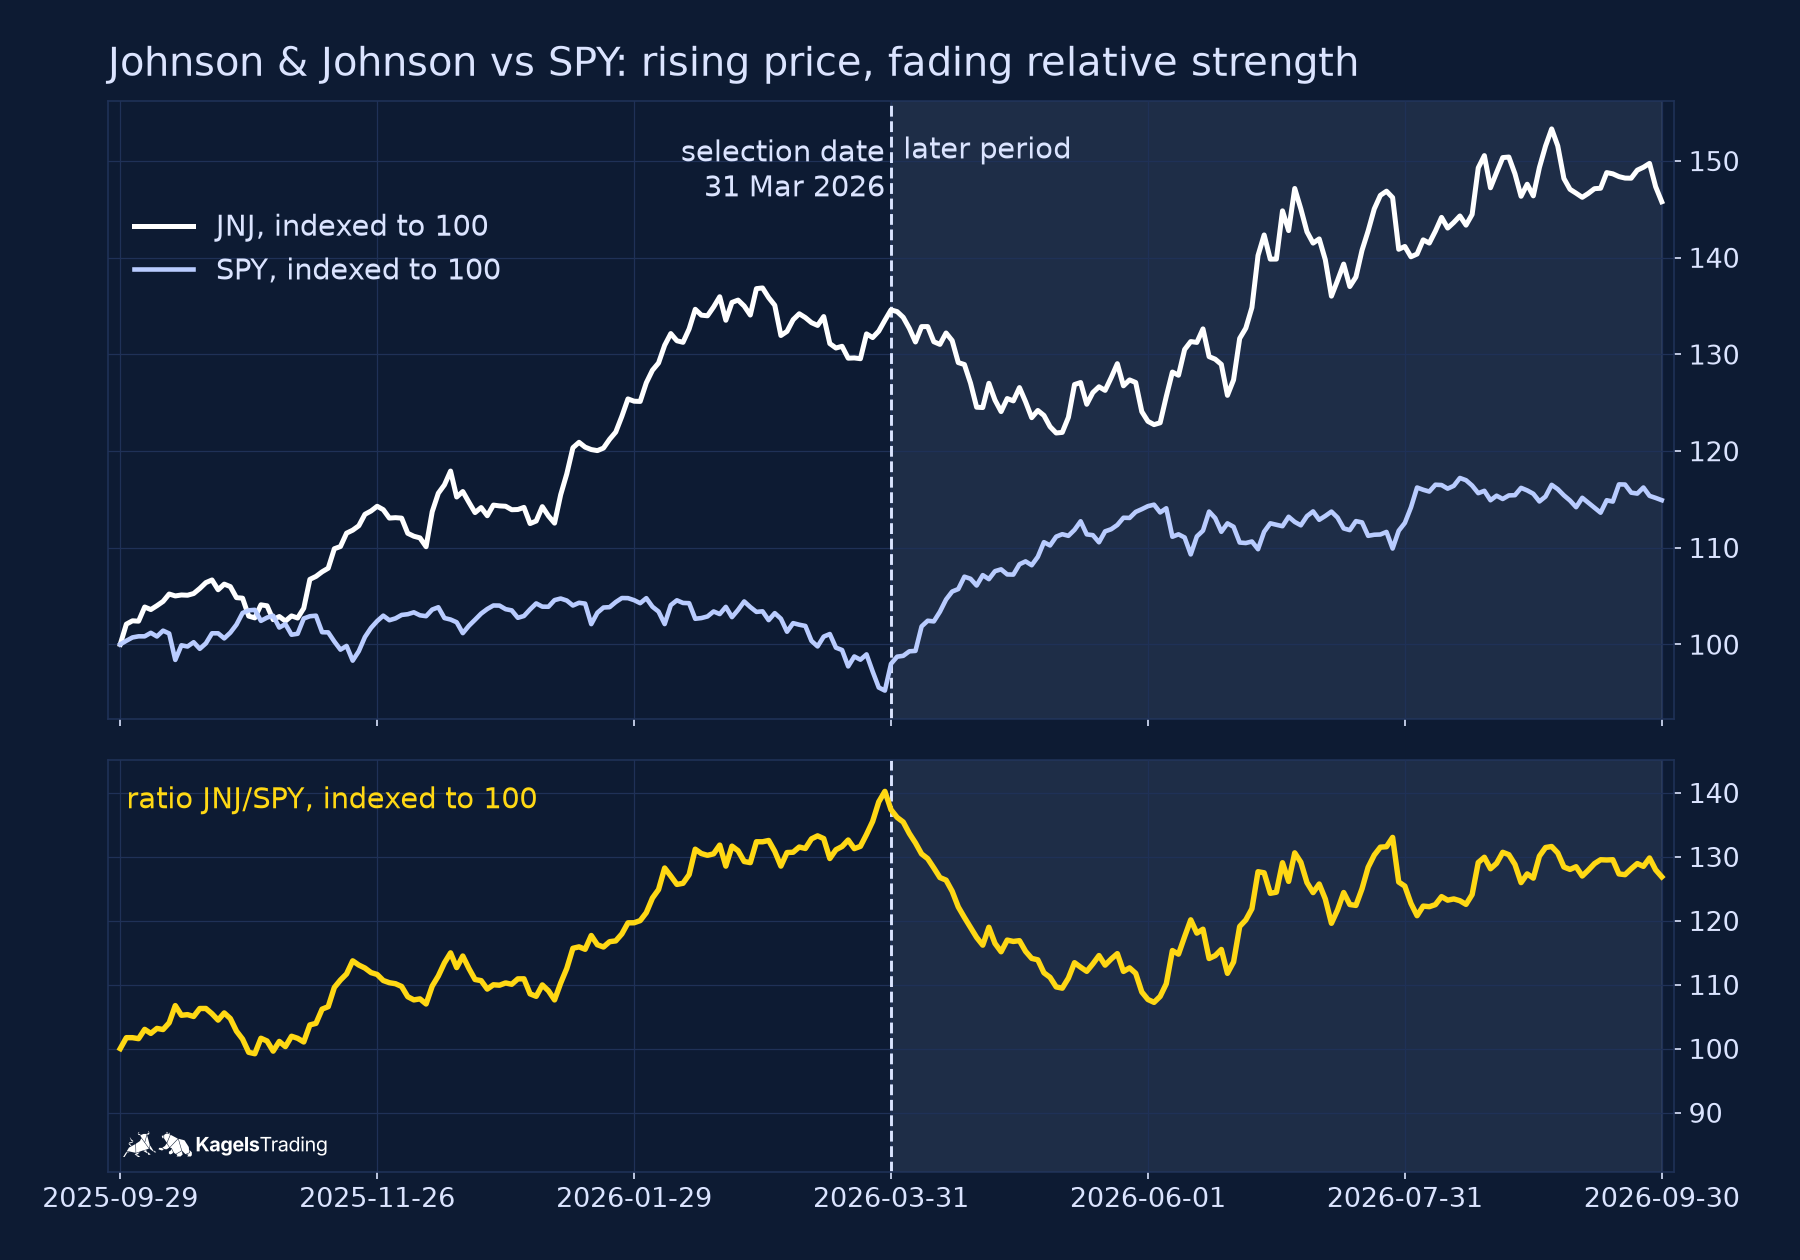
| JNJ | +37.4% | −7.6% | +8.3% |
| SPY | +17.3% |
MRK = Merck, CAT = Caterpillar, JNJ = Johnson & Johnson. “Before” = change of the ratio to SPY from 29 September 2025 to the selection date 31 March 2026; “after” = 31 March to 30 September 2026. Daily closes from Yahoo Finance, split-adjusted, without dividends (price series, not total return). Own calculation.
We show the charts of the best and the worst of the three follow-ups, and we say so. Three stocks from one date are an illustration, not a test. Dividends are left out for both stock and benchmark, so the figures are price returns, and the universe is a single index on a single day.
Merck: ahead at the end, after a deep setback
 Click to enlarge
Merck’s relative strength held over six months, but not in a straight line. From the selection date, the ratio against SPY fell by about 19 percent to its low on 11 May 2026, then recovered and ended 3.0 percent higher. Merck’s price rose 20.8 percent, ahead of SPY’s 17.3 percent. Strength that holds over six months can still include weeks of clear weakness.
Johnson & Johnson: a rising price, fading relative strength
 Click to enlarge
Johnson & Johnson made money after the selection date and still failed the relative strength test. The price rose 8.3 percent to 30 September 2026. SPY rose 17.3 percent in the same time, so the ratio fell 7.6 percent, with a low about 22 percent below its March level in early June. JNJ underperformed SPY over the follow-up period, so it was no market leader in those six months; for a holder, it was still a gain.
How to show relative strength on a chart
The quickest way is a ratio chart of the two symbols. In TradingView, you can type a division into the symbol search, for example MRK/SPY, and the chart shows the ratio as one line (TradingView help on spread charts, read on 25 October 2026). The help page notes that spread charts can repaint, because real-time bars are built from ticks and historical bars from minute data.
A percentage comparison shows the same story in a different form. Indexing both lines to 100 on one date, as in the upper panels of our charts, shows how far each one has moved since then. The ratio below shows the difference directly. Both depend on the start date, so write it on the chart.
Limits of relative strength
Relative strength describes the past; it does not forecast the future. Strong stocks can stay strong, as Merck did in our example, or fade, as Johnson & Johnson did. A leader can also fall hard when the whole market turns, because a ratio measures only the difference to the benchmark.
Check whether your chart includes dividends. Price returns leave them out; including dividends for both the stock and the benchmark (total return) can change their relative performance in either direction. Survivorship is a second trap: a list of today’s index members already leaves out the companies that dropped out, so always fix the universe on the selection date.
Relative strength: my conclusion
Relative strength answers one question well: is this stock doing better than the market? It does not answer whether the stock will rise, where to enter or how much to risk. Use it as a filter to keep your watchlist short, and use the chart and your stop for the trade.
Write down the benchmark, the window and the date before you look. Our two examples came from the same rule and the same day, and they ended in opposite ways. That is normal, and it is why position size and a risk plan matter more than the ranking itself.
Frequently asked questions about relative strength
What is the difference between relative strength and RSI?
Relative strength compares a stock with a benchmark; the RSI compares a market only with its own recent gains and losses. The RSI is an oscillator between 0 and 100. Relative strength is a ratio of two prices, and its level has no fixed range. The RSI guide linked above explains the oscillator.
Can a stock have relative strength in a falling market?
Yes, if it falls less than the benchmark. A stock down 5 percent while the market is down 10 percent has a rising ratio. It still lost money, so relative strength in a falling market is a sign of resilience, not a reason to expect a gain.
How do you calculate relative strength?
Divide the stock’s closing price by the benchmark’s closing price on each day. To compare several stocks, set each ratio to 100 on the same start date: 100 × (ratio today ÷ ratio at start). Use the same trading days, currency and price basis for both, and keep the window the same for every stock.
Where can I find the relative strength of a stock?
You can build it yourself in most charting tools as a ratio chart, for example MRK/SPY. Screeners and investment newspapers also publish their own rankings, such as the IBD RS Rating, which follows its own method. Check which version a tool shows before you compare its numbers with a ratio you calculated.
More Technical Indicators guides
- Judge a golden cross
Golden Cross: Definition and S&P 500 Test Results
How the 50-day and 200-day averages cross, and what 38 signals in the S&P 500 since 1950 did against the base rate and buy and hold.
- Judge a death cross
Death Cross: What 38 S&P 500 Signals Since 1950 Show
How deep the S&P 500 fell after 38 death crosses since 1950, how late the signal comes, and what shorting it on SPY did since 1993.
- Use moving averages
Moving Averages: SMA, EMA and a 76-Year 200-Day Test
SMA, EMA and WMA formulas with a worked example, common periods, and what the 200-day line showed on the S&P 500 since 1950.
- Trail a stop with the Supertrend
Supertrend Indicator: Settings, Strategies and an ETF Test
How the ATR-based line is calculated, common settings, five strategies, and what 654 completed flip trades in SPY, QQQ and GLD since 1993 showed.
- Read the Ichimoku Cloud
Ichimoku Cloud: The Five Lines and a US ETF Test
The five lines and the cloud, how traders read the Tenkan/Kijun cross, and what the cloud and the crosses did in SPY (since 1993), QQQ and GLD.
- Measure trend strength with the ADX
ADX Indicator: What Trend Strength Really Tells You
How +DI, −DI and the ADX are calculated, what 20 and 25 mean, and whether a high ADX meant the trend went on in SPY, QQQ and GLD.
- Read the RSI
RSI Indicator: Formula, Settings and a 75-Year Test
The RSI formula, overbought and oversold, and what RSI signals did on the S&P 500 since 1951 against the base rate.
- Read volatility with Bollinger Bands
Bollinger Bands: Settings, Squeeze and a 76-Year Test
Settings, the three typical chart situations, five strategies with rules, and what the bands and the squeeze showed on the S&P 500 since 1950.
- Set stops with the ATR
ATR Indicator: Average True Range for Stops and Size
True range and Wilder smoothing, stop distance and position size, and how ATR stops behaved on SPY from 1994 to 2026 against a fixed stop.
- Trade Donchian breakouts
Donchian Channel: Breakout Rules and a 20-Year ETF Test
Channel rules, the current-bar pitfall, the Turtle systems, and what 499 breakout trades in SPY, GLD and TLT from 2006 to 2026 showed.
- Read the Stochastic
Stochastic Oscillator: Settings, Signals and a 30-Year Test
The %K and %D formula, what 14, 3, 3 means, fast versus slow, and what 785 oversold signals in SPY, QQQ and GLD did against the base rate.
- Judge a divergence
Divergence Trading: Regular and Hidden Divergence Tested
Regular and hidden, bullish and bearish divergences, when they are confirmed, and what 447 RSI divergences detected in SPY, QQQ and GLD did against the base rate.
- Read the MACD
MACD Indicator: Histogram, Divergence and a 31-Year Test
Formula, histogram, crossovers and divergences, with a 31-year test on the S&P 500 and the DAX against the base rate.
- Use VWAP
VWAP Indicator: Formula, Anchored VWAP and TradingView Setup
The VWAP formula, trend day versus range day, Anchored VWAP and the right settings in TradingView.