
Sector Rotation: How to Spot Shifts in Market Leadership


Contents
- Sector rotation in 30 seconds
- Reading the XLE/SPY chart
- What is sector rotation?
- The 11 GICS sectors: cyclical, defensive, rate-sensitive
- The textbook model: sector rotation in the business cycle
- Data check: did the textbook hold in real recessions?
- What research says about sector rotation
- How to spot sector rotation on a chart
- Relative strength in a backtest: 27 years rerun
- Case study: sector rotation in 2026, as of 11 September
- Pitfalls when you act on rotation
- Sector rotation: a map, not a timetable
- Frequently asked questions about sector rotation
- About the author
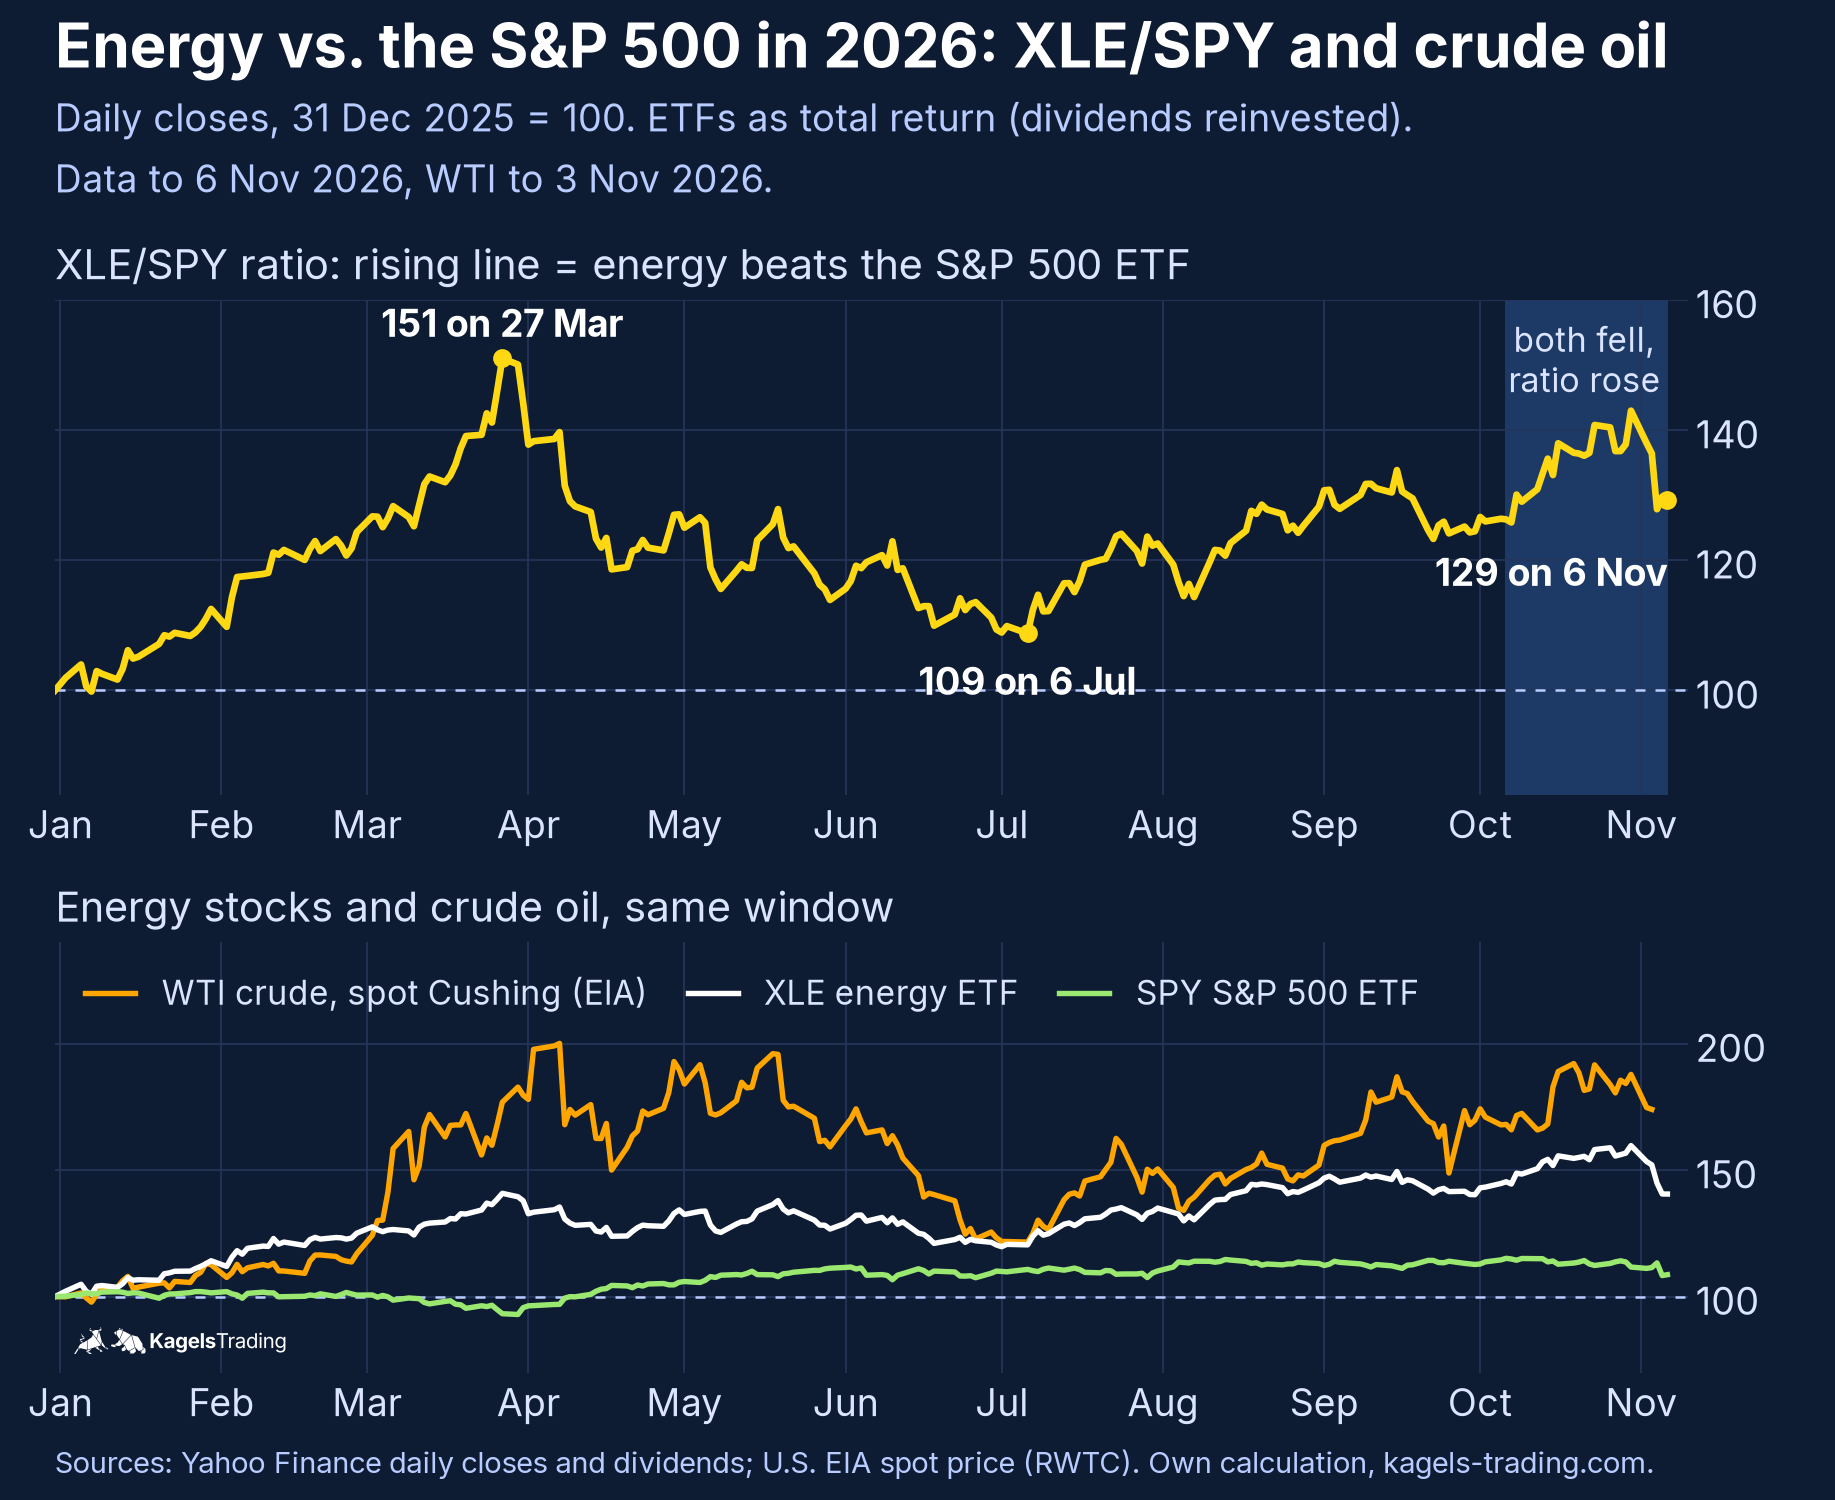
From the start of 2026 to 11 September, the energy sector gained almost 48 percent while consumer discretionary lost 5 percent. The S&P 500 ETF (SPY) sat in between at plus 13 percent and showed nothing of that split. This is sector rotation: leadership shifts from one part of the market to another while the index looks calm.
The quickest way to see it is a single line: XLE divided by SPY. This guide starts there, then checks the textbook business-cycle model against three US recessions and reruns a 27-year backtest of monthly sector momentum. Our rerun changed one result of the original German test, and we say which one.
 Click to enlarge
Source: Data from Yahoo Finance and the U.S. EIA, chart by Kagels Trading.
Sector rotation in 30 seconds
- Seen in ratios, not in the index. Sector rotation shows up as a sector’s relative strength against the market, for example the XLE/SPY line above.
- A rising ratio is not a buy signal. It can rise while both funds fall, and it measures returns, not fund flows.
- The cycle model is a tendency. In our check of three US recessions since 2001, consumer staples, technology and consumer discretionary beat SPY all three times; utilities only once.
- Momentum rotation did not beat the market. Holding the three strongest of nine sectors each month returned 7.0 to 8.2 percent a year after costs from 2000 to August 2026; SPY made 8.3 percent and the nine sectors in equal weight 9.0 percent.
- Its edge was risk, not return. All three rotation variants had smaller maximum drawdowns than SPY.
Reading the XLE/SPY chart
A ratio chart divides one price by another and shows which of the two did better. XLE is the Energy Select Sector SPDR, a fund of the energy stocks in the S&P 500; SPY tracks the whole S&P 500. When the line rises, energy beats the market. When it falls, energy lags.
In 2026 the ratio told three different stories. Energy pulled ahead until 27 March, when the ratio stood at 151, so XLE had done 51 percent better than SPY since New Year. By 6 July more than four fifths of that lead was gone at 109. Then energy led again, to 129 on 6 November. A year-to-date table shows only the end result; the ratio shows the turns.
The ratio can rise while both funds fall. From 6 October to 6 November 2026, XLE lost 3.3 percent and SPY 5.6 percent. The ratio still rose 2.4 percent, the shaded stretch in the chart. “Energy is strong” meant “energy fell less”, and an energy holder still lost money.
Relative returns do not prove fund flows. A rising ratio shows that energy shares outperformed. It does not show that new money went into energy funds; prices can also move because other sectors were sold or because earnings expectations changed. Flow data from fund providers is a separate source and is not part of this chart.
Dividends matter over long windows, so state how you handle them. Our chart uses total return for both funds, dividends reinvested. If you type XLE/SPY into TradingView, you get the plain price ratio without dividends. On 6 November it read about 128 instead of 129, because XLE pays a higher dividend yield than SPY.
Energy stocks are not the oil price. The lower panel compares XLE with the WTI crude spot price at Cushing, Oklahoma, published by the U.S. Energy Information Administration. WTI rose from $57.26 at the end of 2025 to $114.58 on 7 April 2026, almost double, while XLE gained about 35 percent. By 6 July crude had given back most of that and both lines met near 121. Energy shares rose more steadily than crude, a pattern our oil stocks guide also found for Brent since 2025. For the oil market itself, see our crude oil forecast.
What is sector rotation?
Sector rotation is the shift in market leadership from some sectors to others as growth, interest rates, inflation or risk appetite change.
The term has two meanings, and they should be kept apart. As an observation, it says that one sector is currently doing better than the market and another worse; you can check that every day in relative returns. Whether money actually moved between funds is a separate question that needs fund flow data. As a strategy, it means trying to move ahead of that shift and buy the next leaders early. The tests below show that this is much harder.
Rotation shows up inside the market, not only in its total. Leadership can pass from technology to energy or from cyclical to defensive sectors while the index barely moves. That is why an index can move sideways while single sectors rise or fall by double digits. The colors of a stock heatmap show this split at a glance. The same split can run inside one industry: in 2026 several European defense stocks fell steeply while US peers such as Lockheed Martin rose.
The 11 GICS sectors: cyclical, defensive, rate-sensitive
The Global Industry Classification Standard (GICS) assigns every listed company to one of 11 sectors. S&P Dow Jones Indices and MSCI maintain it together. In the US, each sector has a Select Sector SPDR fund from State Street.
| Sector | US ETF | Character |
|---|---|---|
| Information Technology | XLK | cyclical, growth |
| Financials | XLF | cyclical, rate-sensitive |
| Communication Services | XLC | mixed |
| Consumer Discretionary | XLY | cyclical |
| Industrials | XLI | cyclical |
| Materials | XLB | cyclical, commodities |
| Energy | XLE | cyclical, commodities |
| Consumer Staples | XLP | defensive |
| Health Care | XLV | defensive |
| Utilities | XLU | defensive, rate-sensitive |
| Real Estate | XLRE | rate-sensitive |
The 11 GICS sectors and their Select Sector SPDR funds. Character describes typical behavior in the business cycle, not a rule.
The sector map changes more often than most charts suggest. Real estate became the eleventh sector on 31 August 2016. In September 2018, telecommunications became Communication Services, and Alphabet and Meta moved there from technology. After the close on 17 March 2023, Visa and Mastercard moved from technology to financials, according to State Street’s GICS change note; S&P Dow Jones Indices and MSCI announced the 2023 GICS revisions a year earlier. A long XLF/XLK ratio across that date measures a basket change as well as rotation.
Defensive does not mean safe. Utilities and real estate depend heavily on bond yields, because their dividends compete with bonds. In 2026 the 10-year Treasury yield rose from 4.18 percent on 31 December 2025 to 4.96 percent on 11 September, according to the U.S. Treasury. Over the same stretch, utilities (XLU) gained only 0.6 percent.
The textbook model: sector rotation in the business cycle
The business cycle is the recurring sequence of expansion, peak, contraction and recovery; in the US, the National Bureau of Economic Research (NBER) dates its turning points.
The best-known rotation model assigns each phase its own leaders. It goes back to Sam Stovall’s Standard & Poor’s guide to sector investing. Fidelity has studied it with data since 1962 and splits it into four phases, as shown in its business cycle overview.
| Phase | Historically ahead |
|---|---|
| Early cycle | Consumer discretionary, financials, real estate |
| Mid cycle | Technology |
| Late cycle | Energy, utilities |
| Recession | Consumer staples, health care, utilities |
Simplified from Fidelity’s four-phase model. A historical tendency, not a timetable.
The logic is sound, and the limits are stated right next to it. Early in the cycle, rate-sensitive sectors gain because the central bank has cut. Late in the cycle, tight capacity lifts commodity prices. Fidelity itself writes that during the mid cycle, no single category of investments has beaten the broader market more than half of the time.
The biggest practical problem is time. The NBER dates recessions only in hindsight. It announced the December 2007 peak on 1 December 2008, almost a year later. Anyone who waits for the official phase arrives late; the data that gives hints in real time is listed in our economic calendar.
Data check: did the textbook hold in real recessions?
We ran the nine sector ETFs with the longest history through the three US recessions since 1999. Each window runs from the month-end of the NBER peak to the month-end of the NBER trough. All returns are total returns from Yahoo Finance daily data, dividends reinvested, with SPY as the market.
| In % | 2001 | 2008/09 | 2020 |
|---|---|---|---|
| SPY | −1.6 | −34.8 | −1.3 |
| Staples | +5.9 | −17.0 | +1.1 |
| Health care | −1.6 | −23.2 | +8.2 |
| Utilities | −11.2 | −30.2 | −6.9 |
| Technology | −1.0 | −30.2 | +4.0 |
| Discretionary | +5.6 | −27.6 | +1.2 |
| Materials | +12.4 | −35.8 | −0.9 |
| Industrials | +0.3 | −41.6 | −11.4 |
| Financials | −1.6 | −56.3 | −13.5 |
| Energy | −16.5 | −38.0 | −14.0 |
Own calculation from Yahoo Finance daily closes and dividends, retrieved 7 November 2026. Windows: 30 March to 30 November 2001, 31 December 2007 to 30 June 2009, 28 February to 30 April 2020 (NBER peak and trough months).
Only the financial crisis of 2008/09 went by the book. Staples, health care and utilities lost much less than the index, and financials more than halved. In 2001, materials was the best sector at plus 12.4 percent while utilities lost 11.2 percent. In 2020, health care and technology led and utilities again trailed the market.
Counted up, the recession rule looks thin. Consumer staples beat SPY in all three cases. So did technology and consumer discretionary, which the model counts among the losers. Utilities managed it once, health care twice; in 2001 health care and financials were level with the index, within 0.1 point.
The main reason is that the stock market runs ahead of the economy. When the 2001 recession officially began, technology stocks had already been falling for a year. The 2020 recession lasted two months, and the market turned in the middle of it.
After the trough, the model did better. In the twelve months after the 2009 and 2020 lows, cyclical sectors led: consumer discretionary gained 28.0 percent from June 2009 (SPY 14.4 percent) and materials 63.2 percent from April 2020 (SPY 46.0 percent). After November 2001, SPY fell another 16.4 percent and health care was the only sector with a gain, 5.6 percent. A low in the economy is not automatically a low in the market.
What research says about sector rotation
Three recessions are a small sample, so a long study is worth a look. Jeffrey Stangl, Ben Jacobsen and Nuttawat Visaltanachoti tested the Stovall model on US data from 1948 to 2007. They assumed an investor who knows every phase of the cycle in advance.
Even with that perfect foresight, little was left. In the authors’ 2009 paper, the rotation earned an annual risk-adjusted outperformance (Jensen’s alpha) of 2.3 percent before transaction costs. That is not the same as a raw return difference, so it cannot be compared directly with the annual returns in our backtest below. With round-trip trading costs of 0.5, 1.0 and 1.5 percent, the study’s annual alpha fell to 1.9, 1.5 and 1.1 percent; CXO Advisory’s summary of the December 2009 version reports the same range. Real investors also recognize the phase only with a delay.
That does not make rotation unimportant; it makes the economic forecast a weak trigger. Many practitioners therefore look at prices directly: which sector is stronger than the market right now? That is the idea behind relative strength and momentum.
How to spot sector rotation on a chart
You do not need a forecast of the economy, just three views of prices. All three describe current leadership: which sectors are doing better or worse than the market. None tells you who leads next, and none measures actual fund flows. Accept that, and you miss the first weeks of a rotation but avoid many false signals.
Ratio charts against SPY
The ratio chart is the simplest rotation tool. In TradingView, type XLE/SPY in the symbol field. A rising line means energy is doing better than the market, as in the chart at the top. What counts is the trend of the line over several weeks, not a single day. Many traders add a moving average or ordinary trend lines to the ratio; a break of that line is often the first sign that leadership is changing. Stan Weinstein’s stage analysis uses the same idea for single stocks.
Relative Rotation Graph (RRG)
A Relative Rotation Graph places several securities in four quadrants by their relative strength and the change in that strength; Julius de Kempenaer developed it.
The RRG puts all sectors into one picture. The horizontal axis shows the JdK RS-Ratio, the relative strength against the benchmark. The vertical axis shows the JdK RS-Momentum, the pace at which that strength changes. Both axes cross at 100, as StockCharts explains in its ChartSchool article on RRG charts.
| Quadrant | Relative strength | Momentum |
|---|---|---|
| Leading | high | rising |
| Weakening | high | falling |
| Lagging | low | falling |
| Improving | low | rising |
The four quadrants of a Relative Rotation Graph. Ideally, sectors move through them clockwise.
Ideally, a sector moves clockwise through the four quadrants. A sector that moves from Improving to Leading has turned its relative trend up and now outperforms the benchmark. In practice, the points do not always move in a neat circle and sometimes jump back. The RRG has no buy or sell rules; it shows a state, not a trading system.
Breadth: equal weight against cap weight
The third view asks whether a rally is broad or carried by a few giants. Compare SPY with the equal-weight S&P 500, for example through the ETF RSP. From the start of 2026 to 11 September, RSP gained 13.1 percent and SPY 12.7 percent, both with dividends. The gains were spread a little more widely than in years when a few megacaps carried the index.
Big rotations rarely stay inside stocks. When investors get nervous, bonds, gold and the dollar often do better than stocks. John Murphy described these links systematically; our review of Technical Analysis of the Financial Markets covers his intermarket chapter.
Relative strength in a backtest: 27 years rerun
If relative strength is the better trigger, it should show in the numbers. The test is simple: at the end of every month, buy the three strongest of nine sectors, ranked by their total return over the last 3, 6 or 12 months. Each gets a third of the capital; a month later the ranking is redone. The nine sectors are the Select Sector funds with history since December 1998; communication services (2018) and real estate (2015) are left out.
We rebuilt the German original from scratch, because its code and data files were not available. Our rules: total returns from Yahoo Finance closes and dividends, the signal at the close of the last trading day of the month, and the trade at the close of the next trading day. Every buy and every sell costs 0.10 percent of the traded value, including the first purchase. Weights drift with prices during the month and are reset to one third at each rebalance. The first signal is 31 December 1999, the end 31 August 2026, and the maximum drawdown is measured on month-end values. Taxes and spreads are not included.
| Variant | Per year | Max. drawdown | Per year, same close |
|---|---|---|---|
| Top 3, 3 months | 7.0% | −45.1% | 7.5% |
| Top 3, 6 months | 7.1% | −47.7% | 7.5% |
| Top 3, 12 months | 8.2% | −40.7% | 8.5% |
| SPY, buy and hold | 8.3% | −50.8% | 8.3% |
| 9 sectors, equal weight | 9.0% | −48.9% | 8.9% |
Own backtest, Yahoo Finance daily closes and dividends, signals from 31 December 1999, values to 31 August 2026. Rotation and equal weight after 0.10 percent per side; SPY without costs. Main columns: traded at the close of the day after the signal. Last column: signal and trade at the same month-end close, the version that reproduces the German page. Simulated results, not a forecast.
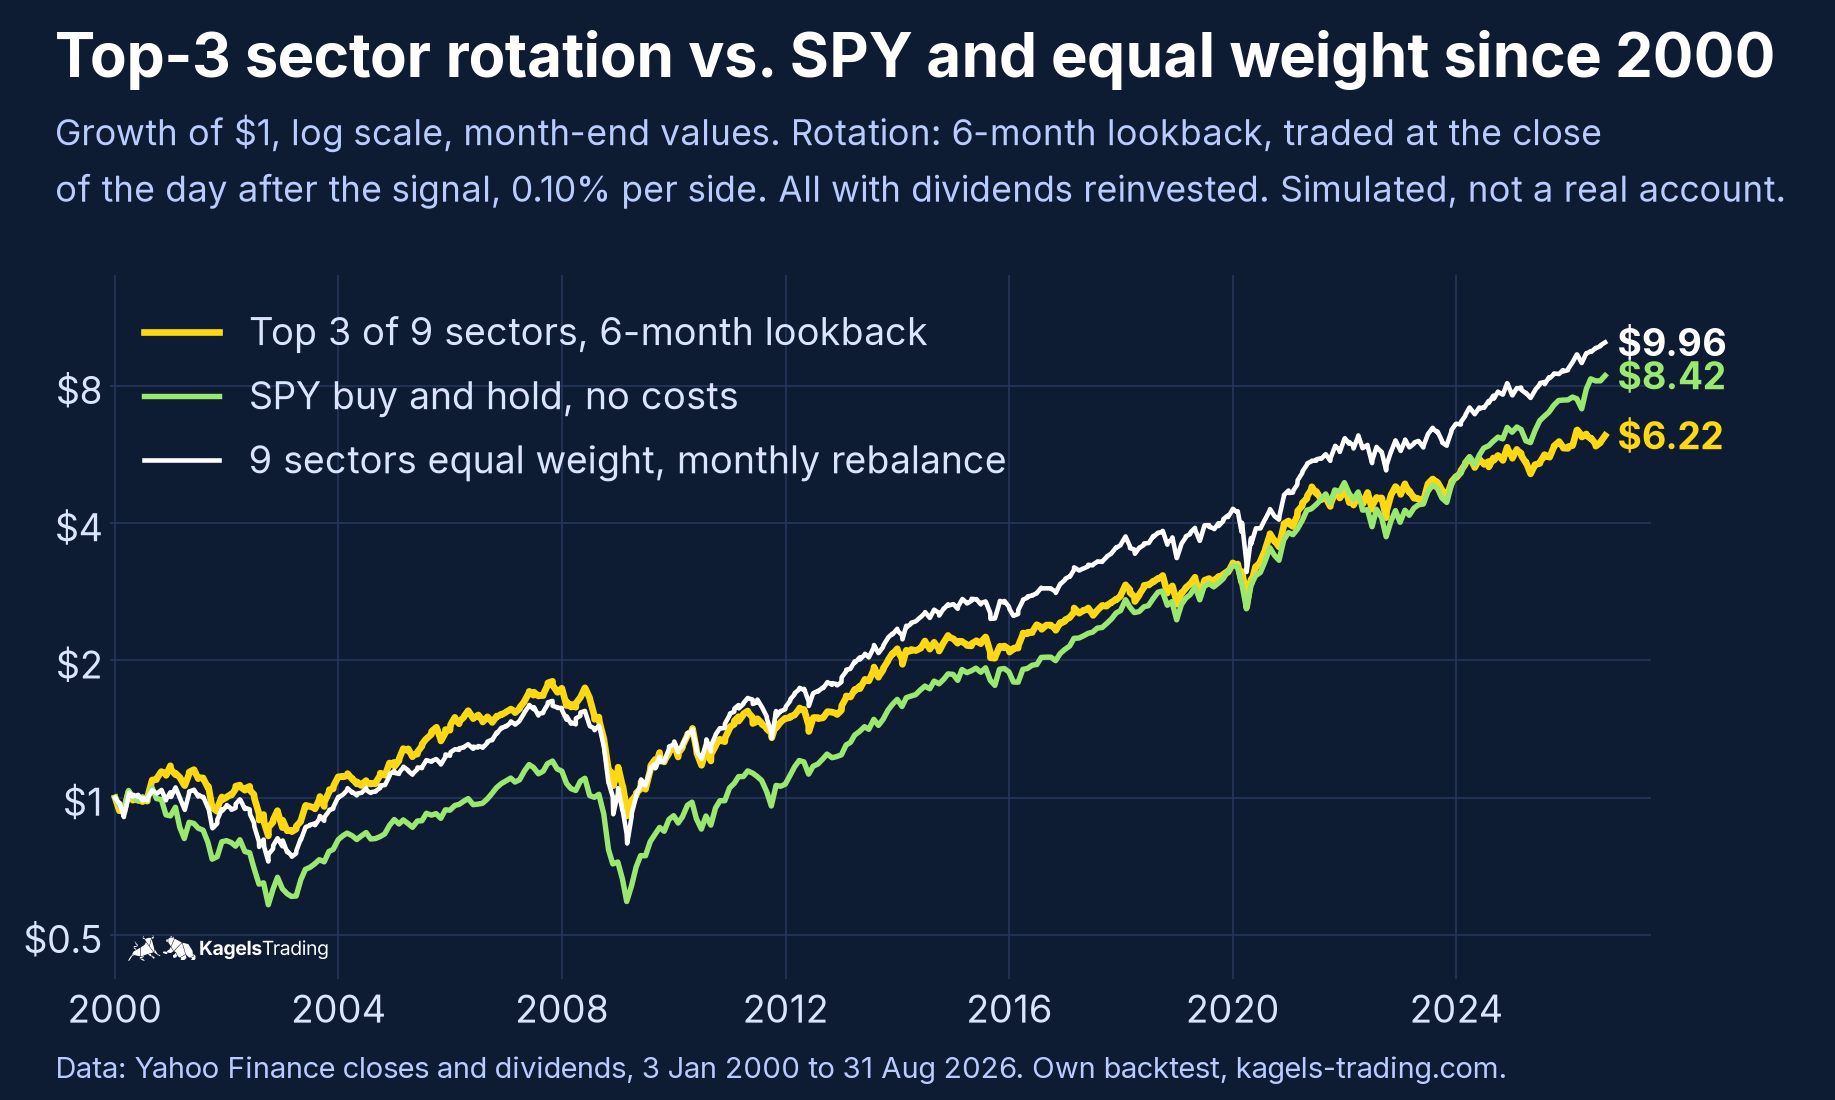
The result is uncomfortable for the strategy. Traded the day after the signal, none of the three variants beat SPY: the 3- and 6-month lookbacks lagged by about 1.2 to 1.3 percentage points a year, the 12-month lookback by 0.1. Simply holding all nine sectors in equal weight and rebalancing monthly beat every rotation variant without picking anything. The costs added up: the 3-month version traded about 77 percent of the portfolio’s value each month (buys plus sells), roughly 0.9 percentage points of costs a year.
The one-day delay explains our main difference from the German test. If you rank and trade at the same month-end close, our numbers match the German page within 0.1 point: 7.5, 7.5 and 8.5 percent a year, with the 12-month version slightly ahead of SPY. That convention assumes you can compute the ranking and fill the order at the very closing price that produced it, a small look-ahead. Waiting one day cost the 12-month version 0.3 points a year and turned a narrow lead into a narrow deficit. A result that flips on a single day of timing is not a reliable edge.
The real advantage was risk, not return. All three variants lost less than SPY in their worst phase, the 12-month version about ten percentage points less. Still, the rotation beat SPY in only 8 to 12 of the 25 full calendar years from 2001 to 2025. Anyone running such a system sits behind the index for several years at a time.
 Click to enlarge
The chart shows how much the result depends on the start date. The 6-month rotation built its lead in the bear markets of 2000 to 2002 and 2008; in January 2009 it was 60 percent ahead of SPY. Through the long bull market after that, the lead shrank. It first fell behind SPY in August 2021 and has been behind since February 2024. Someone who started in 2009 lived mostly through the dry spell.
The limits of this test belong to the result. The nine sectors are US baskets that have changed over time, for example with the 2018 and 2023 reclassifications. Twenty-seven years contain only three recessions. Other lookbacks, a different number of sectors or a trend filter may give different results. If you want to test your own rule, fix it in advance and test it properly, for example with backtesting in TradingView.
Case study: sector rotation in 2026, as of 11 September
2026 showed how far the sectors can drift apart. Between energy and consumer discretionary lay almost 53 percentage points from New Year to 11 September. The table is a dated snapshot of the eleven US sector funds at the close on Friday, 11 September 2026.
| Sector (ETF) | Since 1 January | 3 months |
|---|---|---|
| Energy (XLE) | +47.7% | +14.9% |
| Technology (XLK) | +30.7% | +2.6% |
| Materials (XLB) | +13.3% | −0.2% |
| Industrials (XLI) | +11.7% | −1.3% |
| Real estate (XLRE) | +9.3% | −2.5% |
| Consumer staples (XLP) | +8.7% | −1.5% |
| Health care (XLV) | +7.7% | +7.8% |
| Financials (XLF) | +5.4% | +9.2% |
| Utilities (XLU) | +0.6% | −3.2% |
| Communication services (XLC) | −3.8% | +0.7% |
| Consumer discretionary (XLY) | −5.0% | −2.7% |
| SPY (S&P 500) | +12.7% | +3.9% |
Own calculation, Yahoo Finance daily closes and dividends, total return. Since 1 January = 31 December 2025 to 11 September 2026; 3 months = 11 June to 11 September 2026.
The most visible rotation ran out of the previous year’s winners. Communication services gained 23.1 percent in 2025 and was down in 2026. Energy, up only 7.9 percent in 2025, led by a wide margin. Over the same stretch, WTI crude rose from $57.26 to $101.27 a barrel (EIA spot).
The last three months showed a second, quieter move. Besides energy, financials and health care gained clearly, while technology managed only 2.6 percent after its strong start. Health care ahead and consumer discretionary behind fits the late cycle of the model. Utilities did not fit, because rising yields held them back.
What these numbers say about the future is honestly little. They describe which sectors led on 11 September 2026 and how leadership had changed since January. The chart at the top shows what came next: energy’s lead narrowed in late September, widened again in October and fell back in early November. Within a sector, single industries can go their own way; our guides to semiconductor stocks, the SOX index and the Nasdaq Biotechnology Index show that for chips and biotech.
Pitfalls when you act on rotation
The most expensive trap is the headline. By the time everyone writes about a sector, much of the outperformance has usually already happened. Rotations also start, stall and start again; switching at every attempt means paying costs several times.
Relative strength sorts within the market; it does not protect you from a bear market. In 2008/09 the best sectors still lost 17 to 23 percent. Holding only three sectors also means concentration risk, and in a taxable account each switch at a gain can realize a capital gain that a buy-and-hold investor would defer.
Sector rotation: a map, not a timetable
Leadership passes between sectors all the time, and seeing it is worth the effort. A ratio chart or a Relative Rotation Graph shows you in minutes which sectors lead and which lose ground. In 2026, the XLE/SPY line showed early that energy, not communication services, was shaping the year.
As a strategy, sector rotation delivers less than the colorful cycle clock promises. In our three recessions the textbook held cleanly only once, and monthly momentum rotation did not beat SPY after costs once trades were placed a day after the signal. Its measurable benefit was the smaller drawdown. In my view, a look at the sector ratios belongs in every weekly review; a fixed rotation rule belongs only in an account where it was tested properly first.
This article is market analysis and education, not investment advice. Backtest results are simulated and do not guarantee future returns.
Frequently asked questions about sector rotation
What is sector rotation in simple terms?
Sector rotation means market leadership shifting from some sectors to others. You see it when one sector’s ratio against the market rises while another’s falls, for example energy gaining on SPY while consumer discretionary loses ground.
Which sectors are cyclical and which are defensive?
Industrials, consumer discretionary, financials, materials, energy and technology count as cyclical. Consumer staples, health care and utilities count as defensive. Utilities and real estate also react strongly to bond yields and often do not behave defensively when rates rise.
Does sector rotation work as an investment strategy?
As business-cycle timing, hardly. A study of US data from 1948 to 2007 found a risk-adjusted outperformance (Jensen’s alpha) of 2.3 percent a year before costs, even with perfect foresight of the cycle. In our own backtest from 2000 to August 2026, monthly momentum rotation returned 7.0 to 8.2 percent a year after costs, against 8.3 percent for SPY.
How do I build a sector ratio chart in TradingView?
Type two tickers separated by a slash in the symbol field, for example XLE/SPY. TradingView then shows the price ratio as its own chart. A rising line means the first fund is doing better than the second, even if both are falling. The plain ratio leaves out dividends.
Does a rising sector ratio mean money is flowing into that sector?
Not necessarily. A rising ratio shows that the sector’s return beat the market’s. It can also rise because the rest of the market was sold harder. Actual fund flows come from separate data on ETF and fund creations and redemptions.
Which sector led in 2026?
Energy, by a wide margin. As of 11 September 2026, XLE was up 47.7 percent for the year with dividends, ahead of technology at 30.7 percent and materials at 13.3 percent. Consumer discretionary and communication services were both down. By 6 November, XLE’s gain stood at 40.5 percent against 8.7 percent for SPY.
This article is translated from the German edition on kagels-trading.de.
More Stocks & Commodities guides
- Choose a silver stock
Best Silver Stocks 2026: 10 Companies Compared
Ten silver producers, streamers and explorers compared on 2025 output, costs, dividends and chart levels after the record highs of early 2026.
- Choose a gold stock
Best Gold Stocks 2026: Miners and Royalty Companies
Eleven gold producers, royalty companies and developers compared on output, costs, dividends and 2026 takeovers, plus gold miner ETFs.
- Choose an oil stock
Best Oil Stocks 2026: Majors, Pipelines and Refiners
The largest oil producers, pipelines and refiners by market value and dividend, the MLP tax traps and the main energy ETFs.
- Choose a chip stock
Semiconductor Stocks 2026: AI Chips, Memory and Equipment
Chip designers, foundries, memory and equipment makers by market value, revenue and guidance, plus how the main semiconductor ETFs differ.
- Compare defense stocks
Defense Stocks 2026: US and European Stocks Compared
US and European defense stocks compared by backlog and price moves since 2025, what the main defense ETFs hold and the risks by region.