
Nasdaq 100 Forecast: Today, This Week and Beyond (NDX)


Nasdaq 100 forecast in 30 seconds
Right now
30,883 points at the close on Friday, 9 October 2026, about 1.5 percent below the new record of 31,361 from 6 October.
Short term
Price is fighting for the June high at 30,762. Above it I expect follow-through and new records; a pullback to about 29,800 is possible.
Key support
June high 30,762, August high 30,196, the gap zone around 29,800, the blue support line and the September low at 28,753.
Upside targets
Above the all-time high at 31,361 there is no old level left, so new record highs are to be expected.
On this page
- Nasdaq 100 forecast in 30 seconds
- Nasdaq 100 forecast for today and tomorrow: the hourly chart
- Nasdaq 100 forecast for this week and next week: the daily chart
- Nasdaq 100 forecast: the weekly chart
- Nasdaq 100 on the monthly chart: the bigger uptrend
- Three scenarios: which level decides
- Nasdaq 100 on the yearly chart: the long-term picture
- Nasdaq 100 long-term forecast: 2030, 2040 and 2050
- What is the Nasdaq 100?
- What moves the Nasdaq 100
- The most important Nasdaq 100 stocks
- How this forecast is made
- Conclusion: the Nasdaq 100 forecast stays bullish
- Frequently asked questions about the Nasdaq 100 forecast
- Please note
Nasdaq 100 forecast for today and tomorrow: the hourly chart
 Click to enlarge
All charts on this page show the Nasdaq 100 price index NDX at the close on Friday, 9 October 2026. They were exported on 11 October between 15:32 and 16:17 CEST, and every caption names its own time. The levels come from my own charts.
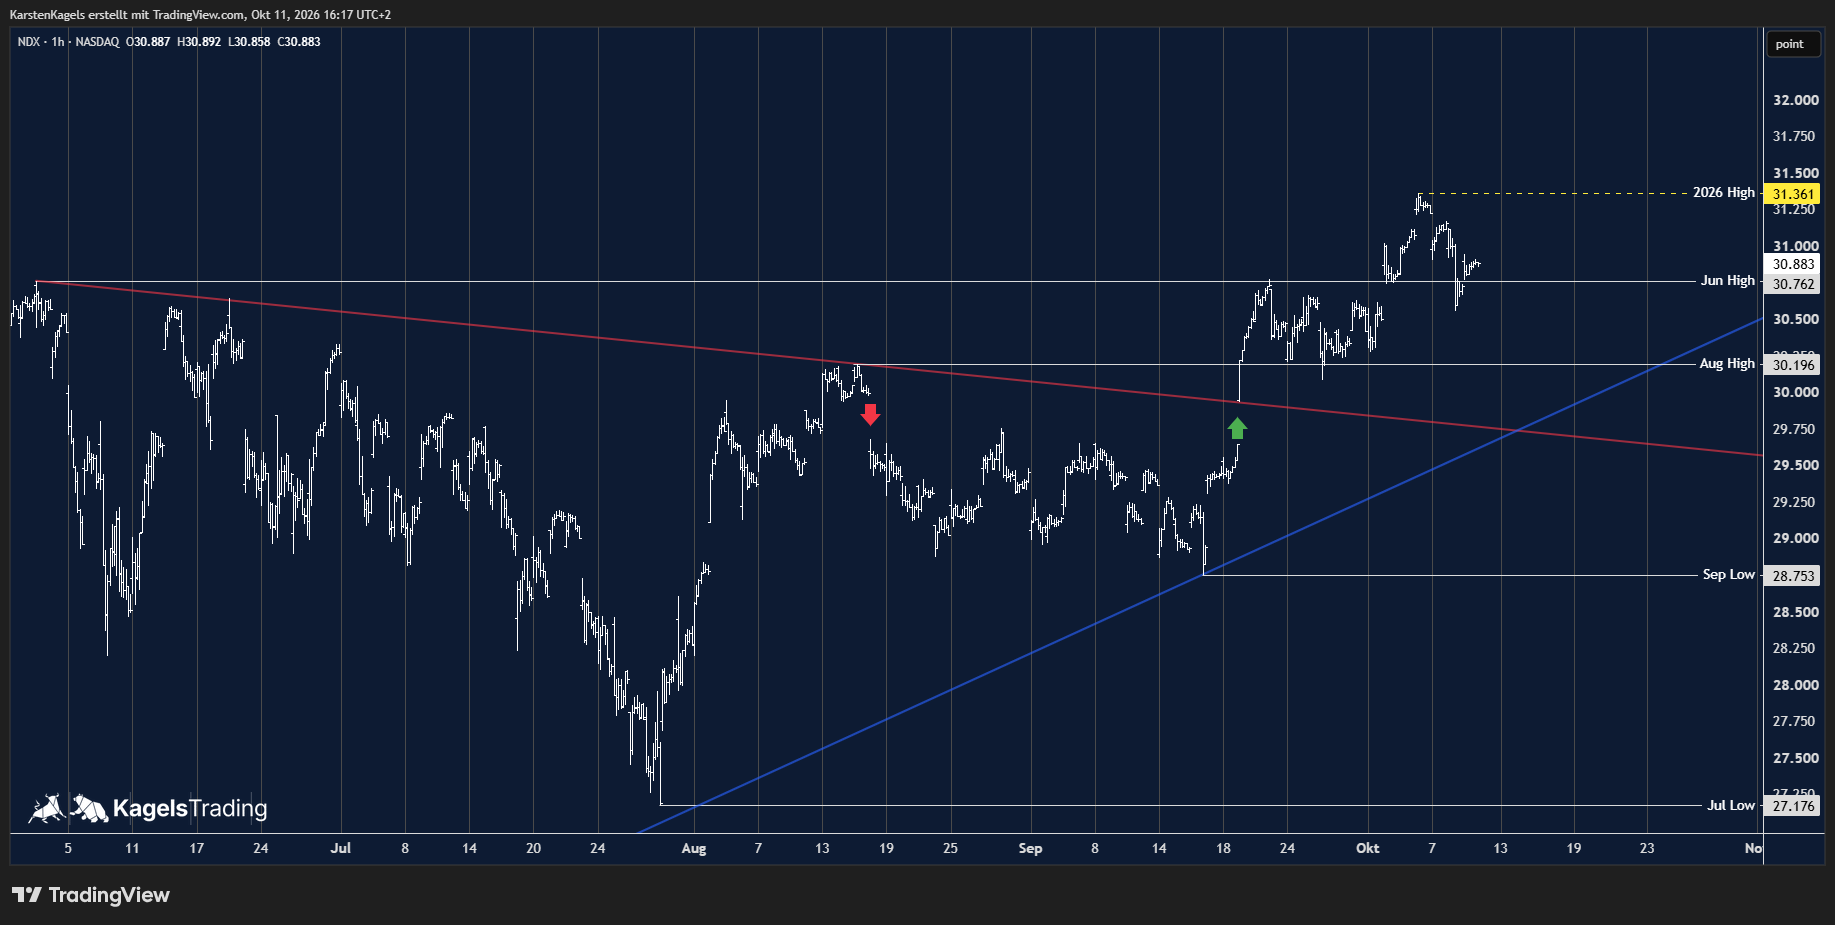
On the hourly chart the Nasdaq 100 has reached a new all-time high above the June high. On 6 October it rose to 31,361 points. Since then price has corrected slightly, but it is holding the June high at 30,762 points and closed at 30,883 on Friday. How it develops from here remains to be seen.
Two gaps are still drawn in the chart. On 18 August the market tore a gap downwards, on 21 September one upwards. The candles in between stand in the chart like an island, which is why this pattern is called an island reversal. It counts as a reversal signal, because the same price area was first left in a jump and then jumped over again.
The zone around 29,800 points is the correction target. Both gaps lie close together there and have not been closed so far. Open gaps often pull price back, so the zone can work like a magnet. A pullback there would not, on its own, break the uptrend.
The red downtrend line and the blue support line both run towards this zone. On the hourly chart both trend lines run close to the gaps. Price has broken out above the red line, which now counts as possible support.
How the broad market is doing belongs to the picture. The whole market is covered in the S&P 500 forecast, and the Dow Jones forecast gives the industrial cross-check.
Resistance
- 31,361
Price at analysis30,883
Support
- 30,762
- 30,196
- 29,800
Nasdaq 100 forecast for this week and next week: the daily chart
Week of 12 October 2026
 Click to enlarge
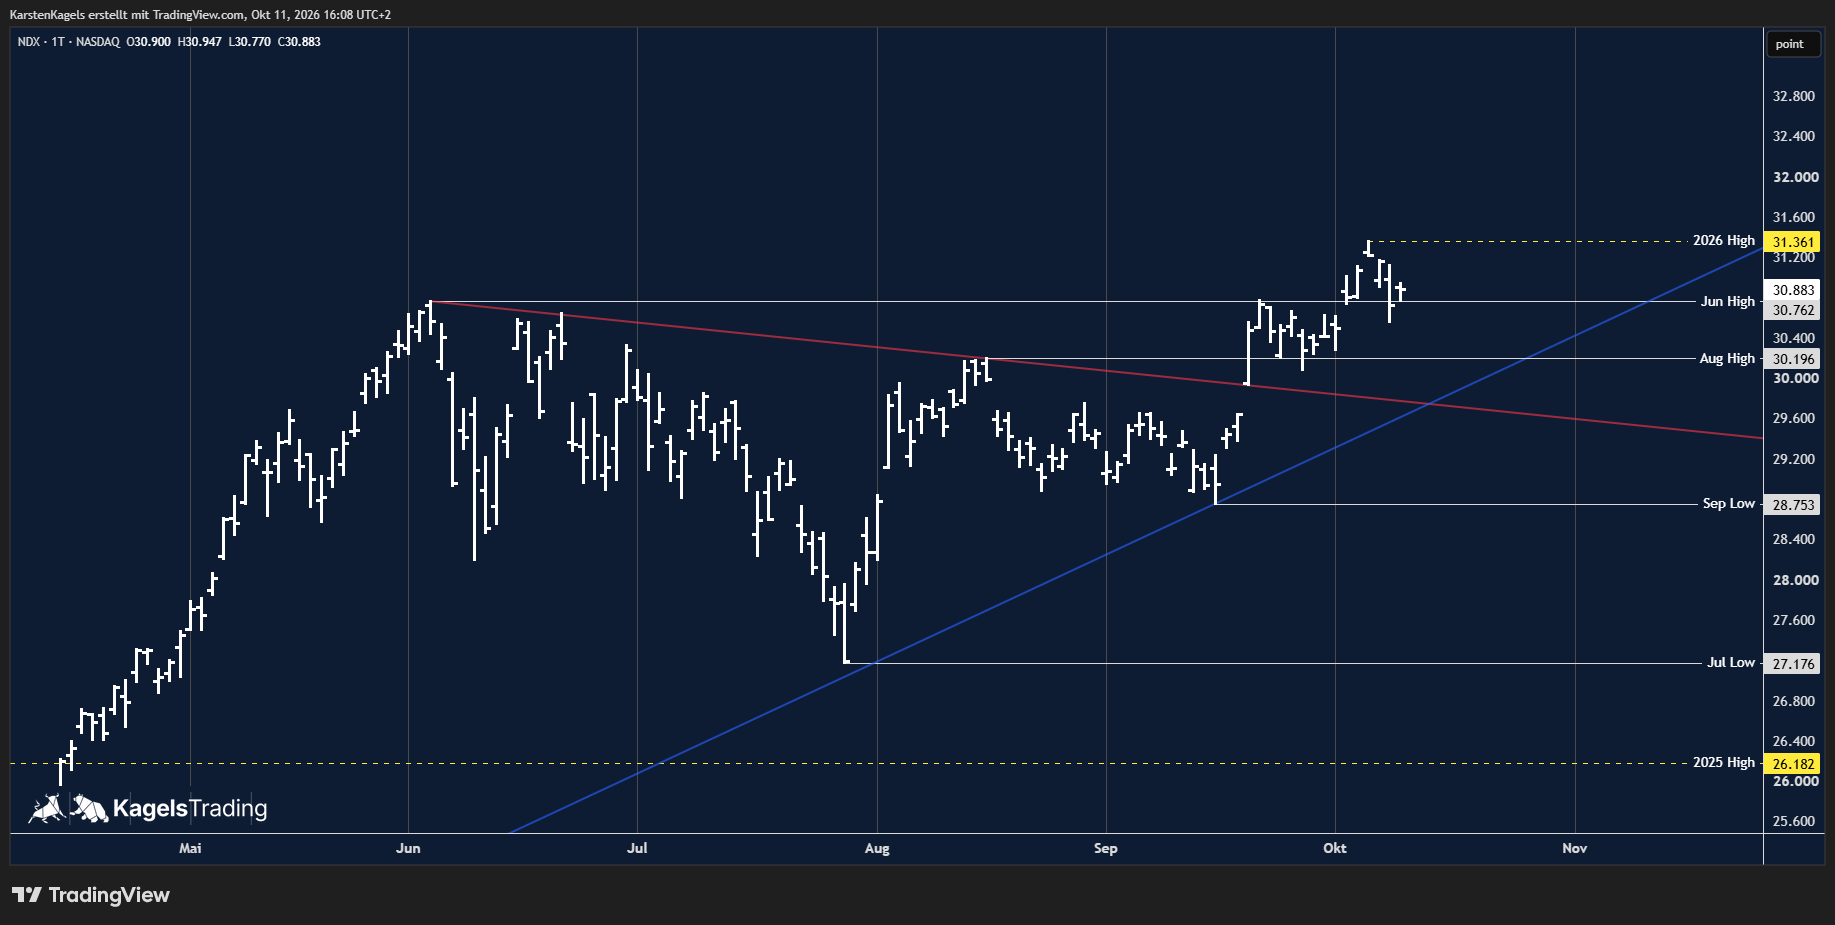
The breakout above the August high carried on above the June high in October. The June high at 30,762 points was the previous all-time high. On 6 October the index marked a new all-time high at 31,361 points and has traded above the June high since then.
The June high should work as support in the coming week. The index closed at 30,883 points on Friday, and the daily low at 30,770 points was only just above that level. If it holds, the breakout stays valid.
Next to the June high, the August high is the next support. It sits at 30,196 points and was the resistance the index overcame in September. The blue support line also stays important. It held price at the September low at 28,753 points.
Above it, follow-through and new record highs are to be expected. As long as price stays above the June high and the blue line, the picture stays positive. The red downtrend line from the June high has been overcome and runs towards the zone of the two gaps around 29,800 points. A pullback there would be a possible correction target.
A short look back: in March the Nasdaq 100 marked its low of the year at 22,841 points and ran from there to the then all-time high in June at 30,762 points. After that it moved sideways until September, and the July low at 27,176 points was the lowest low of that phase. The breakout followed in September, and on 6 October came the new record at 31,361 points.
Resistance
- 31,361
Support
- 30,762
- 30,196
- 29,800
- 28,753
- 27,176
Nasdaq 100 forecast: the weekly chart
 Click to enlarge
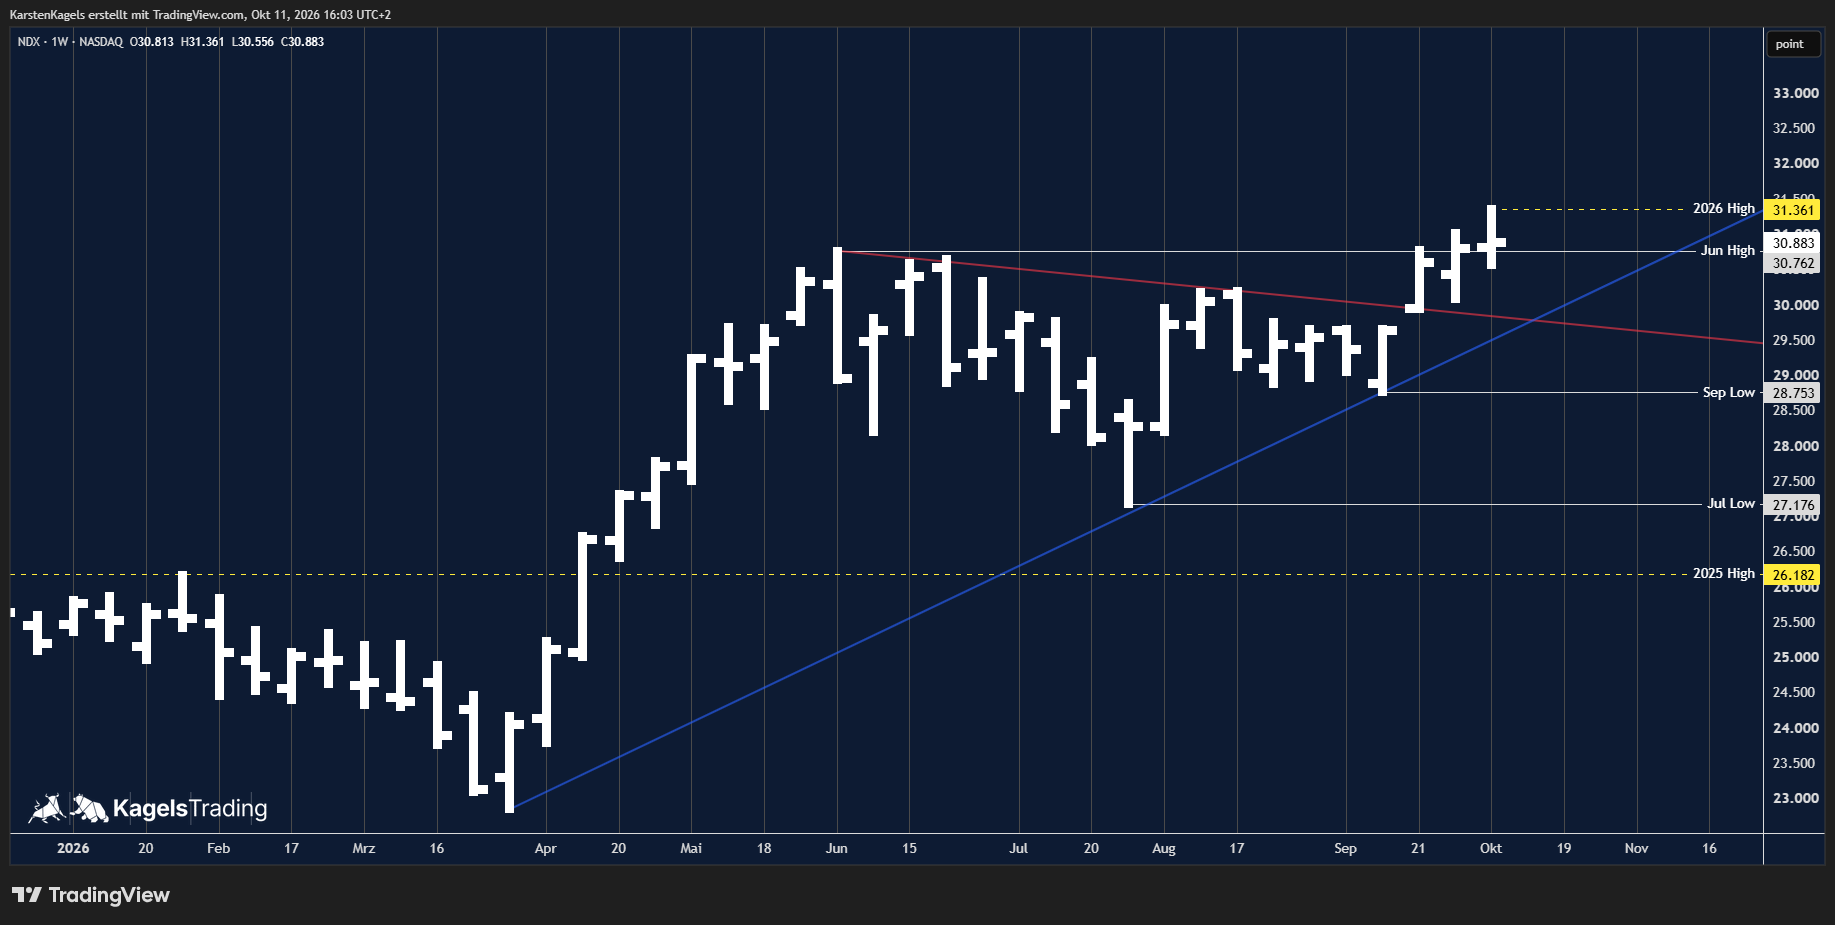
On the weekly chart the triangle has resolved to the upside. The downtrend line from the June high and the blue support line from the March 2026 low ran ever closer together. Since the week of 21 September price has been above the red line, so the chart picture stays positive.
The current all-time high sits at 31,361 points and dates from 6 October 2026. Last week price came back from there and is still fighting for the June high at 30,762 points. The weekly close was at 30,883 points.
The outlook stays positive as long as the blue support line is not broken. It runs up from the March 2026 low and touches the July low and the September low on the way. Only below it does the chart picture turn negative.
A pullback into the zone around 29,800 points is possible at any time. That is where the two gaps from the hourly chart and the red downtrend line lie. A pullback there does not damage the uptrend.
Resistance
- 31,361
Support
- 30,762
- 28,753
- 27,176
- 26,182
Nasdaq 100 on the monthly chart: the bigger uptrend
 Click to enlarge
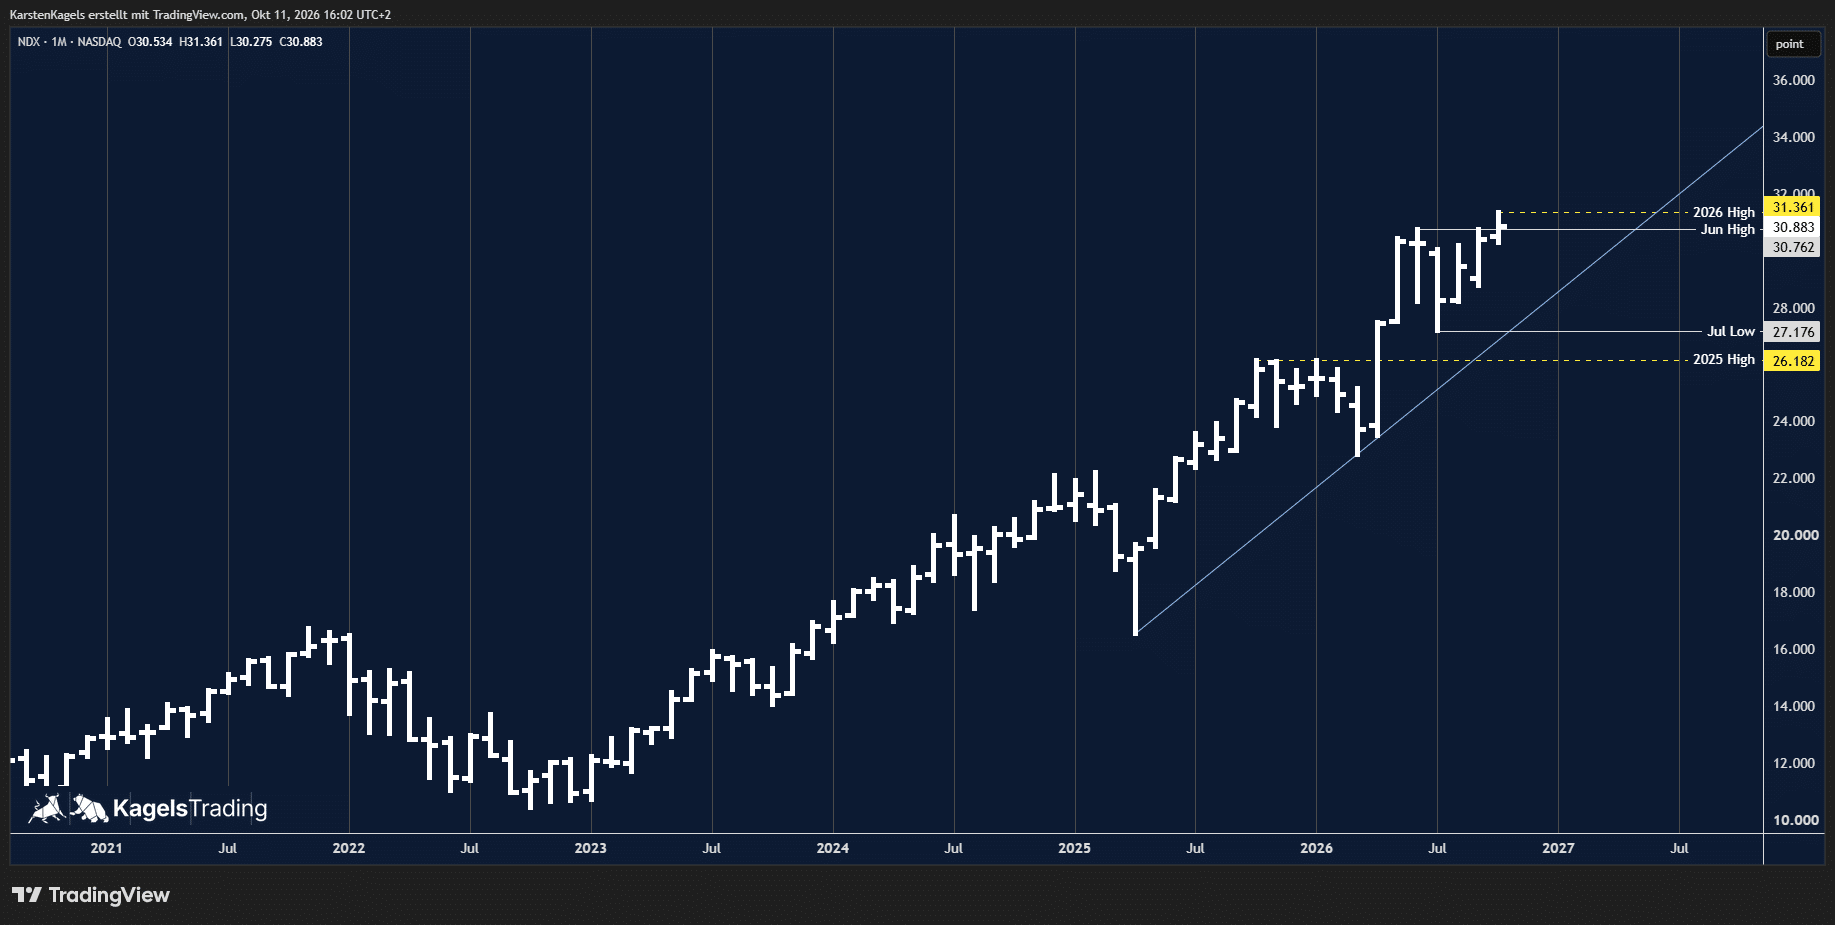
The monthly chart shows the long-term direction, and that direction is up. Since the low of April 2025 the Nasdaq 100 has almost doubled. The October candle stands at the highest monthly level of the whole move, so the long-term picture is clearly bullish.
This monthly chart uses a linear scale. Equal distances on the vertical axis stand for equal point changes: the step from 28,000 to 30,000 is as tall as the one from 14,000 to 16,000. The two yearly charts below use a logarithmic scale instead, where equal percentage changes appear equally large.
The consolidation since June has been left to the upside in October. July, August and September moved sideways, and a consolidation is nothing other than a breather inside the trend. With the new all-time high in October that pause is resolved, and resolved to the upside.
The blue support line connects the lows of April 2025 and of March and April 2026. It supports the uptrend structure. Next to this line, the July low at 27,176 points is the most important support, and the two lie close together.
My broader assessment stays bullish. What counts here is price action and the drawn blue support line. Moving averages are not displayed in this image.
Resistance
- 31,361
Support
- 30,762
- 27,176
- 26,182
Three scenarios: which level decides
The June high above and the blue support line below decide. The price levels come from my charts; the closing conditions are an editorial guideline. They are reference levels, not order rules.
Bullish: the breakout above the June high carries
Applies as long as the Nasdaq 100 stays above the June high at 30,762 points on a daily close. Then the breakout is confirmed, and follow-through with new record highs above the all-time high at 31,361 points is to be expected. Above that there is no old level left. A daily close below the June high cancels this path.
Pullback: the zone around 29,800 as a magnet
Applies if the Nasdaq 100 falls below the June high on a daily close. Then the zone around 29,800 points is the correction target. The gaps from 18 August and 21 September lie there, together with the red downtrend line and the blue support line. A pullback there would not yet be a trend reversal, as long as price stays above the blue line. This path is cancelled as soon as price rises back above the June high.
Bearish: the breakout becomes a failed breakout
Applies if the Nasdaq 100 falls below the blue support line on a daily close. Then the breakout would have become a failed breakout, and the September low at 28,753 points comes into view. Below it follows the July low at 27,176 points, and just below that the blue support line runs on the monthly chart. A daily close back above the June high cancels this path.
Resistance
- 31,361
Support
- 28,753
- 27,176
Nasdaq 100 on the yearly chart: the long-term picture
 Click to enlarge
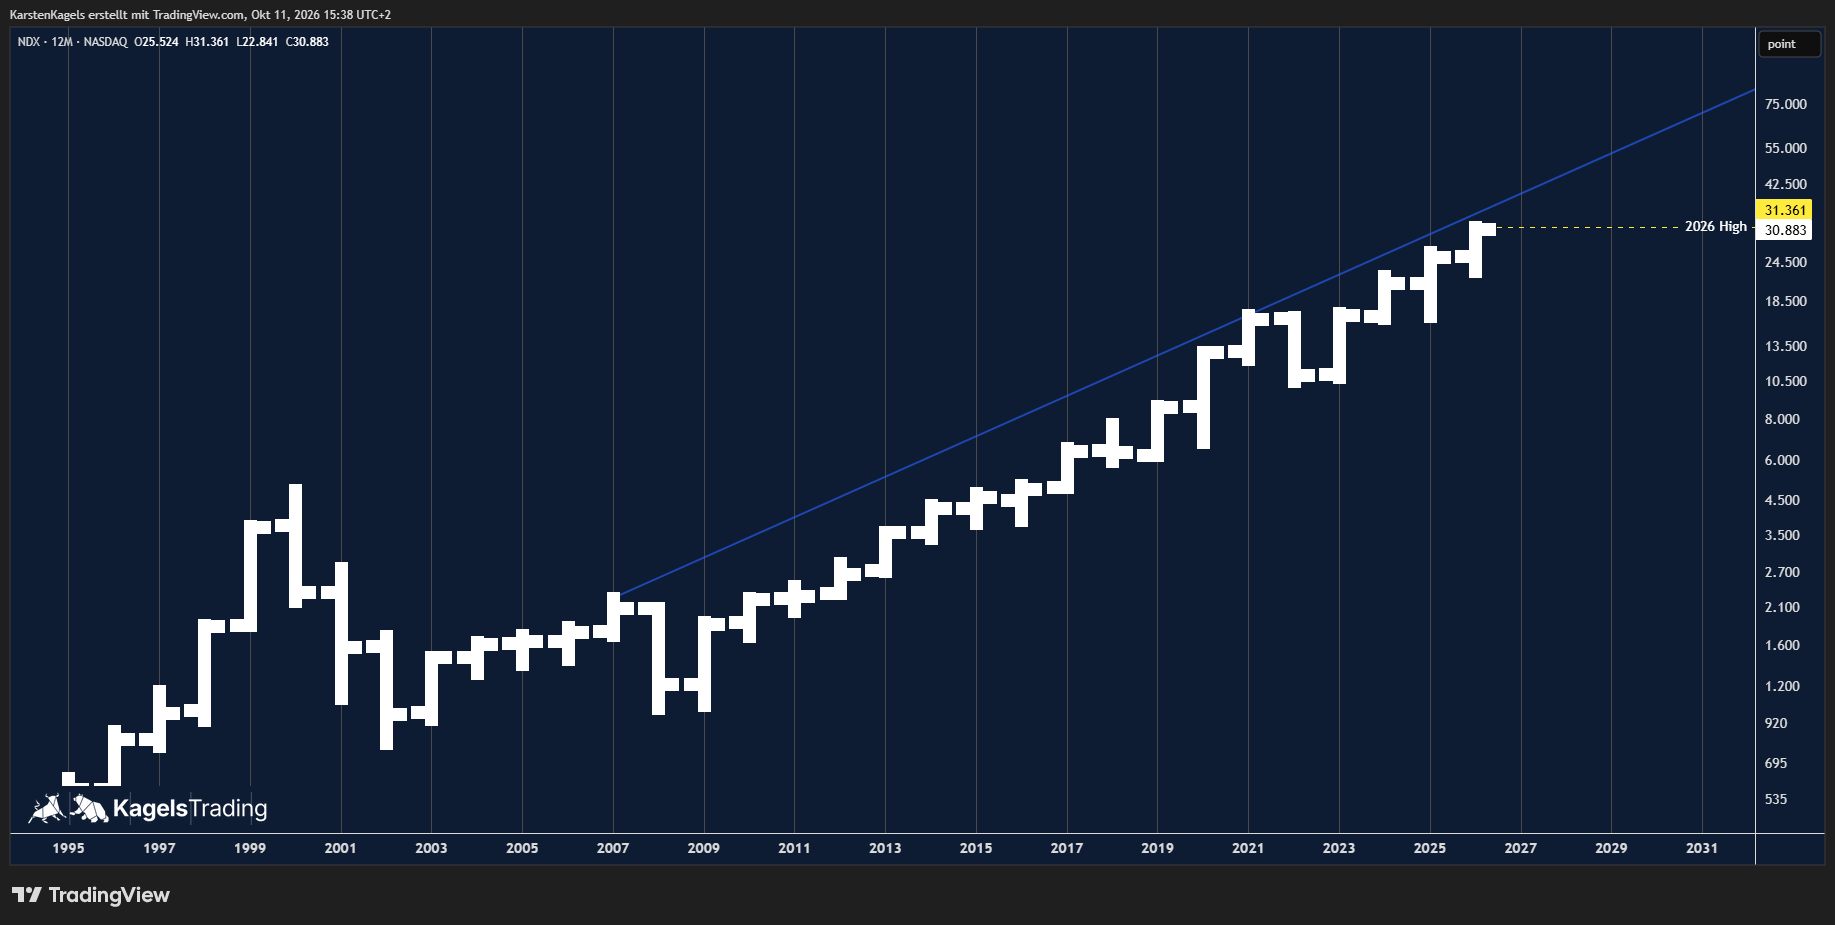
The yearly chart shows the index since the 1990s. Every candle stands for one year, and the scale is logarithmic. The two big slumps are easy to see: the bursting of the dotcom bubble from 2000 and the financial crisis of 2008. After both the index went on to new records.
A diagonal could cap the way up at some point. The blue line in the chart connects the 2007 high with the 2021 high. Price has come closer to it, but it still lies above the record. That is not a price target and not a level for the coming months, but a possible resistance line for the years ahead.
Nasdaq 100 long-term forecast: 2030, 2040 and 2050
 Click to enlarge
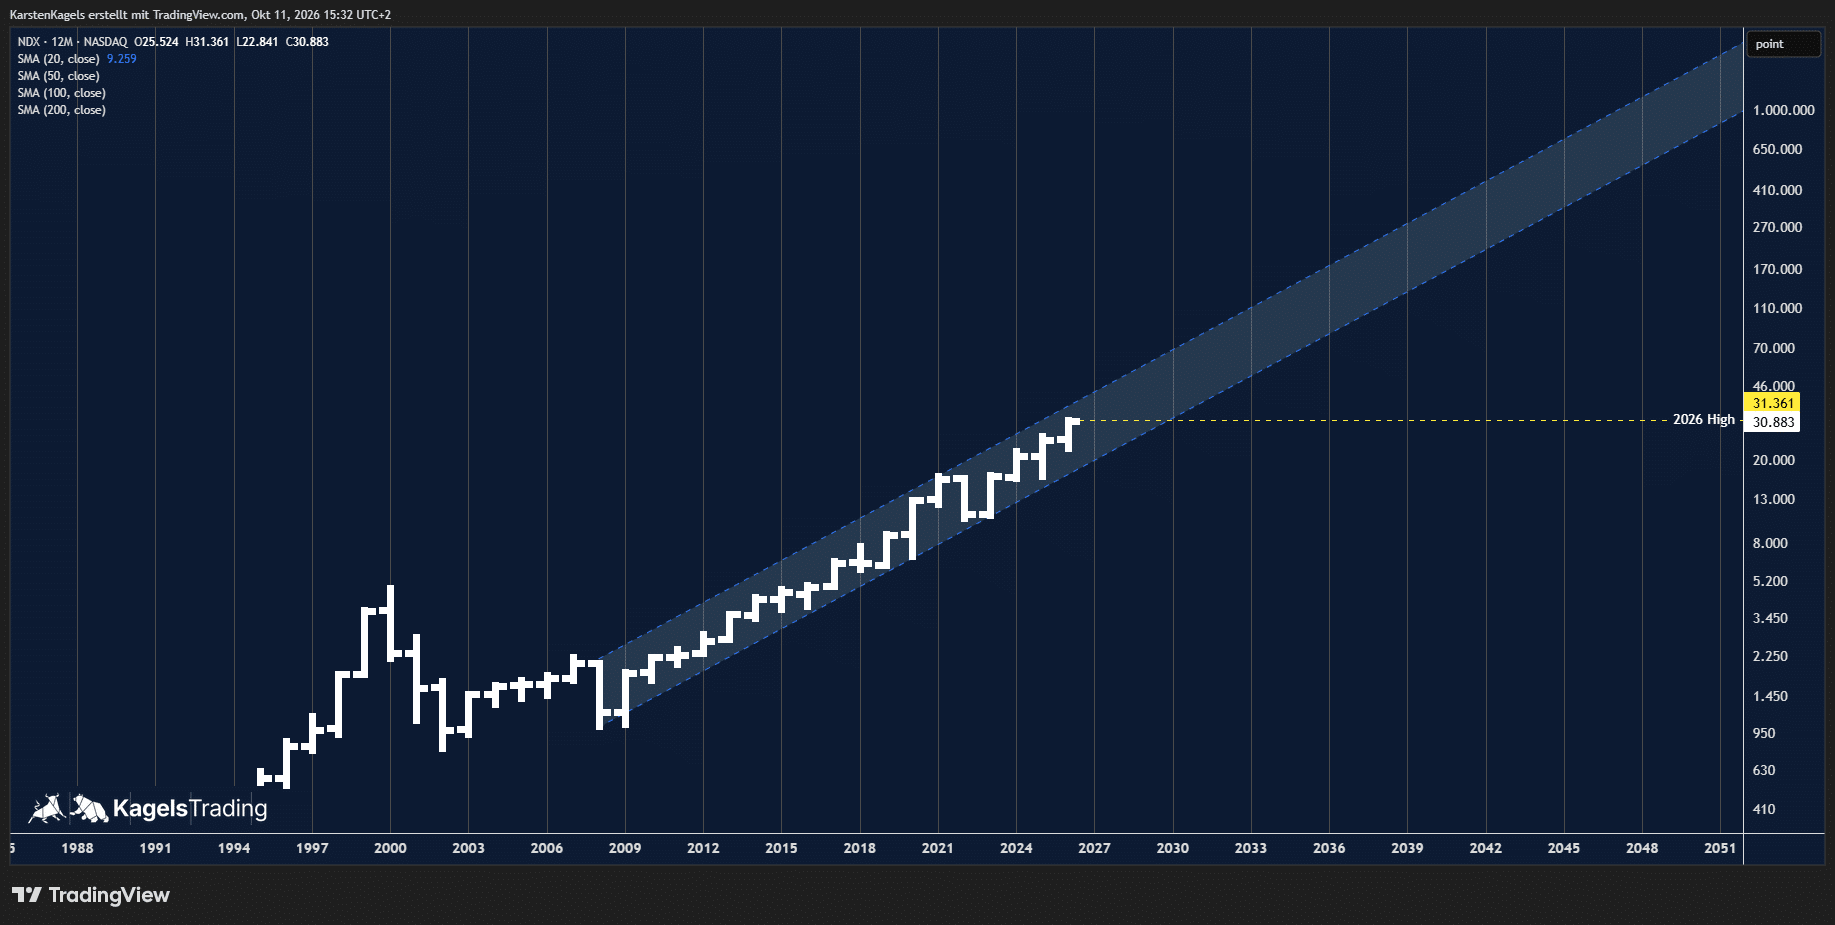
On the yearly chart the Nasdaq 100 has been running in a rising trend channel since the financial crisis. The channel starts at the lows of 2008 and 2009. In November 2008 the index fell to 1,019 points; on 6 October 2026 it reached its all-time high at 31,361 points. That is about thirty times as much. Even the slump of 2022, with its low at 10,441 points, did not leave this channel.
This chart is on a logarithmic scale as well. An index that has risen from around 1,000 to more than 30,000 points can hardly be shown any other way. On a linear scale the rise up to about 2010 would look almost flat, although the index swung strongly back then too. The logarithmic scale shows equal percentage steps as equal distances, as explained on the yearly chart above.
If this growth path continues, I expect around one million points for 2050. For that I extended the trend channel beyond the year 2050, and the years 2030, 2040 and 2050 can be read off the time axis. In 2050 the lower edge of the channel sits at about 750,000 points and the upper edge at about 1.6 million. This extension describes a scenario, not a minimum. Going from 30,883 points on 9 October 2026 to the end of 2050 would need about 15.4 percent price growth per year for one million points.
Over the past 20 years the Nasdaq 100 rose by about 14.6 percent a year. From the end of 2005 to the end of 2025 the pure price index, without dividends, climbed from 1,645.20 to 25,249.85 points, which is the average annual gain including compounding. Three calendar years ended in the red: 2008 with 41.9 percent, 2018 with 1.0 percent and 2022 with 33.0 percent. That record limits neither future losses nor drawdowns along the way. The calculation examples below all start at 30,883 points on 9 October 2026 and assume a steady 14.6 percent a year up to the end of each year. That is an assumption for the arithmetic, not an expected return.
Nasdaq 100 forecast 2030. At the 2030 marker my extended trend channel runs from roughly 32,000 to 70,000 points. The values are read off the chart and rounded. The separate calculation example at 14.6 percent a year gives about 55,000 points by the end of 2030, a little above the middle of the channel. A slump can take the index below the lower edge of the channel as well, so the range is not a reliable corridor for what happens next.
Nasdaq 100 forecast 2040. In 2040 the trend channel lies between about 155,000 and 335,000 points. The calculation example at 14.6 percent a year gives about 215,000 points by the end of 2040 and lands in the lower half of the channel. This range also assumes that the growth path holds. Over 14 years the compounding effect is strong: every year the index grows on a higher base. That is the continuation of the pace so far, not a guarantee.
Nasdaq 100 forecast 2050. At the 2050 marker my extended trend channel runs from about 750,000 points to 1.6 million points. This range assumes that the drawn growth path holds for decades. The separate calculation example at 14.6 percent a year gives about 839,000 points by the end of 2050. Even small changes in the growth rate lead to large differences over this period. The index can leave the channel and stay well below these values for many years. The April 2025 low at 16,542 points is a historical reference level on the monthly chart. It does not mark a safe downside limit.
What is the Nasdaq 100?
The Nasdaq 100 is a stock index covering 100 of the largest non-financial companies listed on Nasdaq that meet the index’s listing and selection rules, weighted by a modified market capitalization.
The NDX, to use its official ticker, was launched on 31 January 1985 and counts as the most important gauge of the US technology sector. Unlike the broader Nasdaq Composite, the Nasdaq 100 deliberately excludes financial companies and concentrates on technology, communications and biotechnology names. Nasdaq publishes the admission rules and the current composition on its official index page for the Nasdaq-100.
The index composition is reviewed once a year and the weighting is adjusted quarterly. As an approximation for the weighting, the fund positions of the iShares NASDAQ-100 UCITS ETF (DE) from 17 September 2026 are used here: the five companies NVIDIA, Apple, Alphabet, Microsoft and Micron together came to 33.32 percent of fund assets, with both share classes of Alphabet counted together. ETF weights and index weights can differ. A few market movers therefore largely determine the direction of the whole index, which has to be kept in mind when reading the chart analysis.
The Nasdaq 100 forecast is a technical assessment of the future price development of the US technology index NDX, based on chart analysis, moving averages and support and resistance zones.
What moves the Nasdaq 100
The price of the Nasdaq 100 is driven by several factors that go beyond pure chart analysis. For traders it is worth knowing these drivers, because they are often what triggers moves at the support and resistance zones identified above.
Around the big expiry day, short-term moves can get stronger. On the big expiry day, futures and options expire at the same time and institutional investors adjust their index positions. Higher swings are not guaranteed by it, though. The last one was on 18 September 2026, the next follows on 18 December 2026.
Federal Reserve rate policy
The Fed raised its key rate on 16 September 2026. It lifted it by 0.25 percentage points to 3.75 to 4.00 percent, the first rise since July 2023. Higher rates weigh above all on growth stocks, because future profits are then discounted more heavily. The Nasdaq 100 still closed practically unchanged that day and turned during the session exactly at its uptrend line. Where rates go from here is covered in our Fed interest rate decision post.
Artificial intelligence and tech earnings
The AI boom has been a major price driver in the Nasdaq 100 since 2023. Companies such as NVIDIA, Microsoft and Alphabet benefit disproportionately from rising demand for AI infrastructure. The quarterly numbers of these heavyweights move the whole index. Disappointing earnings from a single market mover can trigger corrections of several percent in the short term.
Anthropic is preparing a possible IPO. On 1 June 2026 the company confidentially submitted a draft registration statement to the SEC, without a number of shares offered and without an offering price. How we assess it while there is neither a price nor an official date is in our Anthropic stock forecast. How you can invest before and after the listing is in our guide to Anthropic stock.
The build-out of AI data centers also drives industrial metals. Alongside tech stocks, demand for copper benefits in particular. Our copper forecast looks at this growing source of demand.
Geopolitics and trade policy
Tariff disputes, export restrictions on semiconductors and geopolitical tensions directly affect the supply chains of the technology companies in the Nasdaq 100. Traders should keep a close eye on the economic calendar, above all on tariff announcements and trade agreements.
The most important Nasdaq 100 stocks
Five companies together account for about a third of fund assets. The percentages below are portfolio weights of the iShares NASDAQ-100 UCITS ETF (DE) from 17 September 2026. The five largest companies in the fund come to 33.32 percent together, with Alphabet represented by two share classes:
- NVIDIA (NVDA), 8.46%: maker of graphics processors and AI chips, the largest position in that ETF
- Apple (AAPL), 7.89%: one of the largest companies in the world by market value, with a broad product range
- Alphabet (GOOGL and GOOG), 6.22%: Google search and the Gemini AI model, with two share classes in the index
- Microsoft (MSFT), 5.90%: cloud and AI business through Azure and Copilot
- Micron Technology (MU), 4.85%: memory chips, among other things for AI data centers
Amazon only follows in sixth place. It comes to 4.31 percent, behind it AMD with 3.91 percent. The quarterly numbers of these heavyweights often move the whole index by several hundred points, so their dates belong in every look at the Nasdaq 100 chart analysis.
SpaceX is new in the index. SpaceX has been listed on Nasdaq since 12 June 2026 and was added to the Nasdaq 100 with effect from 7 July 2026. In the iShares ETF named above, its portfolio weight was 1.31 percent on 17 September. What the company is worth and how to buy the stock is in our guide to SpaceX stock.
How this forecast is made
The basis of the Nasdaq 100 forecast is technical analysis, read top-down. I analyze the NDX chart from the higher time frames (yearly, monthly and weekly chart) down to the daily chart. That is how I find the price areas where supply or demand could come into the market, as explained in our guide on how we identify support and resistance.
These are the tools involved:
- Highs and lows: daily, monthly and yearly highs and lows as horizontal support and resistance
- Trend lines and trend channels: rising and falling lines at the highs and lows, and the triangle on the weekly chart
- Gaps: open price gaps that the market often runs back into later
- Logarithmic scale: on the two yearly charts, so that equal percentage moves appear equally large; the hourly, daily, weekly and monthly charts are linear
The forecast is updated regularly and takes account of upcoming economic dates where higher volatility can be expected. All price targets named are probability scenarios, not guarantees.
More forecasts from our team are in the forecast overview.
Conclusion: the Nasdaq 100 forecast stays bullish
The Nasdaq 100 reached a new record high on 6 October. It rose to 31,361 points and closed on Friday at 30,883 points, just above the June high. As long as the June high at 30,762 points and the blue support line hold, follow-through and new record highs are to be expected.
Above the record there is no old level left. The triangle on the weekly chart has resolved to the upside, and so has the consolidation on the monthly chart. A pullback into the zone around 29,800 points, where the two gaps lie, would be a possible correction target without breaking the uptrend. As a discretionary price action trader, what I watch above all is how price defends the June high: if it holds above, it runs on, and a fall back leads to the gaps.
Use the levels as orientation, not as a guarantee. Set your stop so that it fits your risk management, and size your position accordingly. I update this forecast regularly with new charts.
Frequently asked questions about the Nasdaq 100 forecast
What is the current Nasdaq 100 forecast?
The current Nasdaq 100 forecast is bullish. On 6 October 2026 the index marked a new all-time high at 31,361 points and closed on Friday, 9 October, at 30,883 points, just above the June high at 30,762 points. If it holds above that level, follow-through and new record highs are to be expected. Support comes from the June high, the August high at 30,196 points, the zone around 29,800 with two open gaps and the blue support line.
Will the Nasdaq 100 rise in 2026?
The chart picture argues for a continuation of the uptrend. The index has left the triangle on the weekly chart to the upside, ended the consolidation on the monthly chart and reached a new record high at 31,361 points. The picture would only turn negative below the blue support line.
Why is the Nasdaq 100 rising right now?
In chart terms the index broke out of a triangle with a gap on 21 September and marked a new all-time high on 6 October. Together with the down gap from 18 August that created an island reversal. Behind it stand the investments the big tech companies are making around artificial intelligence. What can slow it down is Federal Reserve rate policy, which lifted the key rate to 3.75 to 4.00 percent on 16 September.
Which factors influence the Nasdaq 100?
The most important drivers are Federal Reserve rate policy, the quarterly results of the large tech companies (NVIDIA, Apple and Microsoft in particular), the AI boom, and geopolitical trade disputes and export restrictions.
What is the difference between NASDAQ and NASDAQ-100?
Nasdaq is the exchange, the Nasdaq 100 one of its stock indices. The Nasdaq Composite covers the shares of many Nasdaq companies that qualify under its rules, including financial companies. The Nasdaq 100 concentrates on 100 of the largest qualifying companies outside the financial sector. Selection rules and weighting caps mean it is not a list of the 100 largest stocks re-sorted every day.
How high can the Nasdaq 100 rise by 2030?
My extended yearly chart shows a range of roughly 32,000 to 70,000 points for 2030. It assumes that the drawn growth path holds. A separate calculation example with an annual return of 14.6 percent gives about 55,000 points by the end of 2030, starting from 30,883 points on 9 October 2026. Both are conditional scenarios, and actual prices can end up well below the channel range.
Which stocks carry the most weight in the Nasdaq 100?
The fund positions of the iShares NASDAQ-100 UCITS ETF (DE) from 17 September 2026 give an idea: NVIDIA 8.46 percent, Apple 7.89 percent, Alphabet 6.22 percent counting both share classes, Microsoft 5.90 percent and Micron 4.85 percent. Together that is 33.32 percent of fund assets. These ETF weights can differ from the official index weights.
Please note
The scenarios are a personal assessment based on experience and are not a certainty. This is market analysis, not investment advice. Trade only with a position size that fits your own risk management.
This forecast is translated from the German edition on kagels-trading.de.
How our forecasts are made and reviewed: How we work.