
Interest Rate Forecast 2026 and 2027: Fed and 10-Year Yield
The Fed raised its rate to 3.75 to 4.00% on 16 September, and most of its policymakers expect one more step by the end of the year. The 10-year Treasury yield closed at 5.31% on 5 October, its highest close since May 2002. As long as it stays above the 2023 high at 4.98%, the pressure on rates points up. Next come the inflation data on 14 October and the Fed meeting on 28 October.
Interest Rate forecast in 30 seconds
Where rates stand
Fed funds target 3.75 to 4.00% since 17 September. The 10-year Treasury yield closed at 5.27% on 6 October, after 5.31% the day before.
Will rates go up?
The Fed itself expects one more hike in 2026. The median of its projections is 4.1% for the end of 2026 and again for 2027.
The level that matters
The 2023 high at 4.98% on the 10-year yield. Above it the trend points up, below it the next stops are 4.75% and 4.44%.
What is next
US inflation data on 14 October. Then the Fed decision on 28 October and the ECB one day later.
On this page
- Interest Rate forecast in 30 seconds
- Will interest rates go up? The short answer
- Interest rate forecast, short term: the 10-year yield before the Fed meeting
- Fed rate forecast: one more hike in the Fed's own projections
- 10-year Treasury yield forecast for the end of 2026
- Interest rate scenarios: higher, lower, or a range
- Interest rate forecast 2027: high for longer
- Interest rate forecast for the next five years
- ECB and German Bund compared: the gap to the US has widened
- What drives interest rates now
- Key dates for interest rates
- How this forecast is made
- Frequently asked questions about the interest rate forecast
- Please note
Will interest rates go up? The short answer
Yes, the policy rate is more likely to rise than to fall in the coming months. The Federal Reserve raised the target range for the federal funds rate to 3.75 to 4.00% on 16 September 2026, its first increase since July 2023, with a vote of 12 to 0. In the minutes of that meeting, published on 7 October 2026, most participants judged that another increase "would likely be appropriate by year end".
The Fed's own projections point the same way. In the projections of 16 September, the median for the end of 2026 is 4.1%. Of the 18 participants, 16 expect at least one more step this year and two expect none. For the end of 2027 the median is again 4.1%. That does not rule out cuts during 2027, and some participants project lower rates by then.
Long-term rates have already moved. The 10-year Treasury yield rose from 4.19% on 2 January to 5.31% on 5 October 2026, the highest close since May 2002, according to the U.S. Treasury and the Fed's H.15 data. My assessment: as long as the 10-year yield holds above 4.98%, the trend in long rates stays up.
Interest rate forecast, short term: the 10-year yield before the Fed meeting
- 10-year yield until 28 October4.98% – 5.44%
 Click to enlarge
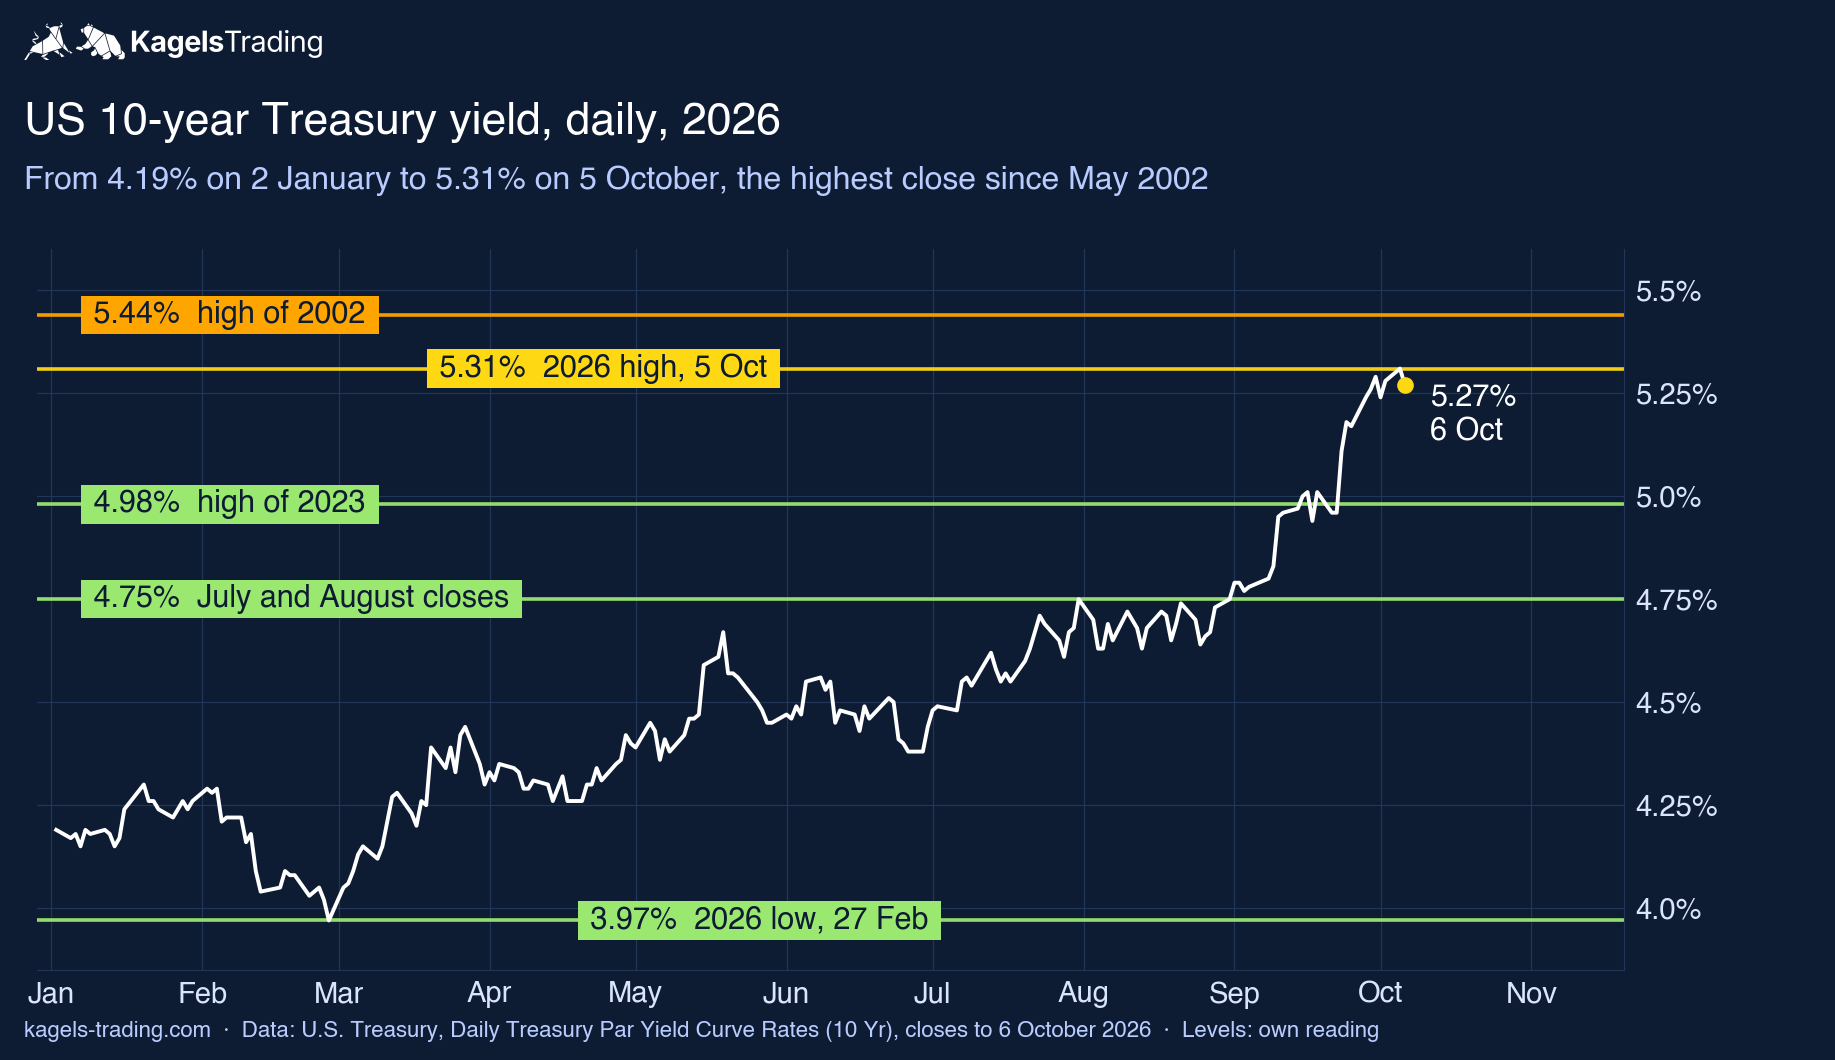
The chart shows a strong rise since the summer, with a steep last leg in late September. On 22 September the 10-year yield still closed at 4.96%; since 23 September every close has been above the 2023 high at 4.98%. On 5 October it reached 5.31%, on 6 October it closed at 5.27%. All figures are daily closes from the U.S. Treasury par yield curve.
The 2023 high at 4.98% is now the level that has to hold. It capped the yield for almost three years. A break above such an old high often turns it into support, and that is how I read it here. The 5.00% mark sits right next to it.
Above the price, the 2002 high at 5.44% is the next resistance. After that comes the 2001 high at 5.54%. As long as neither level breaks, 4.98% to 5.44% is my orientation range until the Fed meeting on 28 October. The first test is the September consumer price index on 14 October.
A close below 4.98% would weaken the short-term picture. The next stop would then be 4.75%, where the yield closed both July and August. How nervous the bond market is right now can be followed in the MOVE index of Treasury volatility.
Resistance
- 5.54%
- 5.44%
- 5.31%
Support
- 4.98%
- 4.75%
- 4.44%
Fed rate forecast: one more hike in the Fed's own projections
- Fed target, upper bound, end of 20264.00% – 4.50%
 Click to enlarge
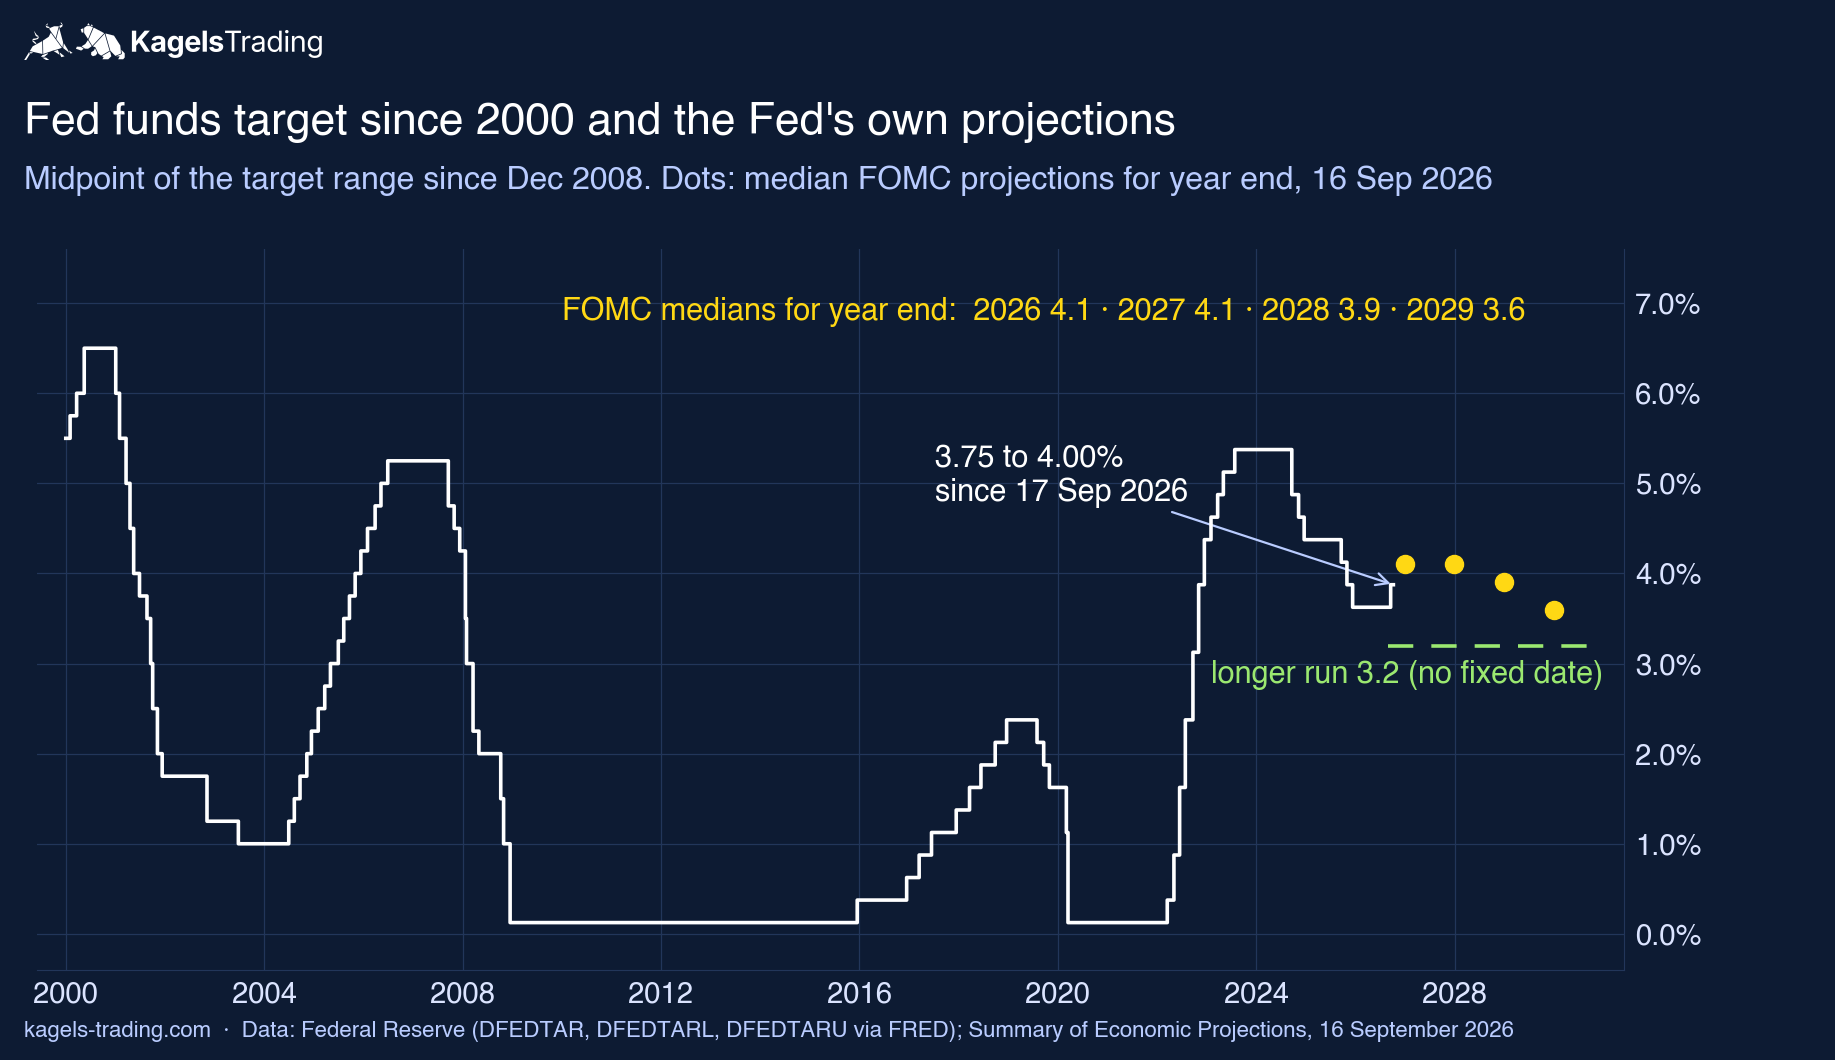
The Fed rate decides the short end, and the Fed has turned. After three cuts in late 2025 the range stood at 3.50 to 3.75% for most of 2026. On 16 September the Fed raised it by a quarter point. The statement says the Committee "will deliver price stability" and gives no commitment for the next meetings. The full story is in our article on the Fed rate decision.
The dot plot of 16 September shows how far the Fed expects to go. For the end of 2026, 12 participants see the midpoint of the range at 4.125% (one more hike), 4 participants at 4.375% (two more) and 2 at today's 3.875%. That gives an upper bound between 4.00% and 4.50% at the end of the year, with 4.25% as the most common answer.
My base case is one more quarter point by the December meeting. The minutes speak of "by year end", not of the next meeting, and there are two dates left: 28 October and 9 December. The inflation data in between decide the timing. What futures traders are pricing for each meeting can be checked in the CME FedWatch Tool.
10-year Treasury yield forecast for the end of 2026
- 10-year yield, end of 20264.75% – 5.54%
 Click to enlarge
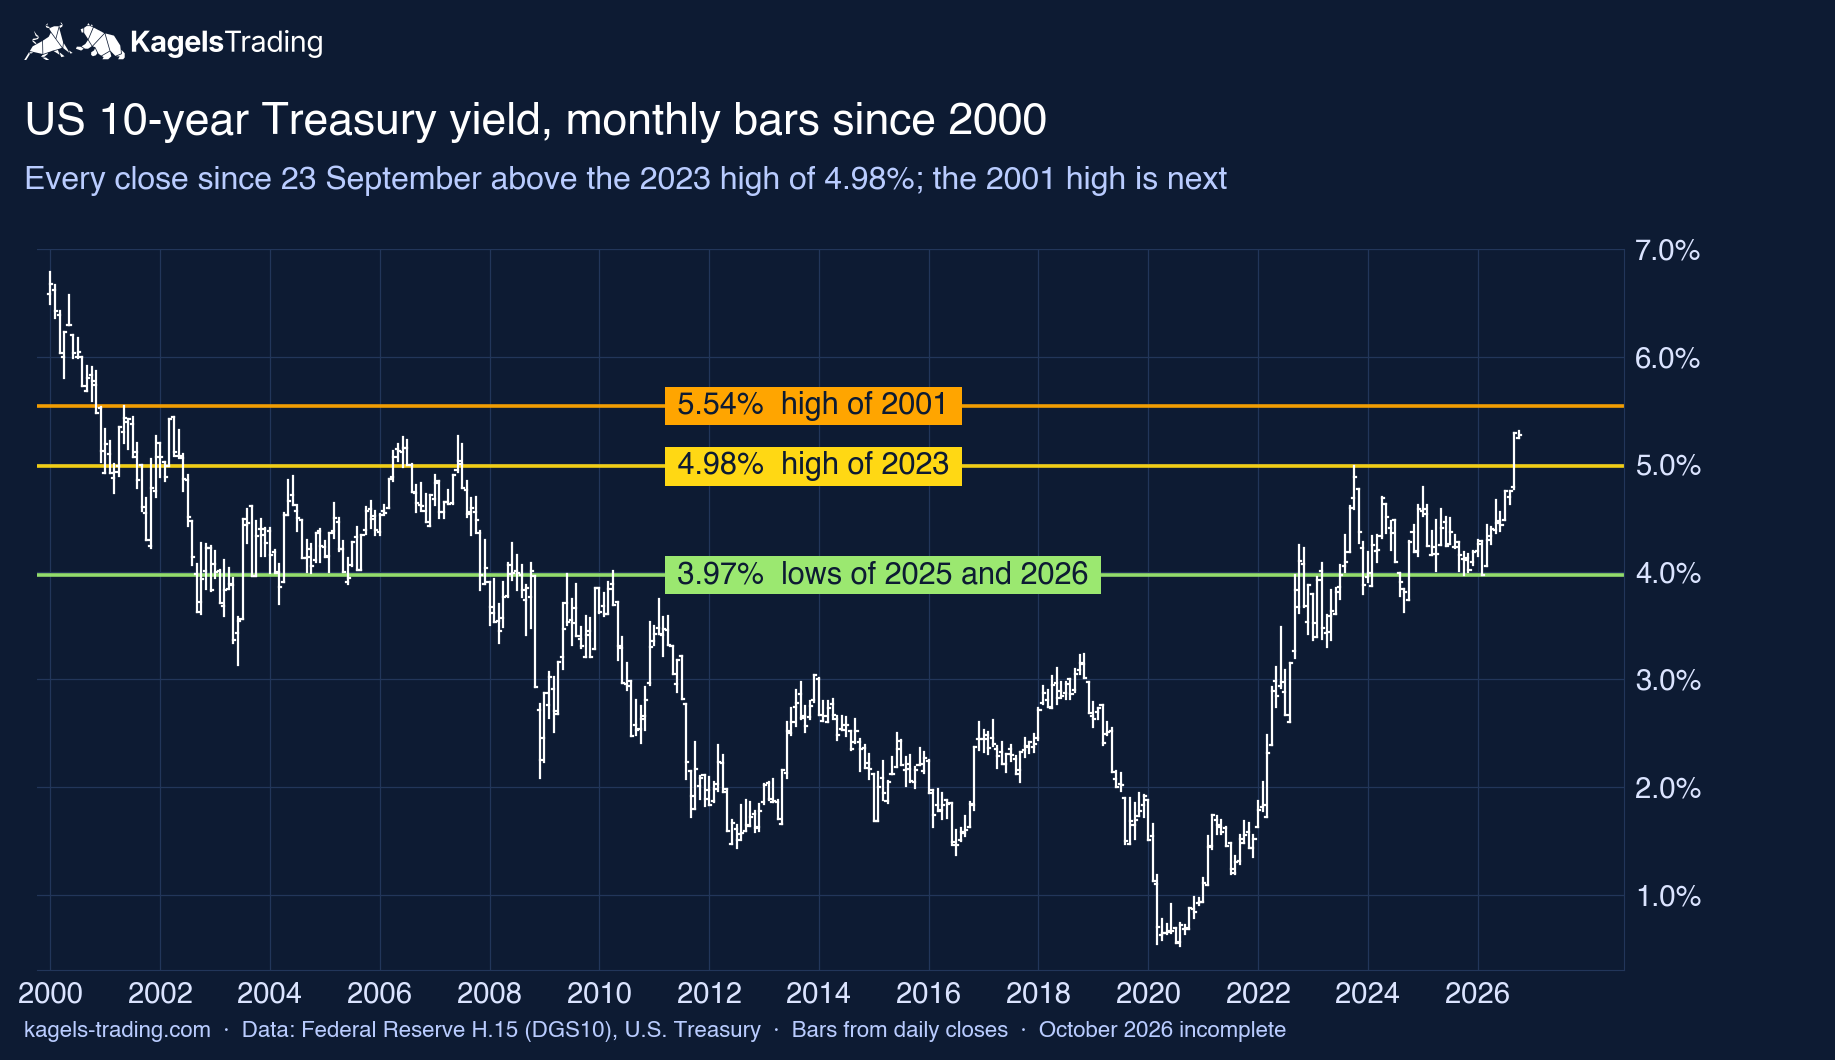
On the monthly chart, the 10-year yield has left a range that held for three years. From November 2022 to August 2026 it moved between the 2023 low at 3.30% and the 2023 high at 4.98%. In October 2025 and again in February 2026 it found its low at 3.97%. The September close at 5.29% is the first monthly close above 4.98% since June 2007.
For the end of 2026 my orientation range for the 10-year yield is 4.75% to 5.54%. The upper end is the 2001 high, the lower end the level of the July and August closes. A year-end close below 4.75% would mean the breakout has failed. A close above 5.54% would open the way to levels last seen in 2000.
The direction depends less on the Fed than on inflation and on how much compensation investors demand for lending long. That extra compensation is the term premium: what investors ask for holding one long bond instead of rolling short ones. Its drivers are listed further down under "What drives interest rates now".
Resistance
- 5.54%
Support
- 4.98%
- 3.97%
Interest rate scenarios: higher, lower, or a range
Two levels on the 10-year yield separate the scenarios. They are orientation levels from the chart, not order rules, and each scenario names the data that would make it more likely.
Higher rates: above 5.31%
A close above the 2026 high at 5.31% would confirm the trend. Targets are the 2002 high at 5.44% and the 2001 high at 5.54%. More likely if the September CPI on 14 October comes in hot, oil stays expensive and the Fed hikes already on 28 October.
Target zone: 5.44% – 5.54%
Lower rates: below 4.98%
A close back below the 2023 high would mean a false breakout. Then 4.75% and 4.44% come into view. More likely if inflation cools, oil prices fall sharply or a shock sends investors into safe government bonds.
Target zone: 4.44% – 4.75%
Range: between 4.98% and 5.31%
In between, the market is digesting the jump of September. That is where the yield stood on 6 October. Waiting for a close outside the range lets the market show the next direction.
Interest rate forecast 2027: high for longer
- Fed target, upper bound, end of 20273.75% – 4.50%
- 10-year yield, 20274.44% – 5.54%
For the end of 2027 the Fed's median stays at 4.1%. That is the same as for 2026, but a year-end figure says nothing about the path during the year, and the spread of views is wider: 8 participants see 4.375%, 6 see 4.125%, three see 3.625% and one sees 3.125%. Four participants therefore project a rate below today's midpoint. Seventeen of the 18 dots fit an upper bound of 3.75% to 4.50%.
For the 10-year yield in 2027 I use 4.44% to 5.54% as orientation. The lower end is the March high and June close of 2026, the upper end the 2001 high. These are chart levels, not a statistical confidence interval. As long as the Fed holds its rate around 4%, I do not expect the 10-year yield to fall back to the lows of 2025 and 2026 at 3.97%. Its PCE inflation projection for 2027 is 2.3%, with core inflation at 2.5%; if that comes true, the case for higher long rates weakens during the year.
Interest rate forecast for the next five years
- 10-year yield, 2028 to 20313.97% – 5.54%
Further out, the Fed expects its rate to come down slowly. The medians are 3.9% for 2028 and 3.6% for 2029, and the longer-run rate is 3.2%. For 2029 the views range from 2.9% to 3.9%. These are the Fed's projections from 16 September 2026, not promises.
A simple yardstick links the Fed rate to the 10-year yield. Since 2000 the 10-year yield has stood a median 1.40 percentage points above the Fed funds target, measured over 6,693 trading days. On 6 October 2026 the gap was almost exactly that: 5.27% against a midpoint of 3.875%. If it stayed at 1.40 points, the Fed's longer-run 3.2% would go with a 10-year yield of about 4.60%, and the 2029 median of 3.6% with about 5.00%.
The gap itself moves, which is why my five-year range is wide. From 2009 to 2015 the median was 2.41 points, from 2016 to October 2026 about 0.71. The 4.60% and 5.00% above are only arithmetic on the Fed's own numbers, and the historical gap is no forecasting rule. As a wide band for 2028 to 2031 I use the chart levels 3.97% to 5.54%, the lows of 2025 and 2026 below and the 2001 high above. It is an illustration of the range, not a probability.
ECB and German Bund compared: the gap to the US has widened
 Click to enlarge
The ECB is also raising rates, but from a lower level. It lifted the deposit facility rate to 2.25% in June and to 2.50% in September (decided on 10 September, in force since 16 September 2026). Against the Fed's 3.75 to 4.00%, the gap in policy rates is 1.25 to 1.50 percentage points. The next ECB meeting is on 29 October, one day after the Fed. Details are in our article on the ECB rate decision.
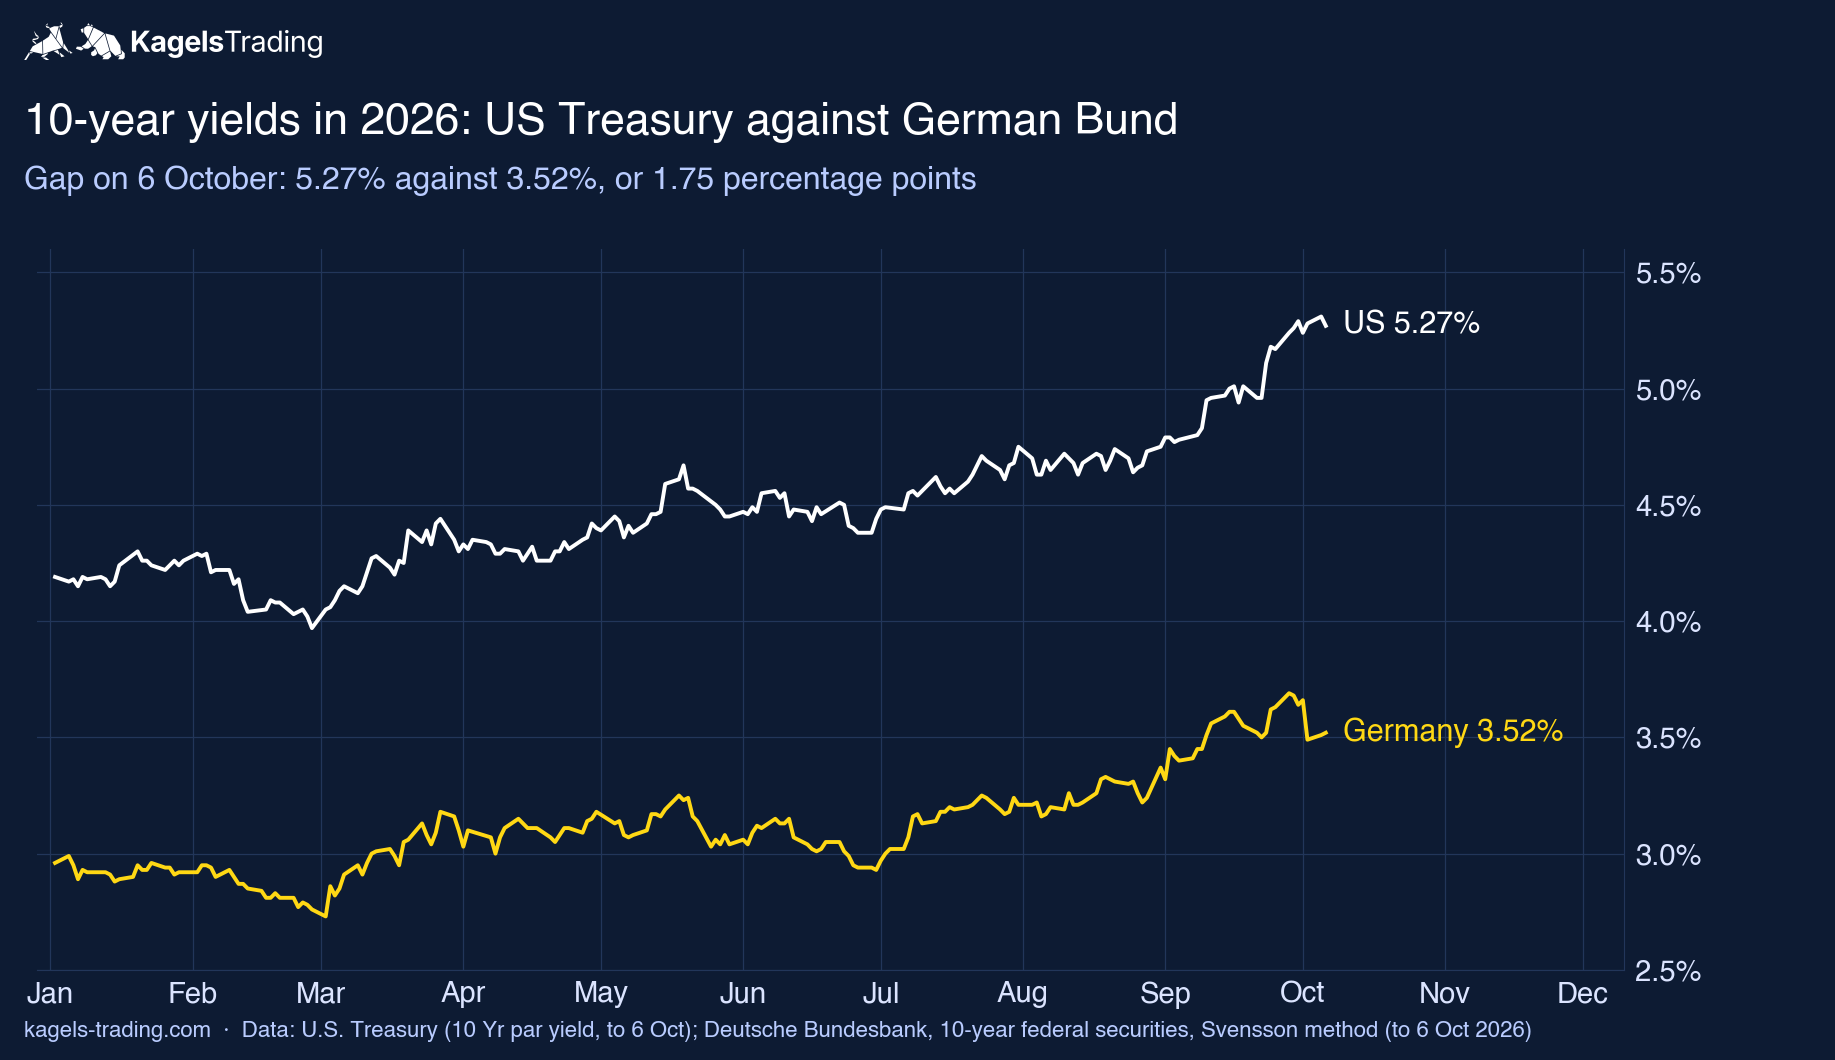
German 10-year yields have risen too, but less. According to the Deutsche Bundesbank, the 10-year federal yield reached 3.69% on 28 September 2026, the highest since April 2011, and stood at 3.55% on 7 October. On 6 October the US 10-year yield was 1.75 points higher (5.27% against 3.52%); on 2 January the gap had been 1.23 points. The two series are calculated differently (US par yield, German yield curve estimate), so the gap is an indicative comparison.
A wider US yield advantage usually supports the dollar. That is one reason why the gap matters for the EUR/USD forecast. For the German side in futures terms, see our Euro Bund future forecast. Both central banks are still raising rates, so I do not expect it to close quickly.
What drives interest rates now
Five forces decide whether rates rise further or turn. The Fed named most of them itself, in the statement of 16 September and the minutes published on 7 October 2026.
- Inflation: consumer prices rose 3.4% in the year to August 2026 (Bureau of Labor Statistics, published 11 September), with energy up 16.3% and core inflation at 2.4%. The Fed’s preferred measure, the PCE price index, also rose 3.4%, with a core rate of 3.0% (Bureau of Economic Analysis, 30 September). The Fed’s target is 2%.
- Oil and geopolitics: the minutes say geopolitical developments “pushed up prices for crude oil and refined fuel products”. Where crude could go is covered in our crude oil price forecast.
- The Fed: a higher policy rate lifts short-term yields directly. The 2-year yield stood at 4.79% on 6 October, against 3.47% on 2 January.
- Supply of bonds and the term premium: according to the minutes, market commentary pointed to uncertainty about the announcement and implementation of the Treasury’s buyback program and to heavy private borrowing for AI infrastructure as reasons for “higher term premiums and Treasury yields”.
- Growth: the Fed describes activity as “expanding at a solid pace”. A strong economy gives it no reason to cut.
Most of these forces currently point the same way. That is why I see the risk for long rates tilted up rather than down. The picture would change if oil prices fell sharply or if the inflation data of the coming months clearly cooled.
Key dates for interest rates
Five dates set the rhythm for the next weeks. Two inflation releases and three central bank decisions come in quick succession.
| Date | Event |
|---|---|
| 14 October 2026, 8:30 a.m. ET | US consumer prices for September (BLS) |
| 28 October 2026, 2:00 p.m. ET | Fed decision (meeting 27 to 28 October) |
| 29 October 2026 | ECB decision; US PCE inflation for September (BEA, 8:30 a.m. ET) |
| 9 December 2026 | Fed decision with new projections (meeting 8 to 9 December) |
| 17 December 2026 | ECB decision |
Fed decisions are released at 2:00 p.m. Eastern Time. In central Europe that is usually 8:00 p.m.; on 28 October it is 7:00 p.m., because Europe changes its clocks on 25 October and the US only on 1 November.
How this forecast is made
All numbers on this page come from primary sources, with the date in the sentence. The charts are our own, drawn from these data rather than exported from a charting platform. The levels and ranges are my reading of the charts and of the Fed’s projections; they are orientation levels, not a model output, a confidence interval or a probability.
Sources: U.S. Treasury Daily Treasury Par Yield Curve Rates, the Fed’s H.15 data via FRED (DGS10), the FOMC statement of 16 September 2026, the Summary of Economic Projections, the minutes of the September meeting, the FOMC calendar, the BLS consumer price index, the BEA personal income and outlays release, Freddie Mac’s mortgage survey, the ECB key interest rates and the Deutsche Bundesbank 10-year yield series.
Frequently asked questions about the interest rate forecast
Will interest rates go up in 2026?
The Fed expects one more increase in 2026. The median of its projections of 16 September 2026 is 4.1% for the end of the year, which matches a range of 4.00 to 4.25%, and most participants said in the minutes that another increase would likely be appropriate by year end. The 10-year Treasury yield has already risen to 5.31% (5 October), the highest close since May 2002.
Will interest rates go down in 2027?
The Fed’s median projection for the end of 2027 is again 4.1%, so it does not point to a clear fall. That does not rule out cuts during the year, and four of the 18 participants project a lower rate than today’s midpoint. The first lower median is 3.9% for 2028. A faster fall would need inflation to come down clearly towards the 2% target, or a sharp slowdown in the economy.
What is the Fed rate forecast for December 2026?
My base case is a target range of 4.00 to 4.25% after the meeting of 9 December. That is one more quarter point, in line with the median projection and with 12 of the 18 participants. Four participants projected two more steps, which would mean 4.25 to 4.50%.
What is the 10-year Treasury yield forecast?
Until the Fed meeting on 28 October my orientation range is 4.98% to 5.44%. For the end of 2026 it is 4.75% to 5.54%, for 2027 it is 4.44% to 5.54%. These are chart levels, not probabilities. The level that decides the trend is the 2023 high at 4.98%.
What does this mean for mortgage rates?
The 30-year fixed mortgage rate tends to move with the 10-year Treasury yield rather than with the Fed rate directly, although the gap between the two changes over time. According to Freddie Mac’s weekly survey it averaged 7.28% on 1 October 2026. This page gives no forecast for mortgage rates and no advice on buying or refinancing a home.
When is the next Fed meeting?
The next Fed meeting is on 27 and 28 October 2026, with the decision on 28 October at 2:00 p.m. ET. The last meeting of the year follows on 8 and 9 December, with new projections. The ECB decides on 29 October and 17 December.
Please note
The ranges and scenarios are a personal assessment and not a certainty. This is market analysis, not investment or financial advice. Interest rates can move sharply on a single data release, so keep your position sizes in line with your own risk management.
How our forecasts are made and reviewed: How we work.