
Platinum Price Forecast: 2026, 2027 and 2030


This analysis is from 30 September 2026. Prices have moved since, so the levels below may no longer apply until the next update.
Platinum forecast in 30 seconds
Current price
$1,716 in the NYMEX platinum future (30 September 2026, 18:11 CEST), about 41% below the all-time high of $2,925. See all forecasts.
Short term
Just above the uptrend line since April 2025. The market has not decided yet; resistance at $1,919.
Key support
The 2014 high at $1,524, then the 2021 high at $1,348.
Next target
Above $2,000 the way back to the all-time high at $2,925 opens. Below it, a sideways phase.
On this page
- Platinum forecast in 30 seconds
- Platinum on the monthly chart: breakout, record high and correction
- Platinum price forecast short term: the weekly chart at the trendline
- Platinum price forecast 2027 and 2030: the yearly chart since 1992
- Why platinum first exploded and then fell so sharply
- What is platinum? Supply and demand at a glance
- Banks and industry forecasts for platinum in 2026 and 2027
- How to trade platinum
- How this platinum price forecast is made
- Conclusion on the platinum price forecast
- Frequently asked questions about the platinum price forecast
- Please note
Platinum on the monthly chart: breakout, record high and correction
 Click to enlarge
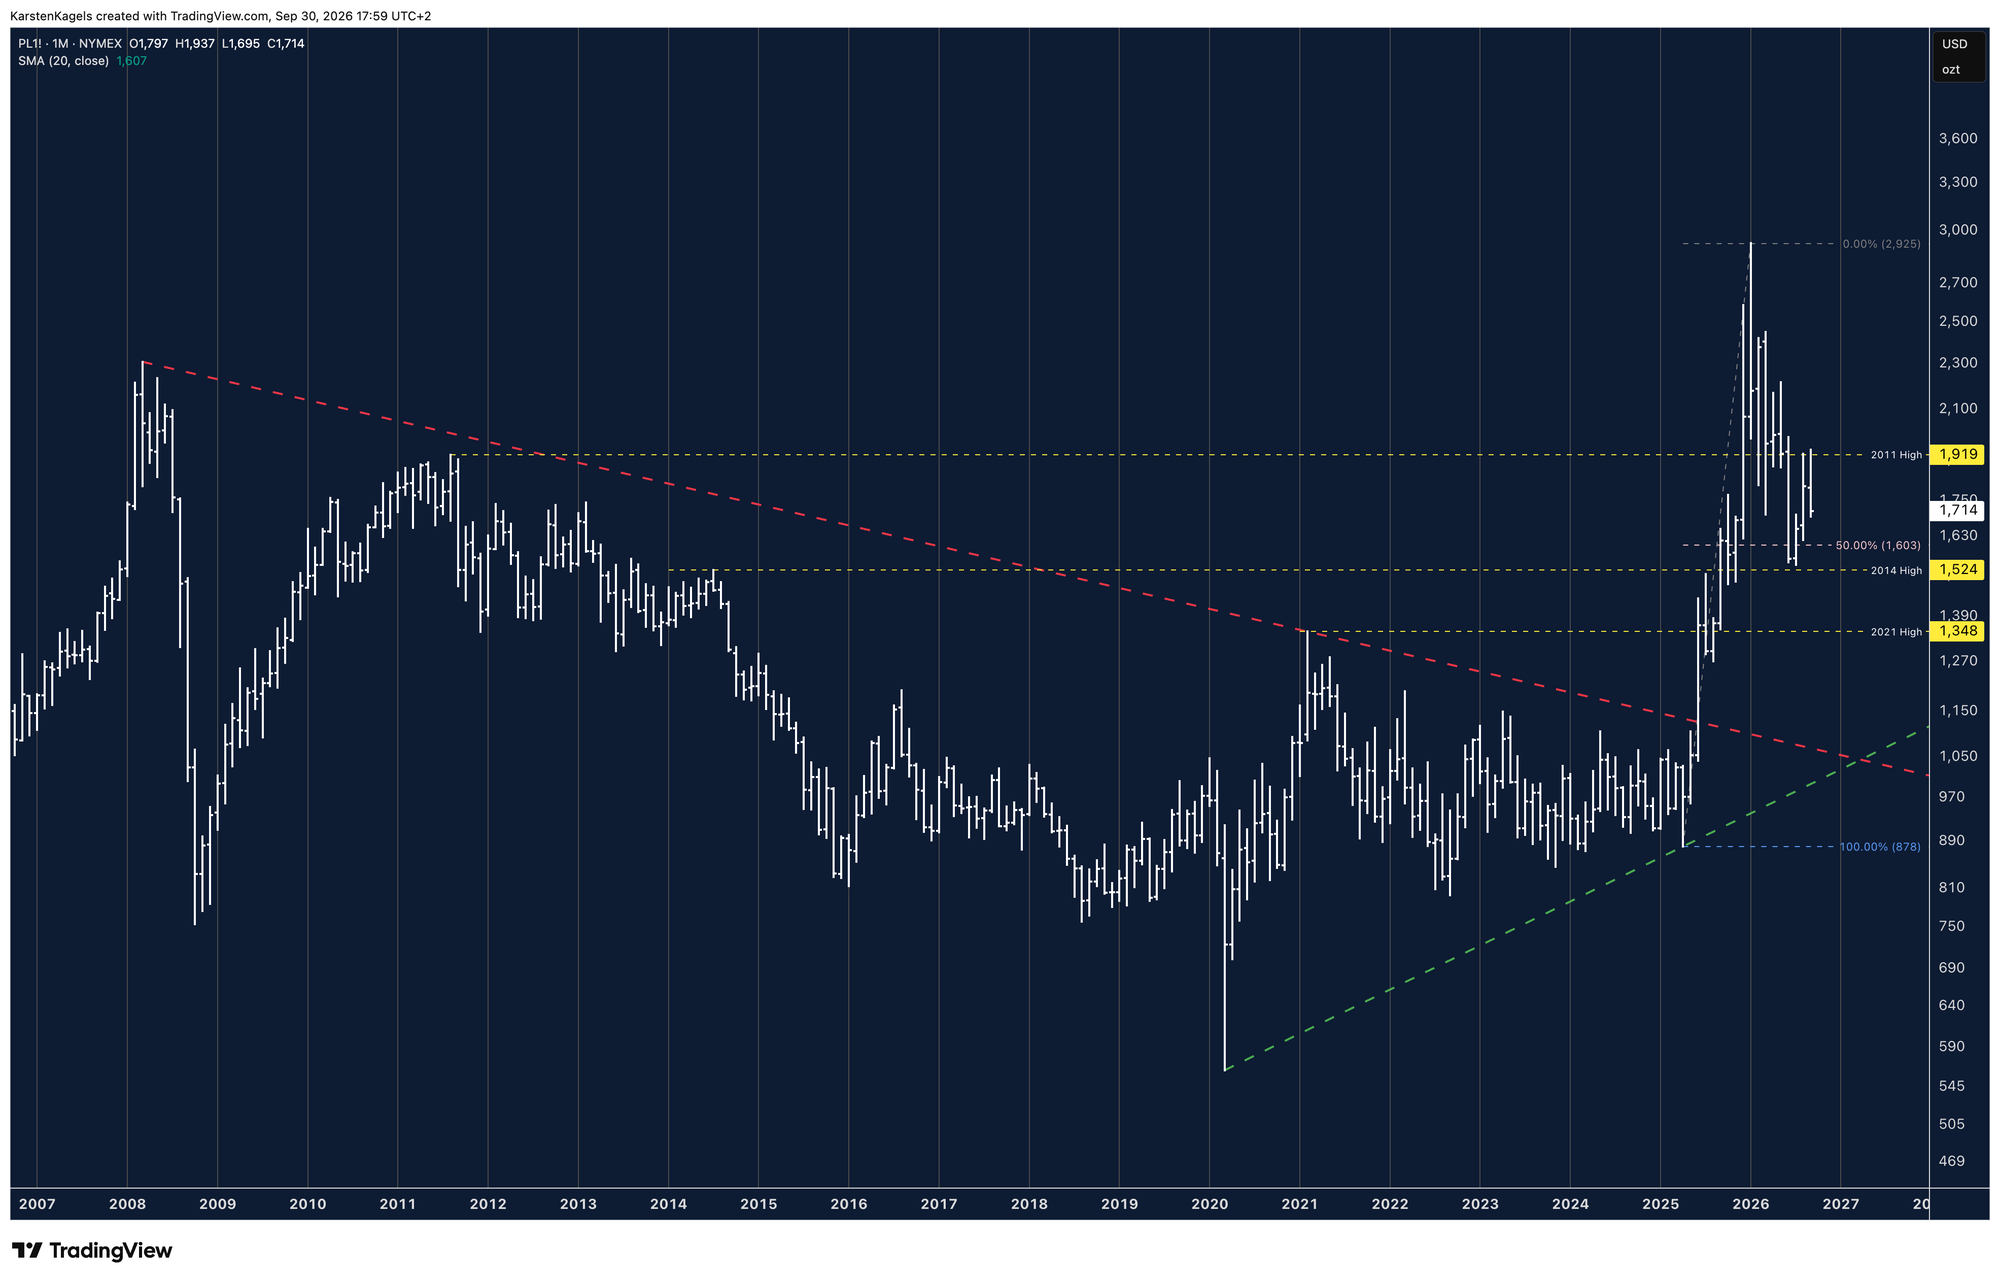
All three charts were exported on 30 September 2026 between 17:59 and 18:11 CEST. The monthly chart closed at $1,714, the weekly chart at $1,715 and the yearly chart at $1,716, which is the current level used on this page.
For context, start with the logarithmic monthly chart. From the 2008 high at $2,309, platinum fell for many years to the 2020 low at $562. After that the price moved slowly higher with gently rising lows, shown by the green line.
In June 2025 platinum broke the long-term downtrend line that had held since 2008. The breakout came with high volatility, meaning large price swings. A rally over several months followed, up to the all-time high at $2,925 in January 2026. From the April 2025 low at $878, that was a gain of about 233%.
The correction that followed ran almost down to the 2014 high at $1,524. The correction low at $1,540 sits just below the 50% retracement of the preceding impulse wave at $1,603. On the logarithmic scale, that level is halfway between $878 and $2,925: it halves the logarithmic distance, not the dollar gain.
A two-month recovery took platinum back to the 2011 high at $1,919, which now acts as resistance. In September the price briefly reached $1,937 but could not hold the level and fell back. Platinum currently trades at $1,716.
Resistance
- $2,925
- $2,309
- $1,919
Price at analysis$1,716
Support
- $1,603
- $1,524
- $1,348
Platinum price forecast short term: the weekly chart at the trendline
 Click to enlarge
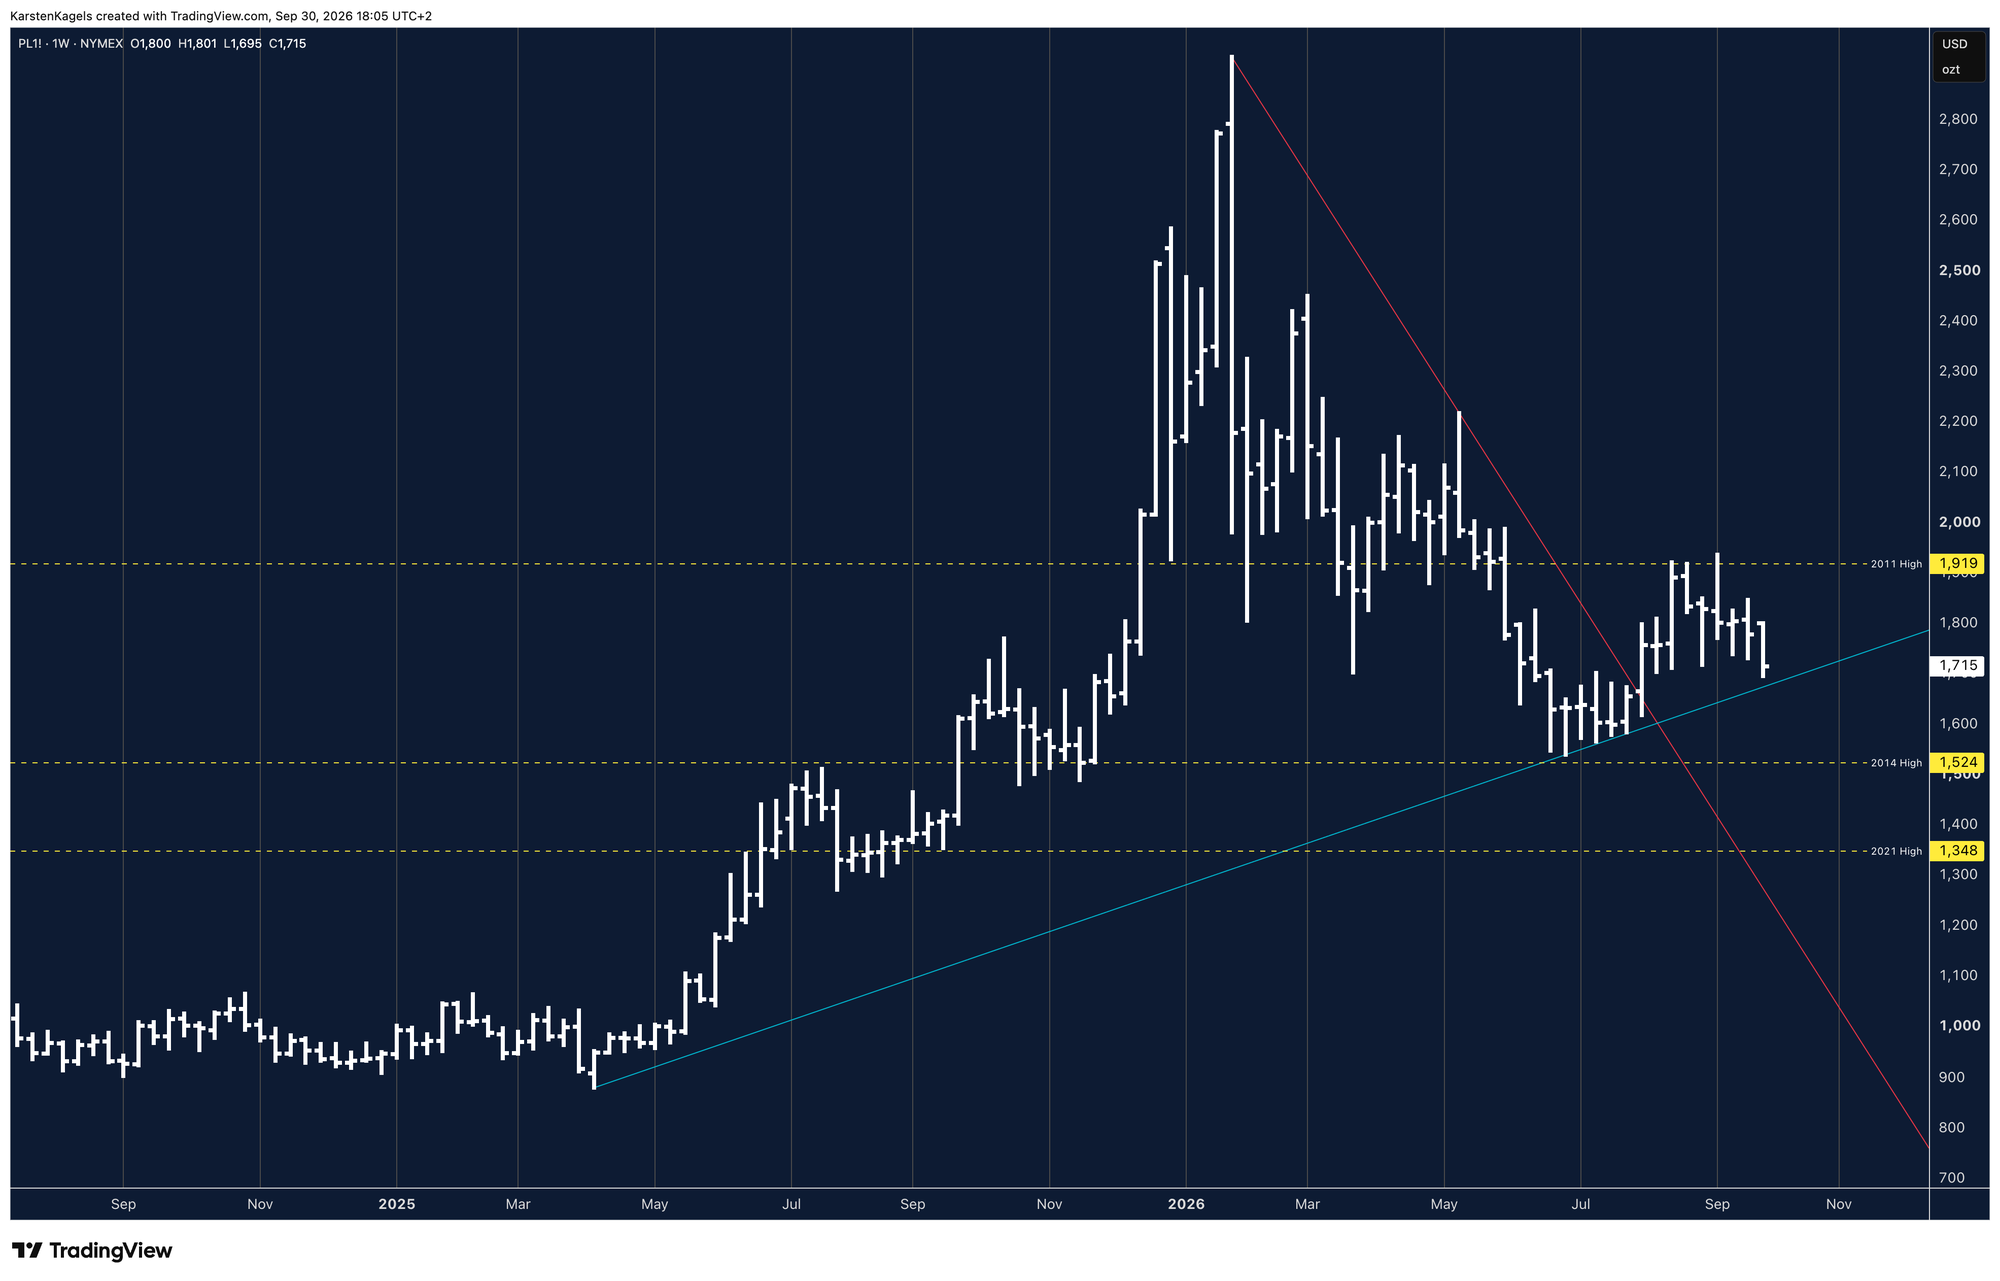
On the logarithmic weekly chart, the uptrend since April 2025 is intact. The blue uptrend line connects the $878 low with the lows of June and July 2026 and is confirmed by them. Platinum broke the short-term red downtrend line from the all-time high to the upside at the end of July.
At the 2011 high of $1,919 the recovery failed three times. In mid August, late August and early September the weekly highs reached this level, once with a brief move to $1,937. Since then the weekly highs have been lower. On the weekly chart, platinum fell from $1,800 to $1,715 this week and now sits directly above the blue line.
The market has not decided yet which way it will go. Below the price there are strong supports: the 2014 high at $1,524 and the 2021 high at $1,348. On the upside, the chart would improve markedly in the long run if platinum rises above the 2011 high and the psychologically important $2,000 level.
Bull case: the trendline holds and platinum breaks above $2,000
Platinum holds the blue uptrend line and closes a week above the 2011 high at $1,919. After that the psychologically important $2,000 level has to fall as well. If both succeed, the chart improves markedly and the all-time high at $2,925 comes back into view.
What decides it
For me, the blue trendline decides first which case plays out. As long as it holds, the uptrend since April 2025 stays intact, even if platinum stays stuck below the 2011 high at $1,919. The same picture for the other metals is in the gold price forecast and the silver price forecast.
Bear case: a break of the uptrend line
Platinum falls below the blue uptrend line that has held since April 2025. Then the logarithmic 50% retracement at $1,603 is the next reference level, and below it the 2014 high at $1,524. If that level does not hold either, the 2021 high at $1,348 is the next strong support.
Resistance
- $2,000
- $1,919
Support
- $1,524
- $1,348
Platinum price forecast 2027 and 2030: the yearly chart since 1992
 Click to enlarge
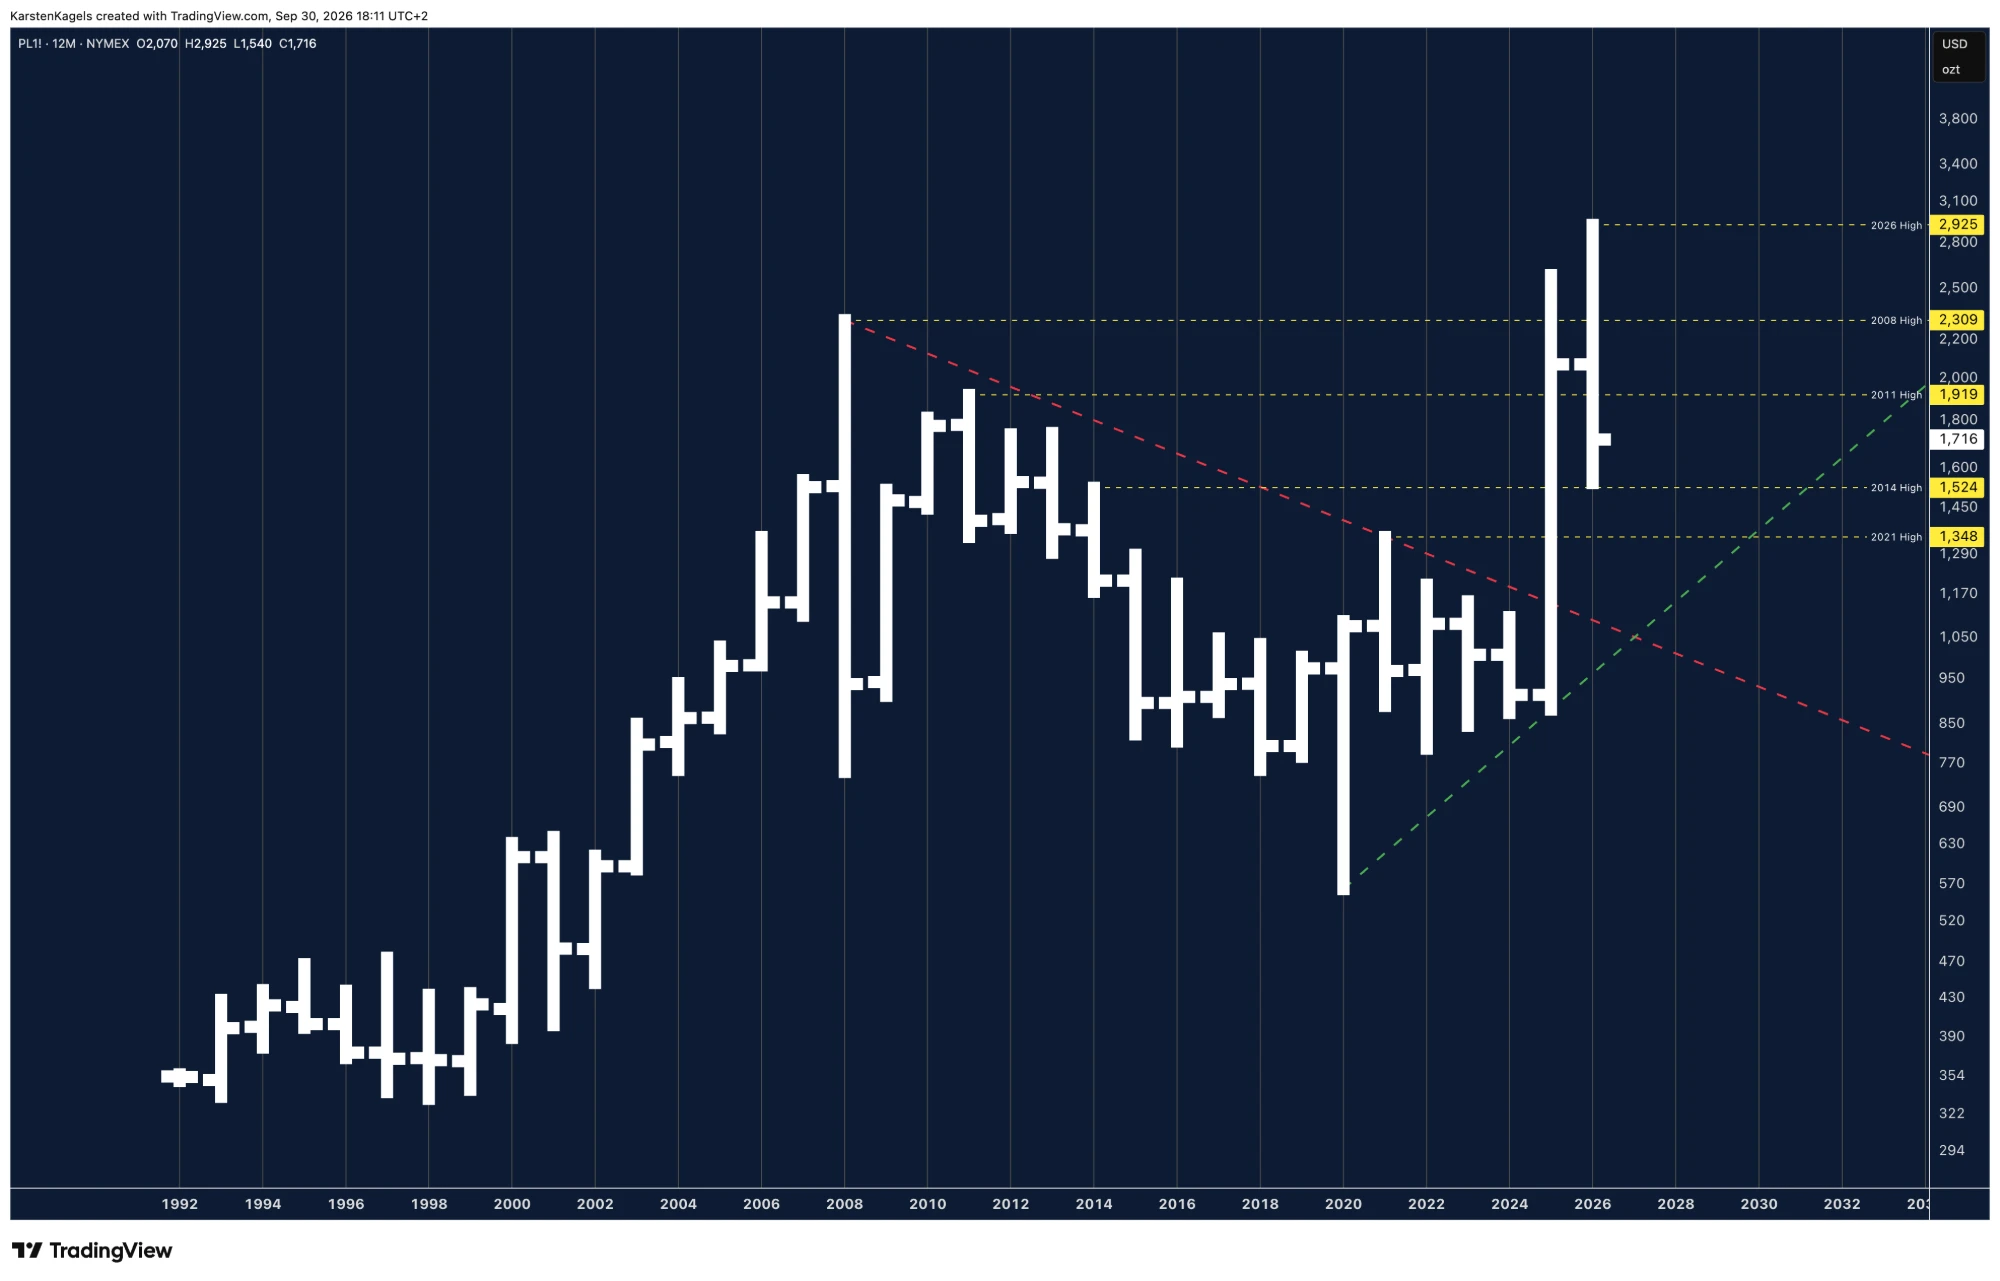
Finally, a look at the very long-term development on the logarithmic yearly chart. In the 1990s platinum mostly traded below $500. From 2000 the price rose almost without a break to the 2008 high at $2,309. After the slump in the financial crisis it recovered to the 2011 high at $1,919 and then fell in a long downtrend until 2020.
In 2025 platinum broke the red downtrend line from 2008 and cleared every high of the previous 17 years. Early in 2026 the all-time high at $2,925 followed, well above the 2008 high. So far the 2026 yearly bar shows a range from $1,540 to $2,925. At $1,716, platinum is about 17% below the level at the start of the year of $2,070.
For 2027 and 2030 the $2,000 level decides. If platinum rises above the 2011 high at $1,919 and the psychologically important $2,000 level, the way back towards the all-time high at $2,925 opens. Above that, the chart has no older level left to orient on.
If platinum stays below $2,000, I expect a sideways phase. The 2014 high at $1,524 and the 2021 high at $1,348 support the price from below. The green uptrend line from the 2020 low runs into this range from below. It rises year by year and limits a possible sideways phase to the downside.
I deliberately do not name a fixed price target for 2030. Four years are a long time in the platinum market: in 2025 and early 2026 alone the price more than tripled. From the high at $2,925 it then fell by about 47% to $1,540, and it still trades about 41% below the high. The levels on the chart show where the picture is decided, not where the price will stand in 2030.
Resistance
- $2,925
- $2,309
- $2,000
- $1,919
Support
- $1,524
- $1,348
Why platinum first exploded and then fell so sharply
Behind the rally and the slump are almost the same forces, just in reverse. The best source is the World Platinum Investment Council, or WPIC. The industry body of the large platinum producers publishes the supply and demand figures every quarter, compiled by the research firm Metals Focus.
The first push came in the second quarter of 2025, from the record discount to gold. According to a WPIC analysis from February 2026, Chinese jewellery wholesalers switched from gold to platinum at the time. At the same time, many industrial users moved from leasing platinum to owning it.
The second push came in late summer 2025 from the United States. The government announced tariffs on copper and launched a Section 232 investigation into critical minerals, a review of possible import tariffs on national security grounds. Traders then moved platinum into the warehouses of the US futures exchange, and metal became scarce in Europe. From December 2025 the general precious metals euphoria carried the price to the all-time high in January 2026.
The WPIC explains the slump mainly with interest rates. The conflict between the US and Iran and the restrictions on shipping through the Strait of Hormuz pushed energy prices higher. That raised inflation expectations and expected policy rates. This weighs on precious metals, because they pay no interest.
Investors sold more than 500,000 ounces from platinum ETFs in the first half of 2026. That was about one seventh of the holdings at the end of 2025. After the Section 232 investigation was finalised, exchange stocks also flowed back into the market. Platinum lease rates fell from over 10% to around 2%, which shows that the earlier squeeze has eased. The WPIC still describes the physical market as tight after the deficit years.
Weakness in China added to it. Chinese demand for platinum jewellery fell 65% year on year in the first half of 2026, and demand for bars and coins fell 36%. In the WPIC's view, China's muted economy hurt platinum more than the Iran war.
After three deficit years, the WPIC expects a small surplus of 265,000 ounces for 2026. In May it still expected a deficit of 297,000 ounces. The change comes almost entirely from investment demand, which it cut by 601,000 ounces. For the second half of 2026 it expects a deficit of 283,000 ounces again, because ETF buying is expected to return.
For the years to 2030, the WPIC sticks with its picture of a tight market. In its outlook from June 2026 it expected a deficit in every year from 2027 to 2030, the largest in 2030 at 494,000 ounces. That outlook predates the cut in investment demand, though. The WPIC plans to publish new figures for 2027 in November.
For traders this means: over the next quarters, interest rates and the dollar move the platinum price more than the mines. The WPIC sees it the same way and describes platinum as a high-beta proxy for gold, one that swings more than gold itself. The dollar side is covered in the EUR/USD forecast.
What is platinum? Supply and demand at a glance
Platinum is a rare, silvery-white precious metal that is mined mainly for car catalysts, jewellery and industry. It trades on the commodity exchanges in US dollars per troy ounce.
South Africa supplied about 71% of global refined platinum mine production in 2025. Of the 5.56 million ounces of refined mine supply, the WPIC attributes 3.96 million ounces to South Africa. Russia supplied 12%, Zimbabwe 9% and North America 4%. Strikes, power cuts or sanctions in these countries therefore hit the price directly. Another 1.67 million ounces came from recycling, mostly from old catalysts.
| Demand (m oz) | 2025 | Share | 2026f |
|---|---|---|---|
| Automotive | 3.04 | 35% | 2.90 |
| Industrial | 2.27 | 26% | 2.39 |
| Jewellery | 2.21 | 26% | 1.88 |
| Investment | 1.15 | 13% | −0.08 |
| Total | 8.67 | 100% | 7.09 |
Source: WPIC Platinum Quarterly Q2 2026 of 9 September 2026, shares calculated by us. The market balance swung from a deficit of 1.44 million ounces in 2025 to the forecast surplus of 265,000 ounces in 2026.
The largest buyer is the car industry, closely followed by industry and jewellery. Platinum goes into catalytic converters for diesel, gasoline and hybrid cars. Industrial uses include glass, chemicals, oil refining and medical technology. For jewellery, China is the market that matters. The table also shows how much investment demand can swing: from 1.15 million ounces of buying in 2025 to an outflow in 2026.
Platinum is now clearly more expensive than palladium. On 29 September 2026 an ounce of platinum cost $1,692 according to Fortune, palladium $1,220 and gold $4,158. For years platinum was the cheap alternative that carmakers used to replace expensive palladium. That argument has now reversed, which is the central point of our palladium price forecast. For another industrial metal, see the copper price forecast.
Banks and industry forecasts for platinum in 2026 and 2027
Banks cut their platinum forecasts in the summer of 2026. UBS lowered its forecasts by $300 an ounce at the end of June and pointed to weak investment demand. J.P. Morgan sees platinum at around $1,950 at the end of 2027, citing tight supply from South Africa.
| Source | Forecast | Date |
|---|---|---|
| UBS | $1,700 in December 2026, $1,800 in June 2027 | June 2026 |
| J.P. Morgan | about $1,800 end of 2026, about $1,950 end of 2027 | July 2026 |
| Heraeus | $1,300 to $1,800 for 2026 | Dec. 2025 |
| LBMA survey | 2026 average: $2,222 | Jan. 2026 |
Bank forecasts refer to the spot price and are often revised several times a year. The two older figures from Heraeus and from the LBMA, the association of the London precious metals market, date from before the all-time high. The forecasts cited here contain no price target for 2030. I use the forecasts as a picture of sentiment; my levels come from the chart.
How to trade platinum
Platinum can be bought physically, held through exchange-traded products or traded as a future. Which route fits depends on whether you want to invest long term or trade shorter price moves. Physically backed products let you follow the price without storing bars yourself. Mining stocks are a further route with extra company risk, as our guide to silver mining stocks shows for silver.
For active traders, the NYMEX platinum future is the direct route. The standard contract (PL) covers 50 troy ounces, and each tick of 10 cents moves it by $5. The micro contract (PLM) covers 10 ounces. The details are in the CME contract specifications.
Futures work with leverage and need solid risk management. Platinum swings more than gold: from the January high to the July low in 2026 the price fell by about 47%. Set a stop before every trade and risk only a small part of your account.
How this platinum price forecast is made
I read the platinum market on three time frames: yearly, monthly and weekly chart. The yearly and monthly charts give the big picture and the levels for 2027 and 2030. The weekly chart shows where the market stands now and is reassessed every week.
All levels come from my charts of the platinum future on NYMEX. A future is an exchange-traded forward contract; the chart always shows the front contract (PL1! on TradingView). The levels are mainly old yearly highs, trendlines and round numbers such as $2,000. The spot price shown on many quote pages can differ by a few dollars.
All three charts use a logarithmic scale. On it, a rise of 10% always looks the same size, whether it starts at $500 or at $2,000. That is why I also calculate the Fibonacci retracement on this scale; its 50% level is at $1,603. On a linear scale it would be at about $1,902, which is worth knowing when you compare other analyses. This page follows our editorial policy.
Conclusion on the platinum price forecast
The big breakout of 2025 has not been reversed. Platinum broke the downtrend line from 2008, set an all-time high at $2,925 and then corrected to just below the 50% level. The blue uptrend line since April 2025 is holding so far.
In the short term the price is stuck between two clear levels. On the upside the recovery failed three times at the 2011 high of $1,919. On the downside lie the blue trendline and below it the 2014 and 2021 highs at $1,524 and $1,348. Only a move above $2,000 would improve the chart markedly; below it I expect a sideways phase.
Fundamentally the market is no longer as tight as in 2025, but it is not relaxed either. The WPIC expects a small surplus for 2026 because investors sold. In its June 2026 outlook it still saw deficits for the years after. Interest rates and the dollar will set the pace over the coming months. I update this forecast every week with a new weekly chart.
Frequently asked questions about the platinum price forecast
What is the current platinum price forecast?
On 30 September 2026 at 18:11 CEST platinum trades at $1,716, directly above the uptrend line since April 2025. The 2011 high at $1,919 is the resistance above, the 2014 and 2021 highs at $1,524 and $1,348 support below. Only above $2,000 does the chart improve markedly.
Will platinum go up again?
The market has not decided yet. The long-term uptrend is intact as long as the blue trendline holds. For a new rise, platinum has to clear the 2011 high at $1,919 and the $2,000 level. Then the all-time high at $2,925 comes back into view.
Why did platinum get so cheap?
After the all-time high in January 2026, the Iran conflict pushed energy prices and with them expected interest rates higher. Investors sold more than 500,000 ounces from platinum ETFs in the first half of the year, and Chinese jewellery demand fell 65%. According to the WPIC, the market therefore swings to a small surplus in 2026.
How high could platinum go?
The all-time high is $2,925 from January 2026. Above it, the chart has no older level left. I do not name a fixed target, but the way there leads first through the 2011 high at $1,919 and the $2,000 level.
What is the platinum price forecast for 2030?
For 2030 the $2,000 level decides. Above it the way towards the all-time high opens; below it I expect a sideways phase, supported by the 2014 and 2021 highs. According to its June 2026 outlook, the WPIC expects a market deficit in every year from 2027 to 2030.
What was the highest price for platinum?
The all-time high in the platinum future is $2,925 from January 2026. It clearly exceeded the old record from 2008 at $2,309. The lowest point of the last 20 years was $562 in March 2020.
Is it worth investing in platinum?
That depends on your time horizon. Platinum is more volatile than gold and fell by about 47% from its January high to the July low in 2026. In its June 2026 outlook the WPIC expected deficits again after 2026. If you invest, keep the position small and use supports such as $1,524 as orientation.
Please note
The scenarios are a personal assessment based on experience and are not a certainty. This is market analysis, not investment advice. Keep your position sizes in line with your own risk management.
This forecast is translated from the German edition on kagels-trading.de.
How our forecasts are made and reviewed: How we work.