
Bitcoin Forecast: BTC/USD Levels, Scenarios and Targets
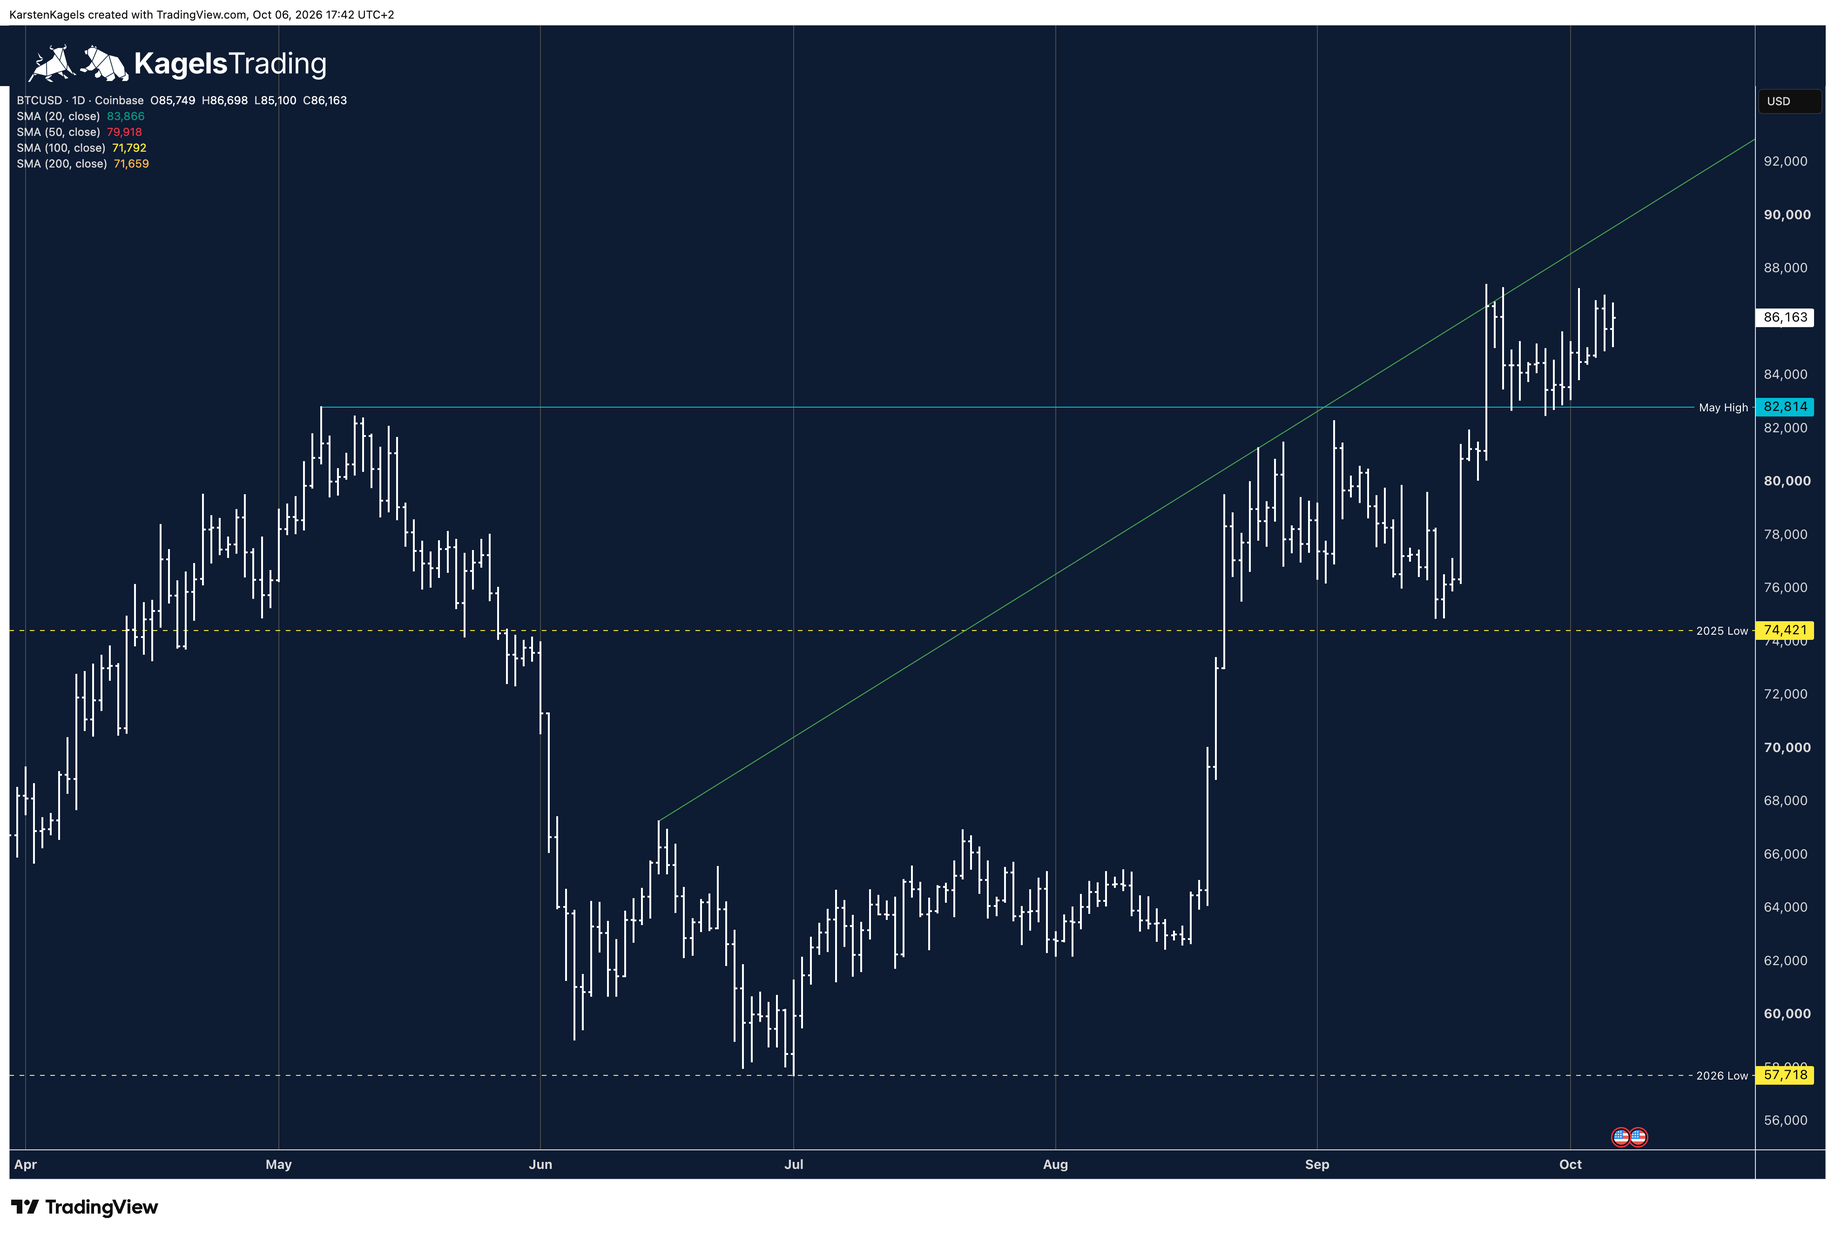
Bitcoin broke above the May high at $82,814 on 21 September and has been moving around that level since 26 September, with every daily close above it so far. If it holds, this year's high from January near $98,000 is the next target; if it gives way, the 2025 low at $74,421 is next. US inflation data follows on 14 October, the Fed decides on 28 October.
Bitcoin forecast in 30 seconds
The situation
Uptrend on the daily and weekly charts. Since the low of the year at $57,718 on 1 July, bitcoin has gained about half, and all moving averages are rising; since 26 September the price has been consolidating at the May high.
The level that has to hold
The May high at $82,814. A daily close below it opens the way to the 2025 low at $74,421.
Next target to the upside
A daily close above the 21 September high at $87,397, then the high of the year at $97,964 from 14 January.
What comes next
Fed minutes on 7 October, US consumer prices on 14 October, the Fed rate decision on 28 October. Next review when a level breaks.
On this page
- Bitcoin forecast in 30 seconds
- Bitcoin today: consolidation at the May high
- The three paths and when they fail
- The weekly picture: the trend points to about $98,000
- What could move bitcoin next
- The longer view: only below $70,000 does it turn negative
- Bitcoin forecast 2026 to 2030: what analysts expect
- Conclusion: uptrend with the high of the year as target
- How this forecast is made
- Frequently asked questions about the bitcoin forecast
- Please note
Bitcoin today: consolidation at the May high
For Tuesday, 6 October 2026
 Click to enlarge
The daily chart shows the uptrend since the summer. From the low of the year at $57,718 on 1 July, bitcoin climbed above $80,000 in one move in August. On 21 September it broke above the May high at $82,814, with a daily high of $87,397.
Since 26 September the market has been consolidating. The daily candles move between about $82,500 and $87,250. Some daily lows dipped below the May high, but every daily close stayed above it. In our assessment the market is testing whether the old hurdle now works as support.
Karsten expects prices to keep rising overall. The target is the high of the year at $97,964 from 14 January, about 14 percent above the price of $86,010. What matters is that the daily closes stay above the May high.
The moving averages support the uptrend. All four are clearly rising, and the price trades above each of them. According to the legend at the top left of the daily chart, the 20-day line is at $83,866, the 50-day line at $79,918, the 100-day line at $71,792 and the 200-day line at $71,659; the lines themselves are not drawn in the chart.
Resistance
- $97,964
- $87,397
Price at analysis$86,010
Support
- $82,814
- $74,421
- $57,718
The three paths and when they fail
For Tuesday, 6 October 2026
The three paths translate Karsten's chart picture into levels. His view is an established uptrend, a target at the high of the year, and a negative picture only below $70,000. We set the scenario thresholds and the rule below as editors. They are orientation levels, not order rules, and the two directional paths also name what takes them off the table.
For the cards, the daily close in the Coinbase daily chart shown above counts. The daily candle closes at 00:00 UTC, which is 2:00 am CEST and from 25 October 1:00 am CET. A daily close beyond the level speaks for the scenario, and a following daily close back on the other side takes it off the table. Such a signal does not guarantee a continuation or that the target is reached; intraday spikes without a close do not count.
Bullish: above the 21 September high
Condition: a daily close above $87,397. That is the 21 September high, just above the top of the consolidation at $87,249, and it would be a breakout signal; the high of the year at $97,964 is then the target. The path is off the table on a following daily close back below $87,397.
Bearish: back below the May high
Condition: a daily close below $82,814. That would call the 21 September breakout into question, and the 2025 low at $74,421 comes into focus. In Karsten's reading the chart picture only turns negative below $70,000, though. The path is off the table on a following daily close back above $82,814.
Wait: inside the consolidation
Condition: as long as the daily closes stay between $82,814 and $87,397, there is no new signal. That is the state on 6 October, and the underlying trend still points up. Waiting ends with the first daily close outside this range.
The weekly picture: the trend points to about $98,000
Week of 5 October 2026
 Click to enlarge
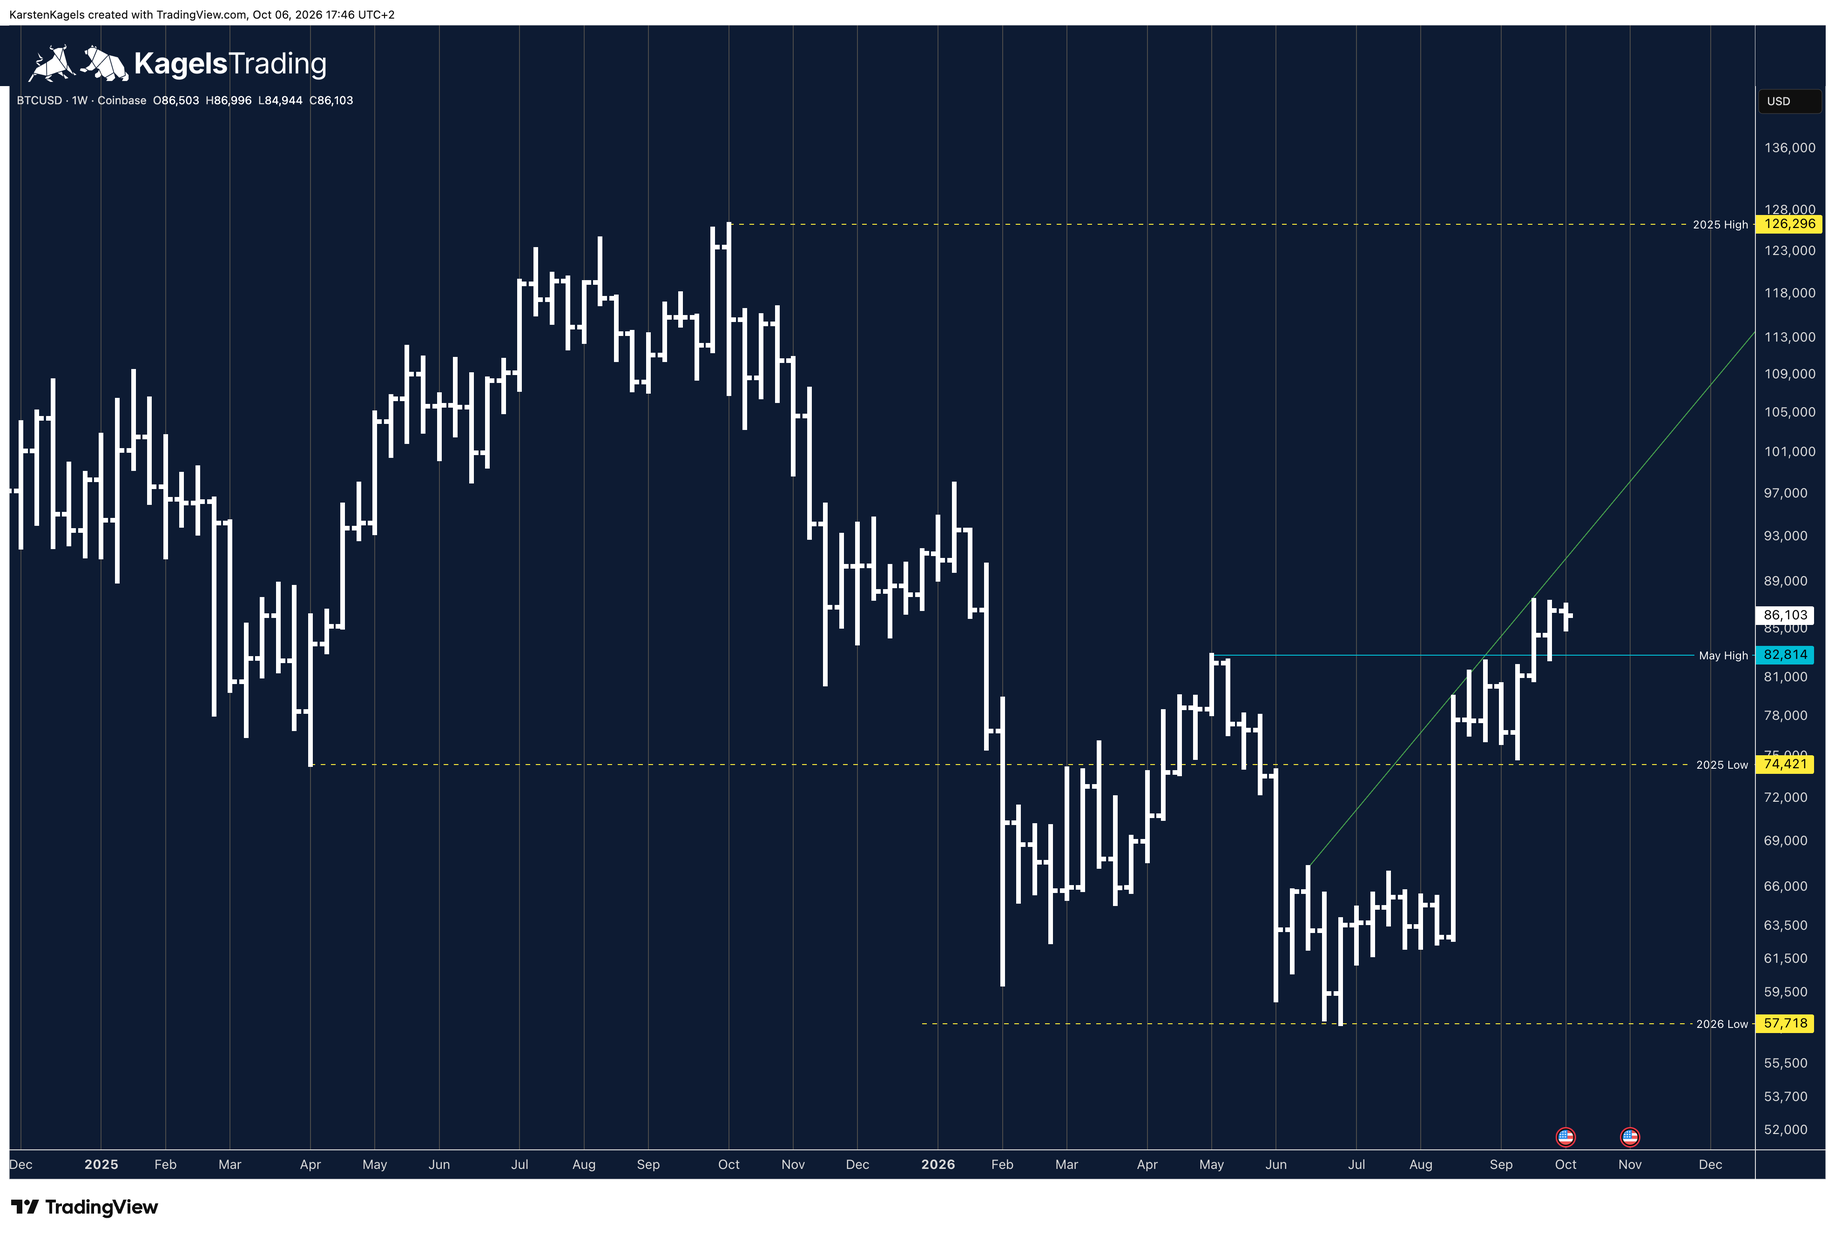
The uptrend is established on the weekly chart above as well. After the 2025 high at $126,296 in October, bitcoin fell to the low of the year at $57,718 in July 2026. Since then the weekly bars have been rising again, and at the end of September the price cleared the May high at $82,814 on a weekly basis.
The trend could continue towards $98,000. That is where the high of the year from January at $97,964 sits, the level where the weekly bars turned at the start of the year. The price is still about 32 percent below the 2025 high.
Resistance
- $126,296
- $97,964
Support
- $82,814
- $74,421
What could move bitcoin next
For Tuesday, 6 October 2026
These events are coming up next. Bitcoin now reacts strongly to US interest rates and to flows into bitcoin ETFs. The dates are occasions to read the chart again, not a forecast of a particular reaction.
Wednesday, 7 October, 2:00 pm New York time (20:00 CEST): the minutes of the Fed meeting of 15 and 16 September (Federal Reserve calendar for October).
Wednesday, 14 October, 8:30 am New York time (14:30 CEST): US consumer prices for September (BLS release schedule).
Wednesday, 28 October, 2:00 pm New York time (19:00 CET): the Fed rate decision after the meeting of 27 and 28 October (FOMC meeting calendar). Europe has switched to winter time by then and the US has not, so it is one hour earlier than usual in Europe.
The longer view: only below $70,000 does it turn negative
For Tuesday, 6 October 2026
 Click to enlarge
This part is written for readers who look beyond the next few weeks. It is reviewed at the start of the month, not daily.
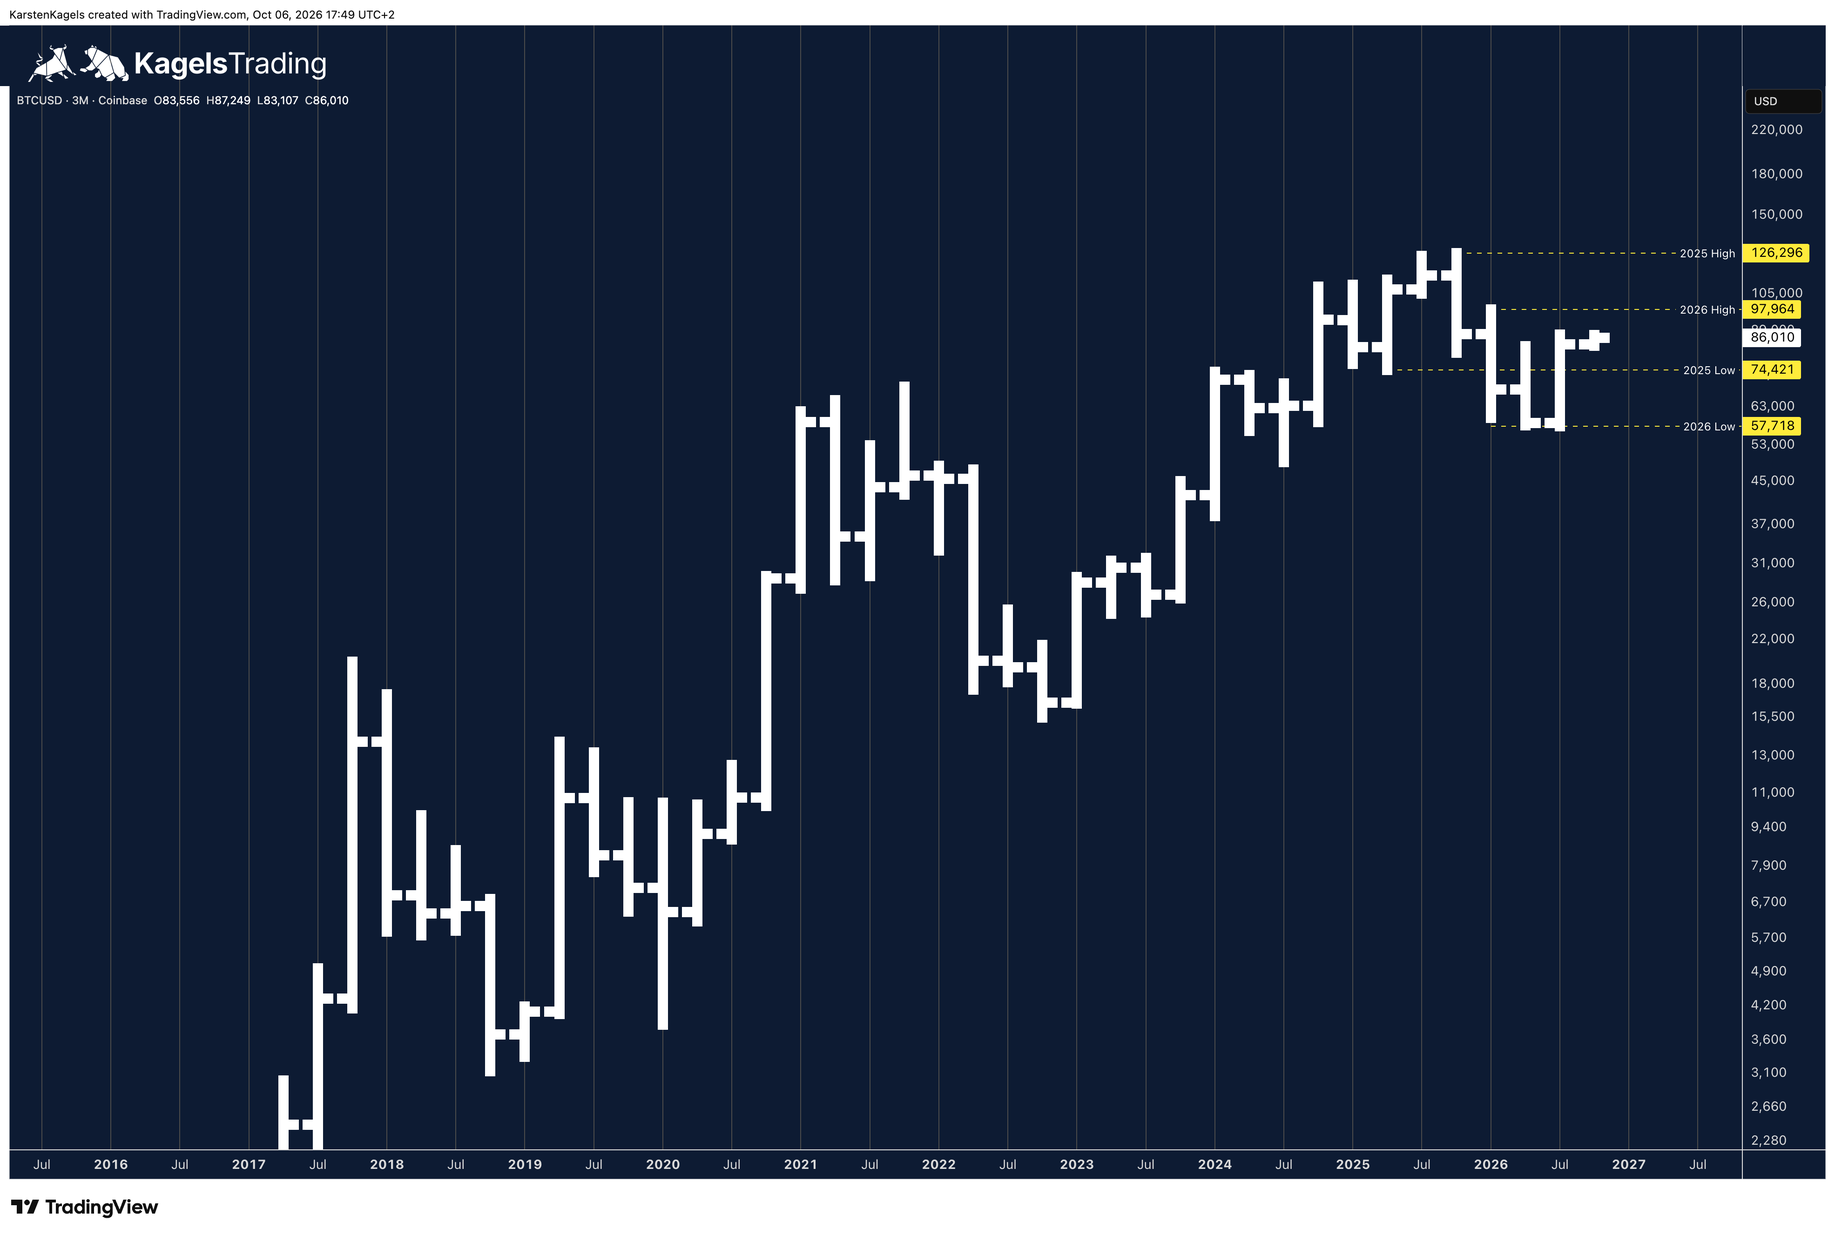
The quarterly chart shows the longer-term picture: an established uptrend. The correction from the 2025 high at $126,296 ran into the third quarter of 2026, down to the low of the year at $57,718. In the current fourth quarter bitcoin trades at $86,010, between the 2025 low and the 2026 high.
Only a price below $70,000 would turn the chart picture negative. Until then the underlying trend points up, even if the 2025 low at $74,421 were tested once more.
Bitcoin forecast 2026 to 2030: what analysts expect
For Tuesday, 6 October 2026
 Click to enlarge
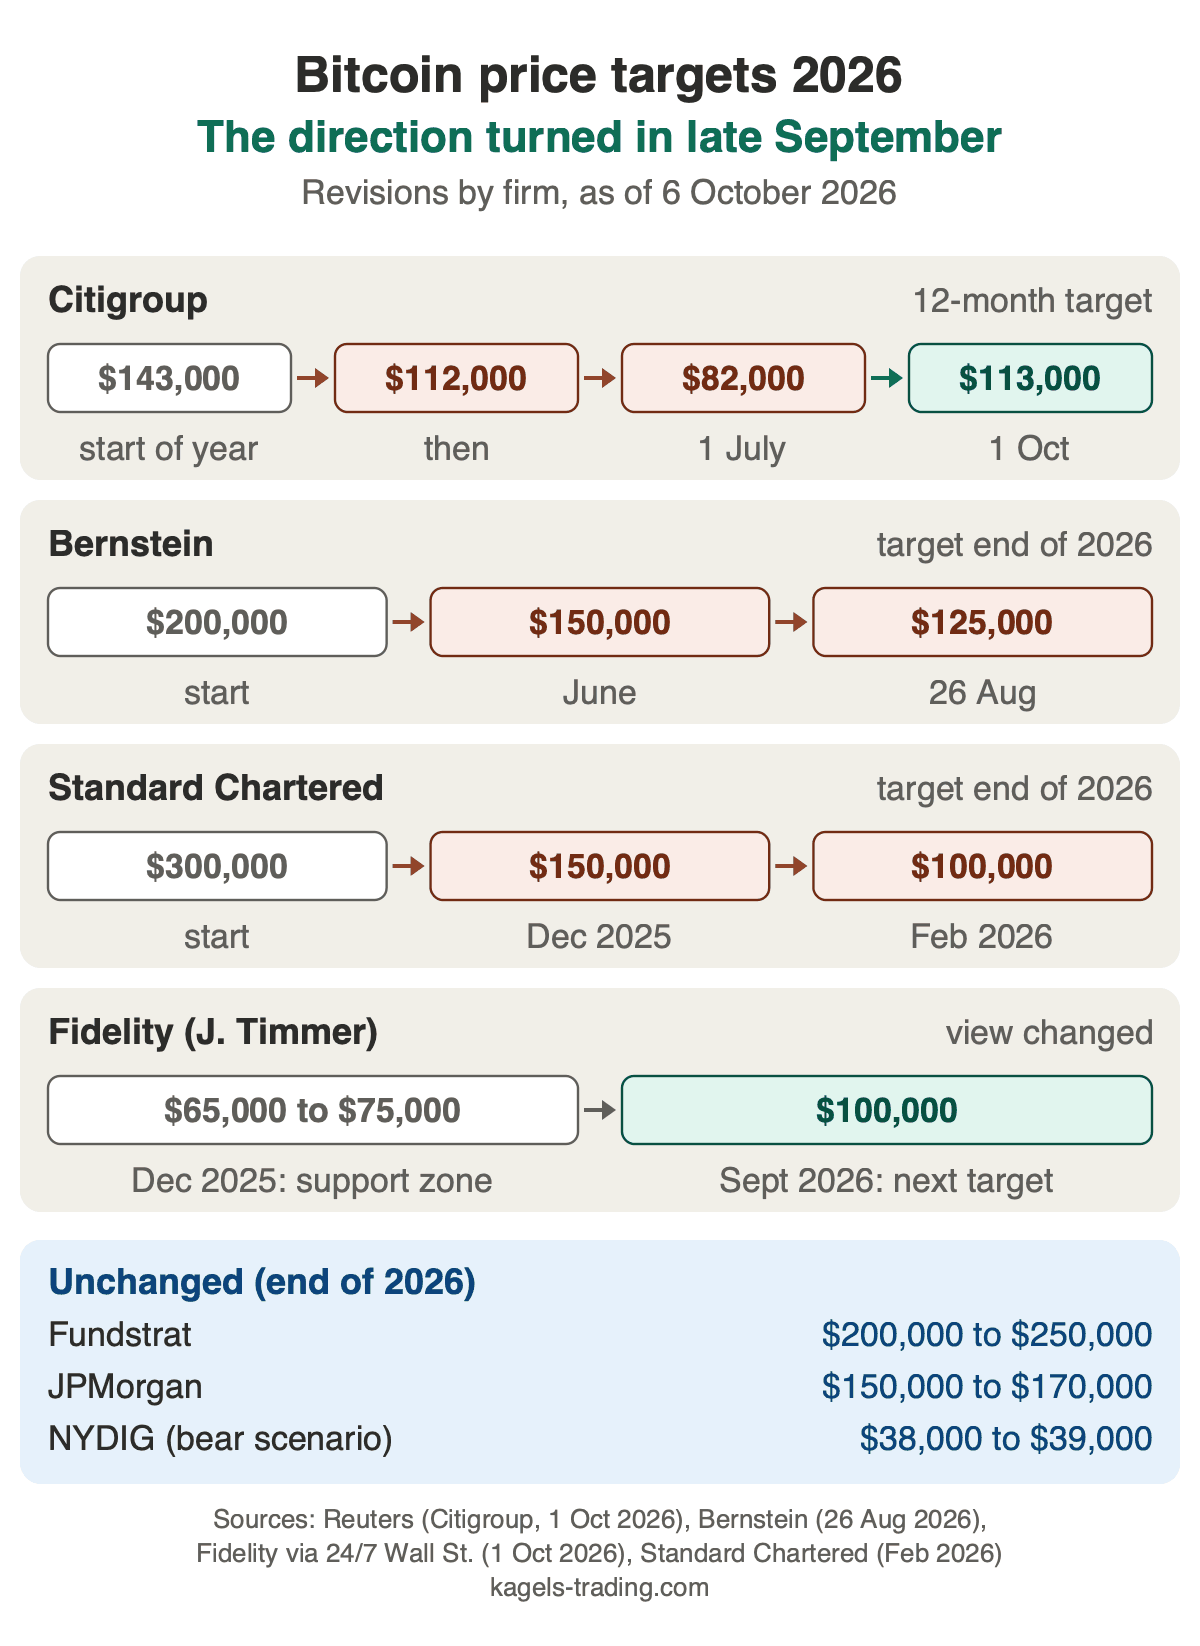
Bank price targets answer a different question from the chart. Most of them apply to the end of 2026, Citigroup's to the next twelve months and Fidelity's as a next target, and they rest on valuation models, not on levels in the price chart.
For the end of 2026 the range is wide. Fundstrat (Tom Lee) expects $200,000 to $250,000, JPMorgan $150,000 to $170,000, Bernstein $125,000 and Standard Chartered $100,000. Citigroup's 12-month target is $113,000. NYDIG names $38,000 to $39,000, but as a bear scenario, not as its base case.
Until the end of September the revisions of these firms went down. Citigroup and Bernstein cut twice each in 2026, Standard Chartered once, after a first cut in December 2025. Then the direction turned: Fidelity strategist Jurrien Timmer named $100,000 as the next target at the end of September, and on 1 October Citigroup raised its target from $82,000 to $113,000, citing returning ETF inflows. The graphic below shows the revisions by firm.
Sources for the latest changes: the Citigroup increase as reported by Reuters, the Bernstein cut on Cointelegraph and Jurrien Timmer's new view on 24/7 Wall St.
For 2030 and beyond, the estimates vary widely. ARK Invest names $1.2 million for 2030 in its bull case (Cathie Wood, November 2025) and about $710,000 in its base case, Coinbase chief executive Brian Armstrong $300,000 to $400,000, VanEck $2.9 million for 2050. These targets come mostly from market participants with their own position in bitcoin and assume that bitcoin takes over a large part of the world's store of value.
Conclusion: uptrend with the high of the year as target
Bitcoin is in an established uptrend, on the daily as well as the weekly chart. Since 26 September the price has been consolidating just above the broken May high at $82,814, supported by four rising moving averages. Karsten expects prices to keep rising overall, with the high of the year at $97,964 as the target.
For our scenarios the daily close counts. Above $87,397 that would be a breakout signal; below $82,814 the breakout would be in question and the 2025 low at $74,421 the next target. The chart picture only turns negative below $70,000.
How this forecast is made
This page is built for traders. It names where the price stands, the next level that matters and the possible paths, each with its condition. It is updated regularly and says openly when there is no clear picture. The page follows our editorial policy.
The charts are Karsten’s own, drawn on the BTCUSD series from Coinbase on TradingView. The labelled levels come from these charts; supplementary values such as the 21 September high at $87,397 are measured on the same series. All prices are chart readings, not a broker’s settlement prices, and each caption carries its own time and price. The charts of this update were exported on 6 October 2026 between 17:42 and 17:49 CEST; the price at the top of the page is the quarterly-chart quote of $86,010 at 17:49 CEST.
Frequently asked questions about the bitcoin forecast
How will bitcoin move tomorrow and next week?
The May high at $82,814 is the key level. As of 6 October 2026, bitcoin is consolidating just above it. A daily close above $87,397 opens the way to the high of the year at $97,964, a daily close below $82,814 to the 2025 low at $74,421.
How high can bitcoin go?
The next price target is the high of the year from 14 January 2026 at $97,964. Above it, the big level is the 2025 high at $126,296 (as of 6 October 2026). A target is only reached if the trend holds; it is not promised.
How far can bitcoin fall?
The next supports are the May high at $82,814 and the 2025 low at $74,421. Below that sits the low of 2026 at $57,718 from 1 July (as of 6 October 2026). The chart picture only turns negative below $70,000; under our scenario rule the daily close counts, and a further decline remains possible.
What will one bitcoin be worth in 2030?
Nobody knows, and the published estimates are extremely far apart. ARK Invest names $1.2 million for 2030 in its bull case and about $710,000 in its base case, Coinbase chief executive Brian Armstrong $300,000 to $400,000. Such targets rest on assumptions about future adoption, not on the chart.
Can bitcoin become worthless?
A total loss is possible and should be part of how you size a position. Bitcoin generates no earnings like a company and has no issuer that stands behind it; the price comes from supply and demand alone. Possible triggers would be a far-reaching ban in the large economies or a fundamental flaw in the cryptography.
Please note
The scenarios are a personal assessment based on experience, not a certainty. This is market analysis, not investment advice. Bitcoin is a market with high price swings in which losses up to a total loss are possible: keep your position sizes in line with your own risk management. If you buy bitcoin in Europe, our comparison of crypto exchanges in Europe shows what a purchase costs at five licensed exchanges.
This forecast is translated from the German edition on kagels-trading.de.
How our forecasts are made and reviewed: How we work.