
AUD/USD Forecast: Levels for the Aussie Dollar


This analysis is from 21 September 2026. Prices have moved since, so the levels below may no longer apply until the next update.
AUD/USD forecast in 30 seconds
Where it stands
0.7122 on 21 September 2026, above the 100-day line, the 200-day line and the 50-week average.
Trend
Uptrend intact, about 200 pips above the 50-week average at 0.6926.
Key support
The 100-day line at 0.7076, then the 50-week average at 0.6926.
Upside targets
The yearly high at 0.7278, then the 2022 high at 0.7661.
On this page
- AUD/USD forecast in 30 seconds
- AUD/USD forecast, short term
- AUD/USD forecast, medium term
- AUD/USD forecast, long term
- The yearly chart and the view toward 2030
- What is the AUD/USD currency pair?
- What moves the AUD/USD rate
- What happened in September 2026
- Technical ratings
- Conclusion: trend intact, resistance at the yearly high
- Frequently asked questions about the AUD/USD forecast
AUD/USD forecast, short term
 Click to enlarge
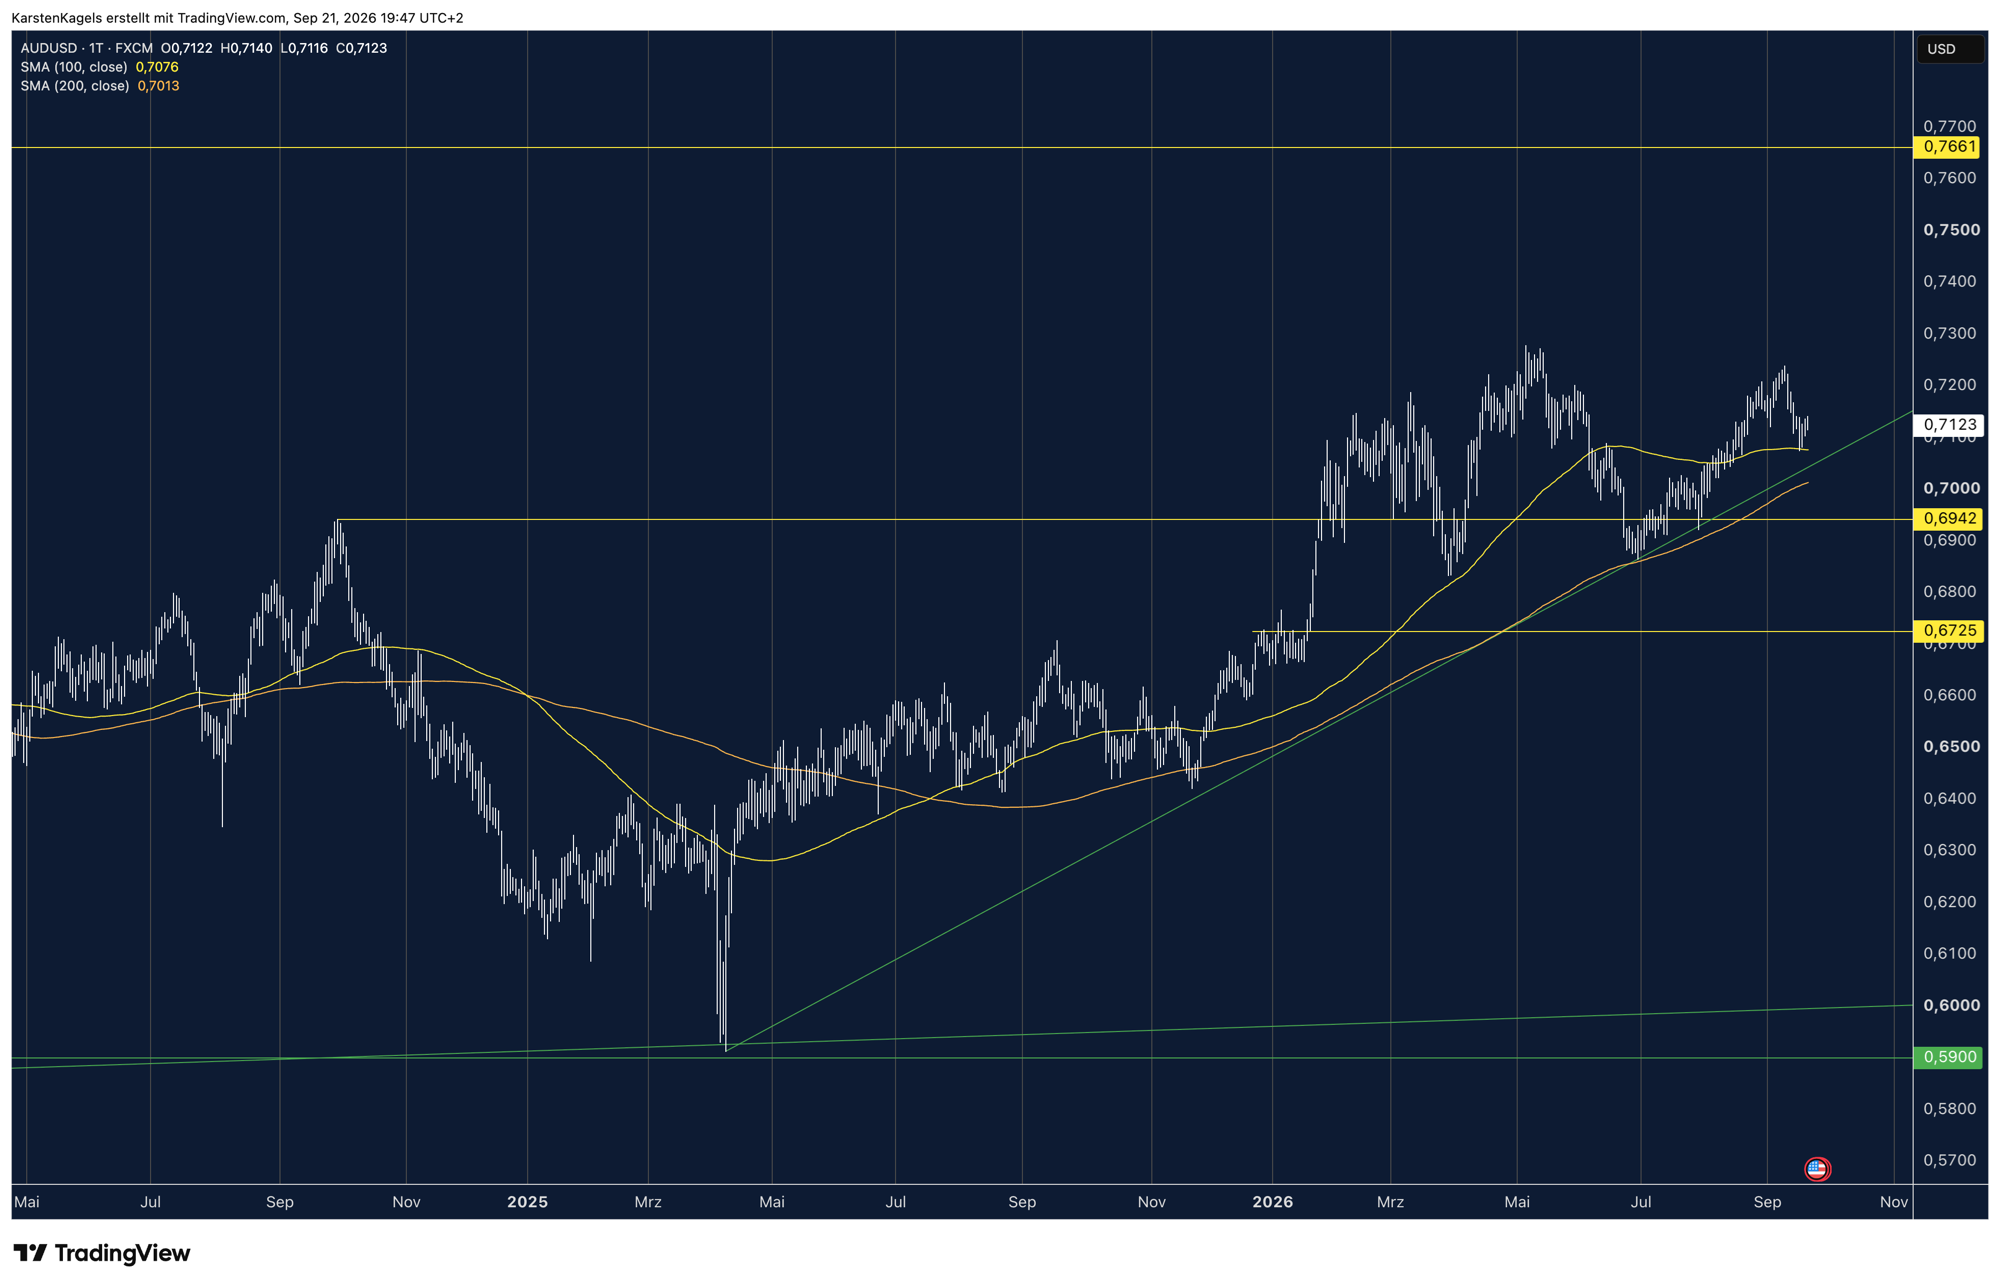
Looking back: from the low for the year at 0.6663 the pair ran up to 0.7278 by May. A consolidation of several months followed, with a setback below 0.70. The next rise started in August and reached 0.7238 in September.
Outlook: the pair left the 200 day line at 0.7013 behind long ago and recently tested the 100 day line at 0.7076. Both lines sit below the price, and the 200 day line is still rising. A green uptrend line that starts at the 2025 low also holds below the price.
Target: on the upside the yearly high at 0.7278 stays the first target, with the 2022 high at 0.7661 behind it. On the downside the two averages between 0.7013 and 0.7076 give the first support. Only below that area does the picture turn fragile.
Resistance
- 0.7661
- 0.7278
Price at analysis0.7122
Support
- 0.7076
- 0.7013
AUD/USD forecast, medium term
 Click to enlarge
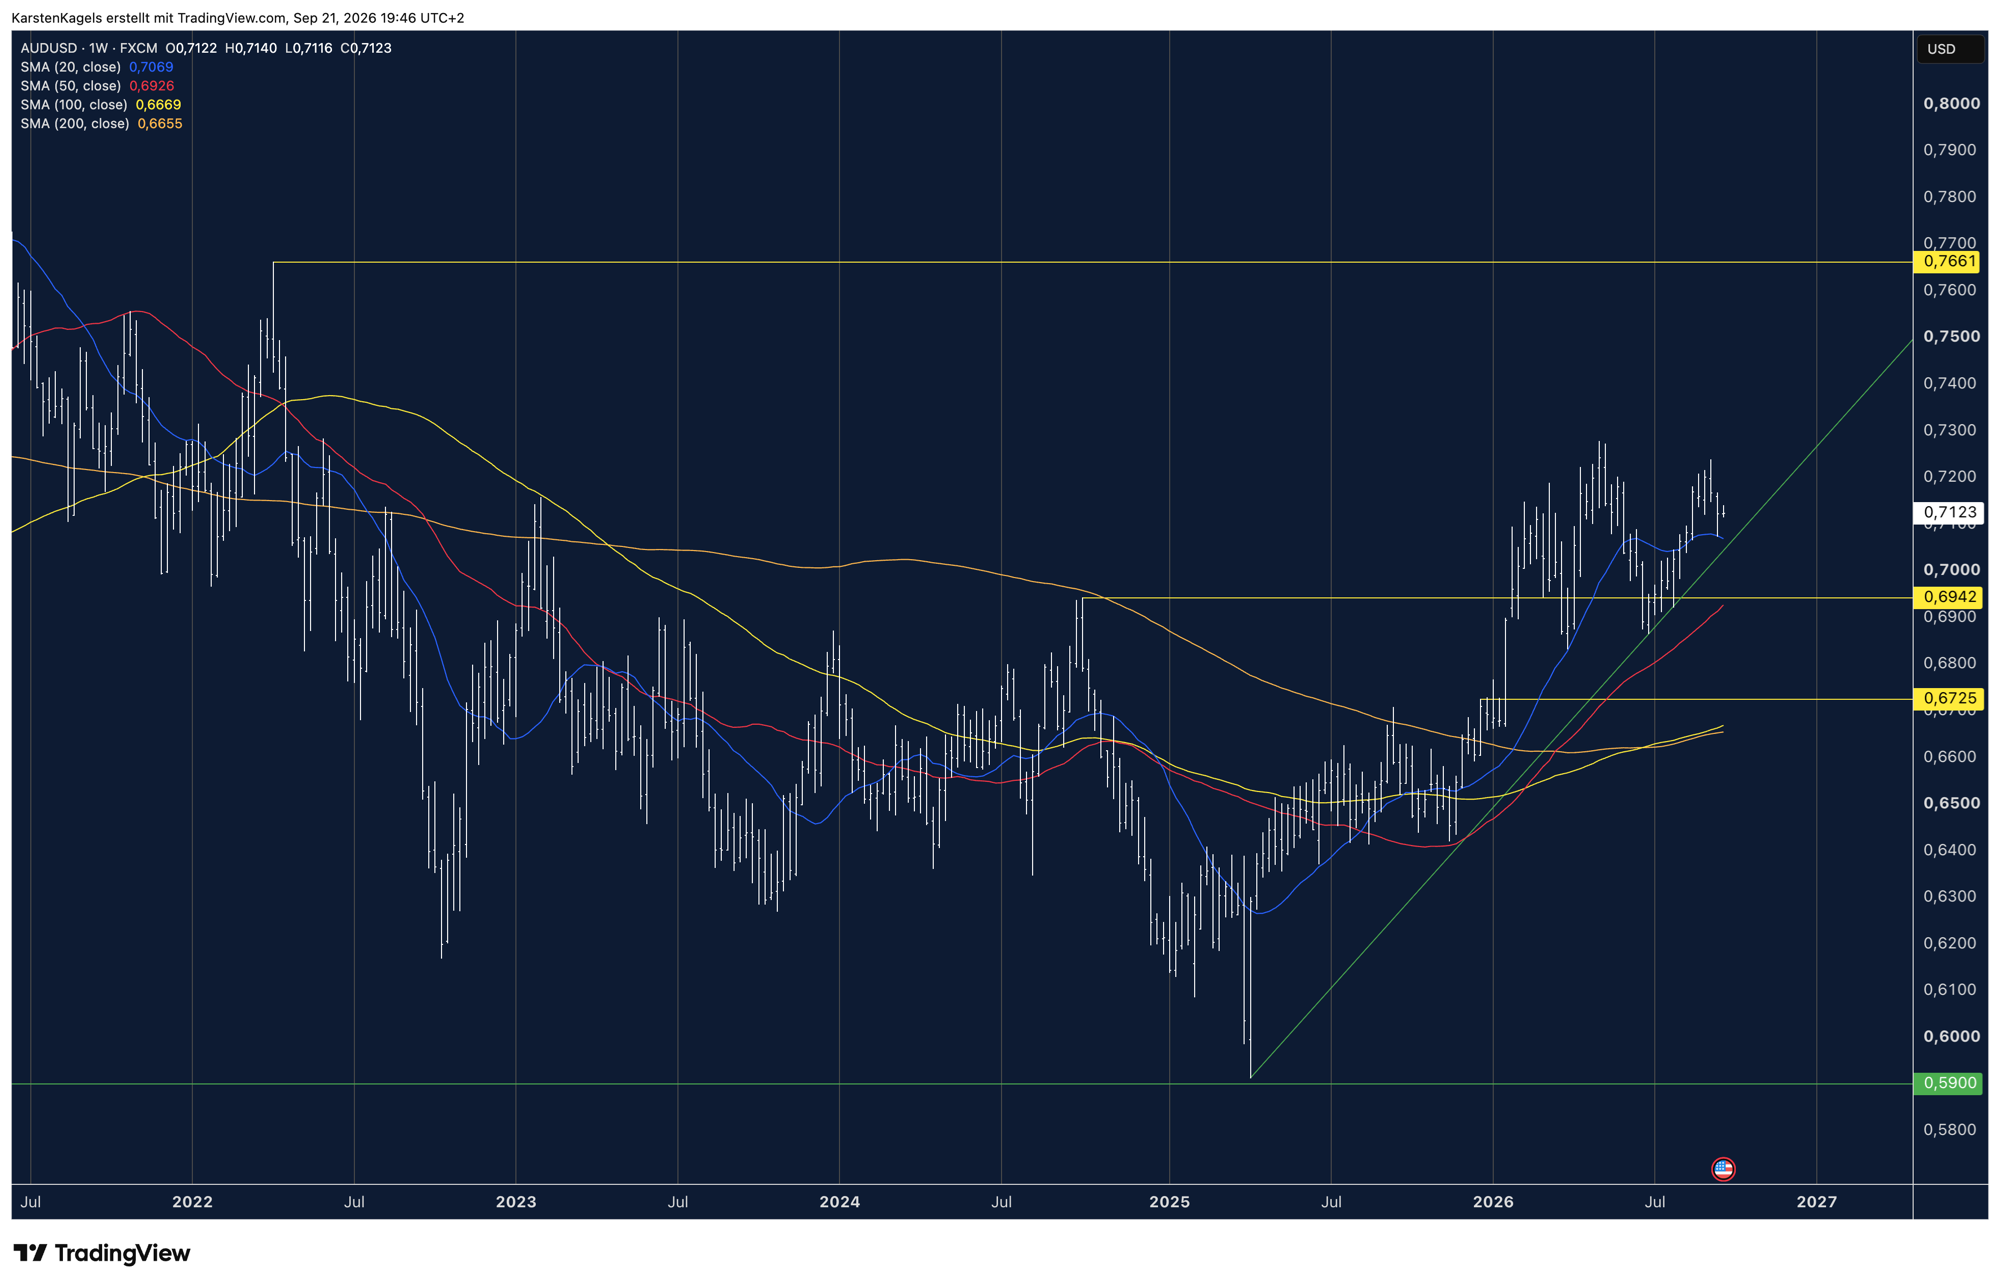
Looking back: from 2022 to 2025 the Aussie moved down and marked its low at 0.5900 in the spring of 2025. The break to the upside came in early 2026. Since then the chart shows higher highs and higher lows, which is the textbook form of an uptrend.
Outlook: the price runs along an uptrend line that starts at the 2025 low. The 20 week average at 0.7069 was tested in the previous week and held. The trend on the weekly chart is intact, and further rises are the more likely outcome.
The road to 2028 hangs on the yearly high. A weekly close above 0.7278 would leave the range of the past years and open the way to the 2022 high at 0.7661. On the downside, only a break of the 50 week line at 0.6926 would be a serious warning.
Resistance
- 0.7661
- 0.7278
Support
- 0.7069
- 0.6926
AUD/USD forecast, long term
 Click to enlarge
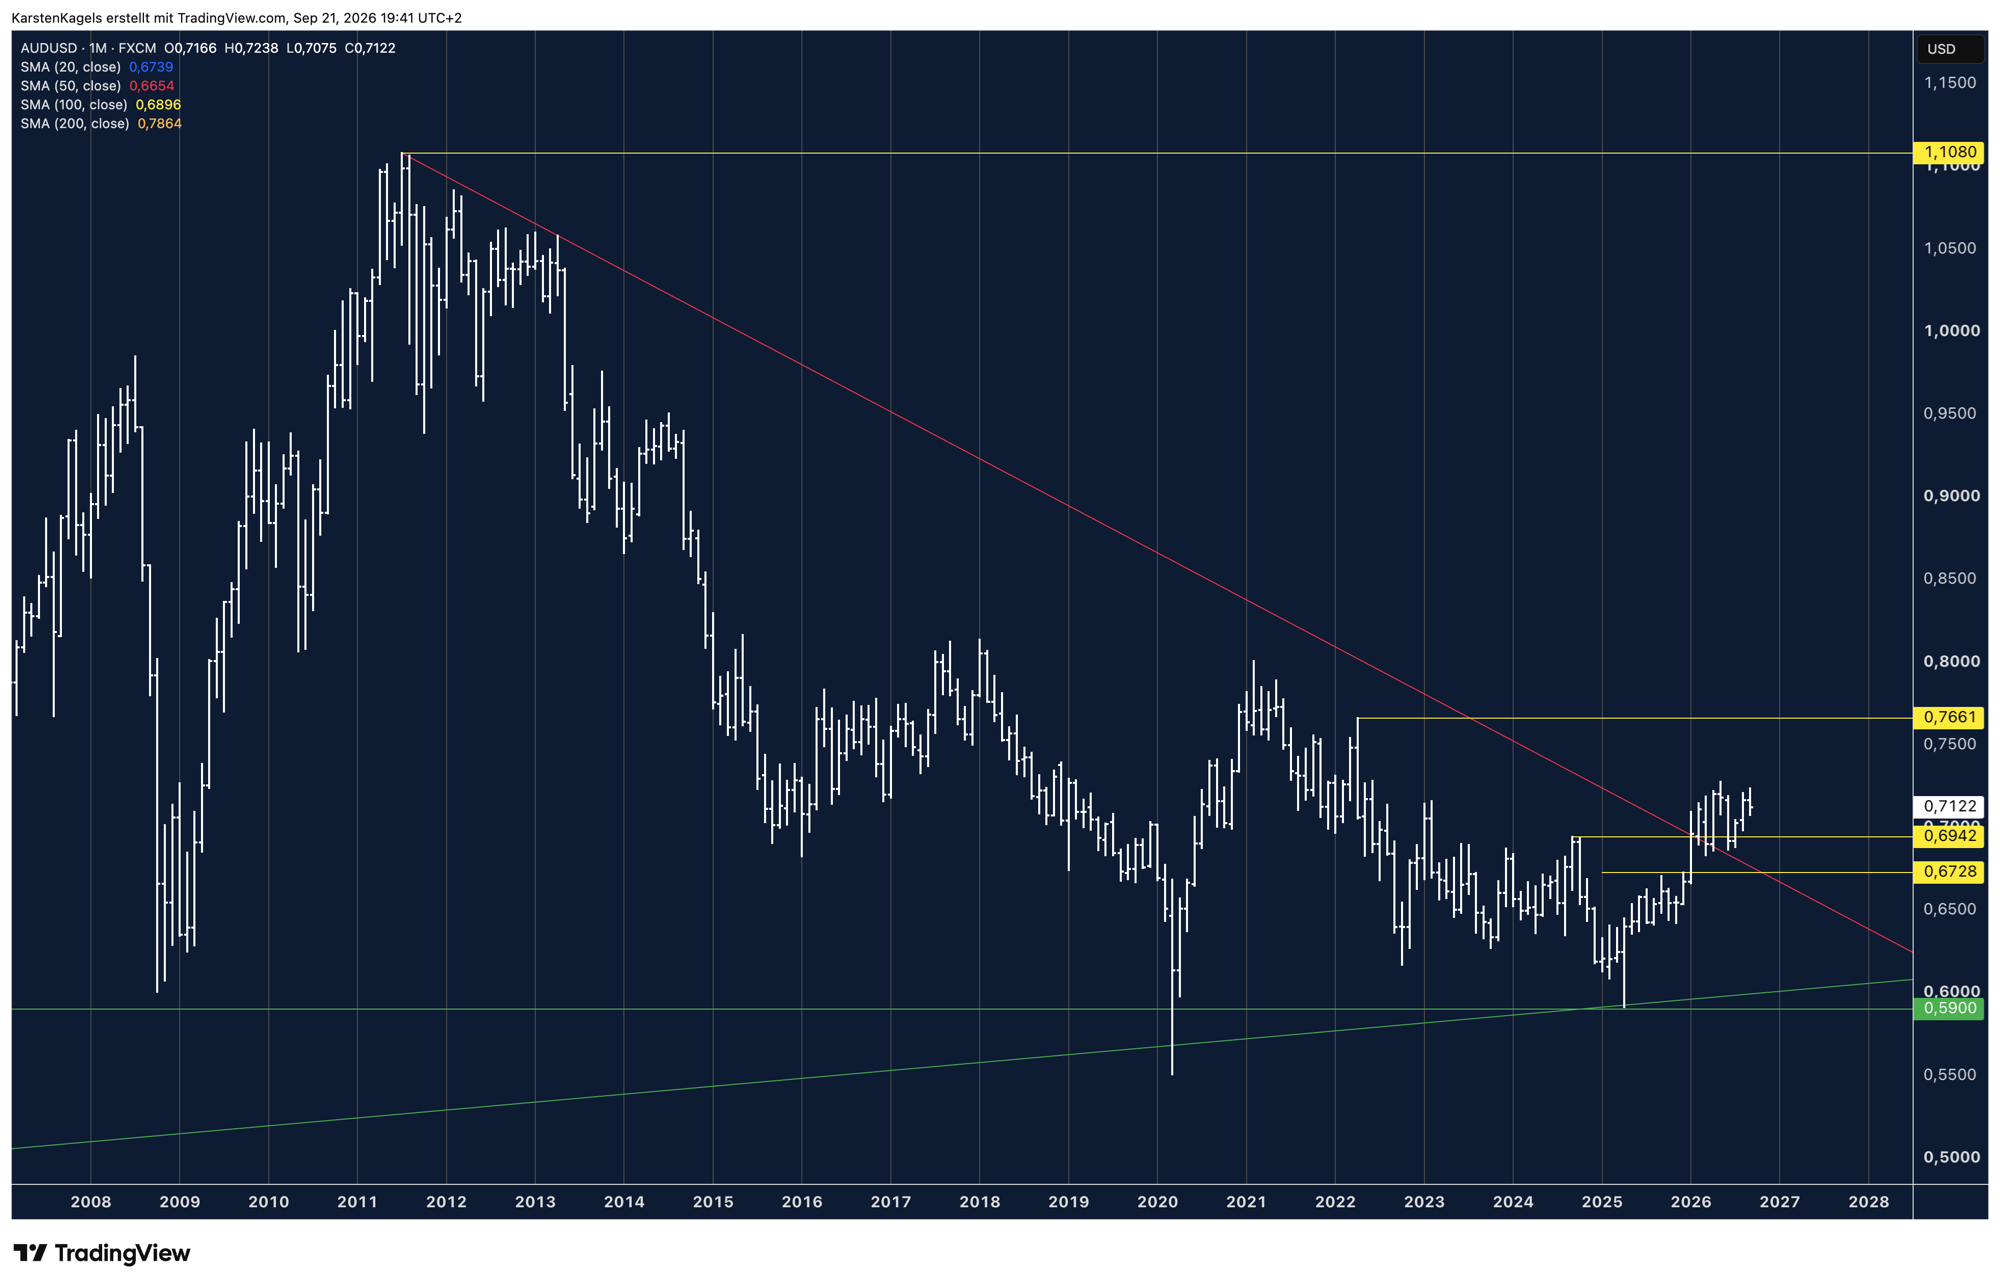
Looking back: the monthly chart shows a long descent. Carried by the commodity boom, the Australian dollar stood at 1.1080 in 2011 and so above parity with the US dollar. A downtrend line runs from that high and capped the price for more than a decade.
That line has now been overcome. The price tested it several times in 2026, and it now carries the price from below. Together with the 2024 high at 0.6942 it forms a cluster, which means several supports in a narrow area. The monthly chart therefore shows an established uptrend.
An overcome resistance can turn into support on a pullback. Buyers who missed the breakout meet traders who close short positions by buying back. Whether the level holds only shows in the further course of the price.
Outlook: more room to the upside, toward the 2022 high at 0.7661, is the more likely case. The picture would only turn from positive to negative if the 2025 high at 0.6728 were undercut.
Resistance
- 1.1080
- 0.7661
Support
- 0.6942
- 0.6728
The yearly chart and the view toward 2030
 Click to enlarge
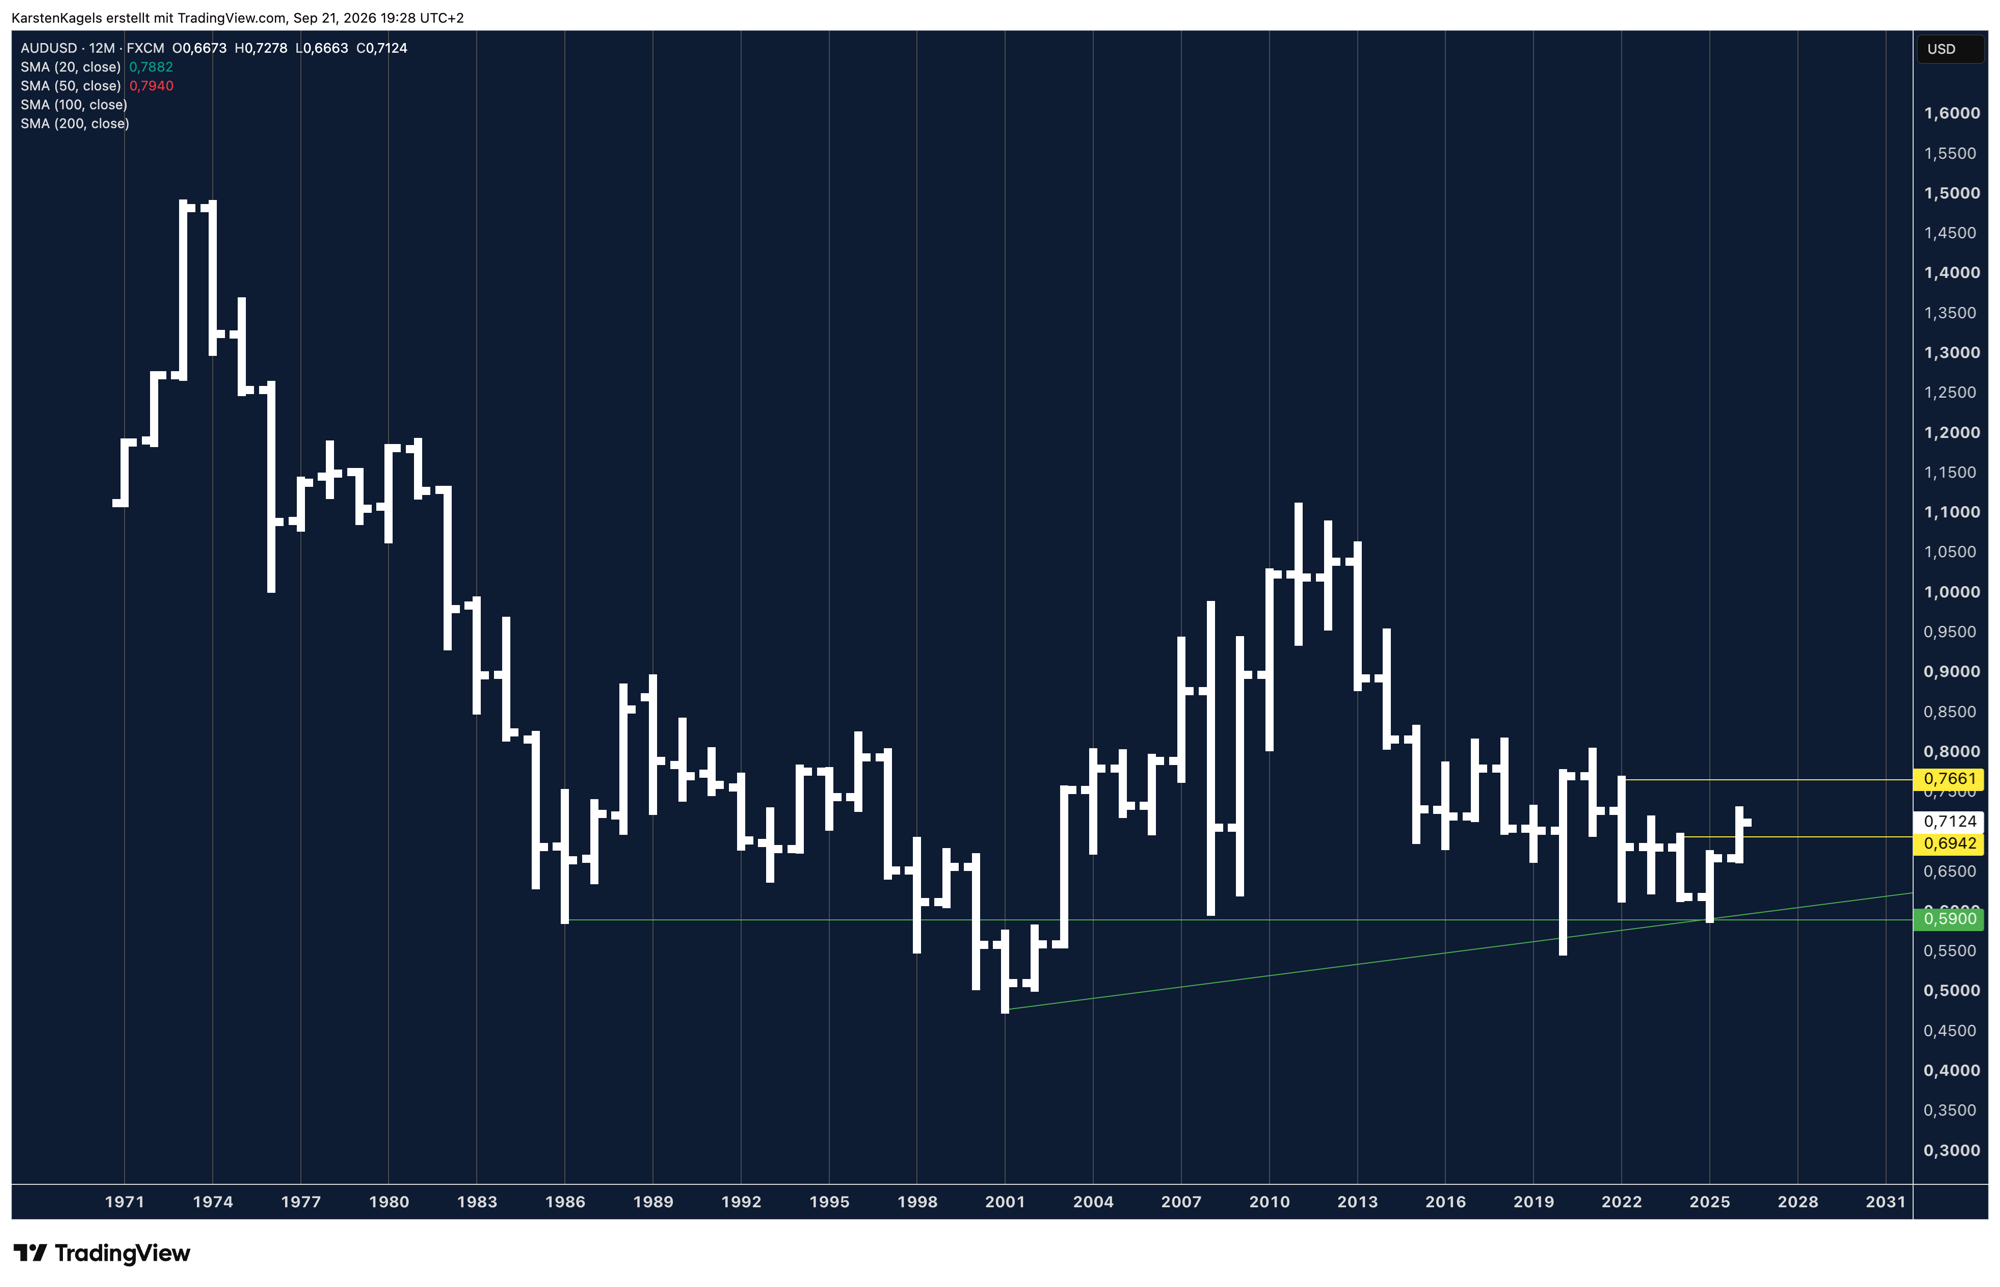
The yearly chart reaches back even further. It starts in 1971. It marks a long term support zone at 0.5900, and the yearly lows of 1986, 2008 and 2025 lie in its area. In between the price also fell well below it, in 2001 and in 2020. The zone is therefore a point of orientation, not a reliable floor.
A long term uptrend line comes on top of it. It connects the lows of 2001, 2020 and 2025. Together with the horizontal support it forms an area where buyers have shown up reliably so far. For the view toward 2030 the picture stays positive as long as that area holds.
This time frame has a limit. A yearly candle closes once a year. The chart says something about direction, but nothing about timing. For an entry you need the smaller time frames above.
Resistance
- 1.1080
- 0.7661
Support
- 0.5900
What is the AUD/USD currency pair?
AUD/USD says how many US dollars one Australian dollar costs. When the price rises, the Aussie gains and the US dollar loses ground.
Traders call the pair the Aussie. It is one of the most traded pairs in the currency market and it has a reputation as a trend pair: moves often run in the same direction for months, which makes it attractive for swing trading.
The Australian dollar is a commodity currency. Australia exports iron ore, coal and gold, mostly to Asia. When those commodity prices rise, more money flows into the country and the Aussie tends to gain. The Canadian dollar works in a similar way with oil, see the USD/CAD forecast.
The Aussie also counts as a risk currency. In calm markets it is in demand, in a crisis it falls quickly. The Corona low of March 2020 shows that in its purest form, when the Aussie dropped below 0.56. The currency has floated freely since 12 December 1983, when Australia gave up its fixed exchange rate. At the time of the float one Aussie was worth about 90 US cents.
What moves the AUD/USD rate
The exchange rate depends on a few strong drivers. These are the ones to watch:
- The rate gap between the RBA and the Fed: the Reserve Bank of Australia raised its cash rate to 4.60% on 30 September 2026. The Fed has been at 3.75 to 4.00% since 17 September 2026. The Australian policy rate is therefore 0.60 percentage points above the upper end of the US target range. That gap can support the Aussie, but holding Australian dollars does not give anyone a claim on the policy rate.
- Australia’s own rate path: the RBA raised three times in the first half of 2026 and has paused twice since. Governor Michele Bullock called inflation still too high and kept the door open for further steps. While other central banks think about cuts, the opposite direction is on the table in Australia.
- Commodities and China: Australia lives on exporting iron ore, coal and gold, and the most important customer is China. When Chinese construction runs, demand for iron ore rises and the Aussie gains. That is why the pair often reacts more strongly to Chinese data than to Australian data. The copper price is a useful second gauge for the same demand.
- Risk appetite: the Aussie is a risk currency. When uncertainty rises, investors leave it quickly, and that can outweigh the rate gap for a while.
- The strength of the US dollar itself: a broadly weak dollar lifts the pair without anything changing in Australia. The EUR/USD forecast is worth reading alongside this page, because that pair is the leading gauge for the dollar.
One widespread assumption does not survive measurement. The often quoted link between AUD/USD and commodity prices turns out weaker than expected. The connection is real, but it only explains part of the move. Anyone forecasting the Aussie through commodities alone misses the rate side and the risk side.
What happened in September 2026
The Fed raised its target range by a quarter point on 16 September 2026, its first increase since July 2023, with a vote of 12 to 0. The gap to the upper end of the US range fell from 0.60 to 0.35 percentage points.
The price moved between 0.7238 and 0.7075 in September, but the decline began before the rate decision. The high of the month came early in September, and the price was already at 0.7138 on 15 September. How much of the move the decision explains cannot be read from the monthly chart alone.
Two weeks later the RBA followed. It raised its cash rate to 4.60% with effect from 30 September 2026, which pushed the gap back to 0.60 percentage points, exactly where it stood before the Fed moved. The next test is the RBA meeting on 2 and 3 November 2026; dates, times and the 2026 votes are in the RBA rate decision.
Technical ratings
A compact overview of the technical situation is available on TradingView. The summary there bundles the most popular indicators, such as moving averages, oscillators and pivots. For a long term view you can switch the interval to monthly.
A technical rating sums up several indicators into one signal. That saves time, but it does not replace your own chart analysis. The number says nothing about where the stop and the target belong, and those two points decide the result of a trade.
Conclusion: trend intact, resistance at the yearly high
The AUD/USD forecast points up across all four time frames. Short term the price sits above both daily averages, medium term comfortably above the 50 week line, and long term above the downtrend line from 2011 that it overcame in 2026.
Two forces support the Aussie. The rate gap runs in its favour, and the US dollar has been broadly weak. One of these supports got smaller in September: the Fed raised, and the rate gap narrowed. The trend has taken that so far. Weak economic data from China stay a risk, and so do changing rate expectations.
For practice, watch the yearly high. On the upside 0.7278 is the threshold, on the downside the 100 day line at 0.7076. A break above the yearly high would matter technically, because it would leave the range of several years.
This is market analysis, not investment advice. Trading currency pairs carries the risk of losing your capital.
Frequently asked questions about the AUD/USD forecast
What is the AUD/USD forecast for 2026?
The chart points up. AUD/USD stood at 0.7122 on 21 September 2026 and so above the 100 day line, the 200 day line and the 50 week average. Above the yearly high at 0.7278 the way opens toward 0.7661.
Is the Australian dollar weak at the moment?
No, in 2026 it belongs to the stronger currencies. From the low for the year at 0.6663 the Aussie has gained about seven percent. In the years before that it was under pressure at times, and it has recovered since the low in the spring of 2025.
Why is the Australian dollar falling?
It is not falling at the moment, it is consolidating. AUD/USD gave ground in September, but the decline began before the Fed decision of 16 September. The range of the month runs from 0.7238 to 0.7075. The rate increase first cut the gap to the upper end of the US target range to 0.35 percentage points. On 30 September the RBA raised to 4.60% itself, so the gap is back at 0.60 points. How much of the move that explains cannot be read from the monthly chart alone.
How high are the policy rates in Australia and the United States?
Australia is higher. The Reserve Bank of Australia raised its cash rate to 4.60% with effect from 30 September 2026, and the Fed stands at 3.75 to 4.00%. The Australian policy rate is therefore 0.60 percentage points above the upper end of the Fed’s target range.
What role do commodities play for the AUD/USD rate?
A large one, but not the only one. Australia exports above all iron ore, coal and gold, mostly to China. Rising commodity prices support the Aussie. Measured carefully, though, the link is weaker than often claimed: the rate side and the risk side explain a considerable part of the move.
Since when has the Australian dollar traded freely?
Since 12 December 1983. The government under Bob Hawke decided on 9 December 1983 to give up the fixed exchange rate. At the time of the float the Aussie was worth about 90 US cents. Supply and demand have set the price ever since.
How can you trade AUD/USD?
Through forex brokers or derivatives. The Aussie is one of the most liquid pairs and the spreads are tight. Because it falls quickly as a risk currency in phases of stress, every position needs a stop.
This forecast is translated from the German edition on kagels-trading.de.
How our forecasts are made and reviewed: How we work.