
Palladium Price Forecast: 2026, 2027 and 2030


This analysis is from 1 October 2026. Prices have moved since, so the levels below may no longer apply until the next update.
Palladium forecast in 30 seconds
Current price
$1,185 in the NYMEX palladium future (1 October 2026), about 65% below the all-time high of $3,425. See all forecasts.
The level that matters
The 2001 high at $1,090, roughly 8% below the current price. It is the most important support on the yearly chart.
Trend
Below all four daily moving averages, and the short-term uptrend line broke in September. The downtrend is intact.
If support fails
Next come the 2014 high at $913, the 2011 high at $862 and the 2024 low at $814.
On this page
- Palladium forecast in 30 seconds
- Palladium price forecast Thursday, 1 October 2026: the daily chart
- Palladium forecast 2027: the weekly chart at the support cluster
- Palladium on the monthly chart: the correction since the record high
- Palladium forecast 2030: the yearly chart since 1992
- What the analysts expect for palladium
- Palladium vs gold, platinum and silver
- What moves the palladium price
- What is palladium? Supply and demand at a glance
- Palladium price history: the yearly record since 2007
- How to invest in palladium
- Frequently asked questions about the palladium forecast
Palladium price forecast Thursday, 1 October 2026: the daily chart
 Click to enlarge
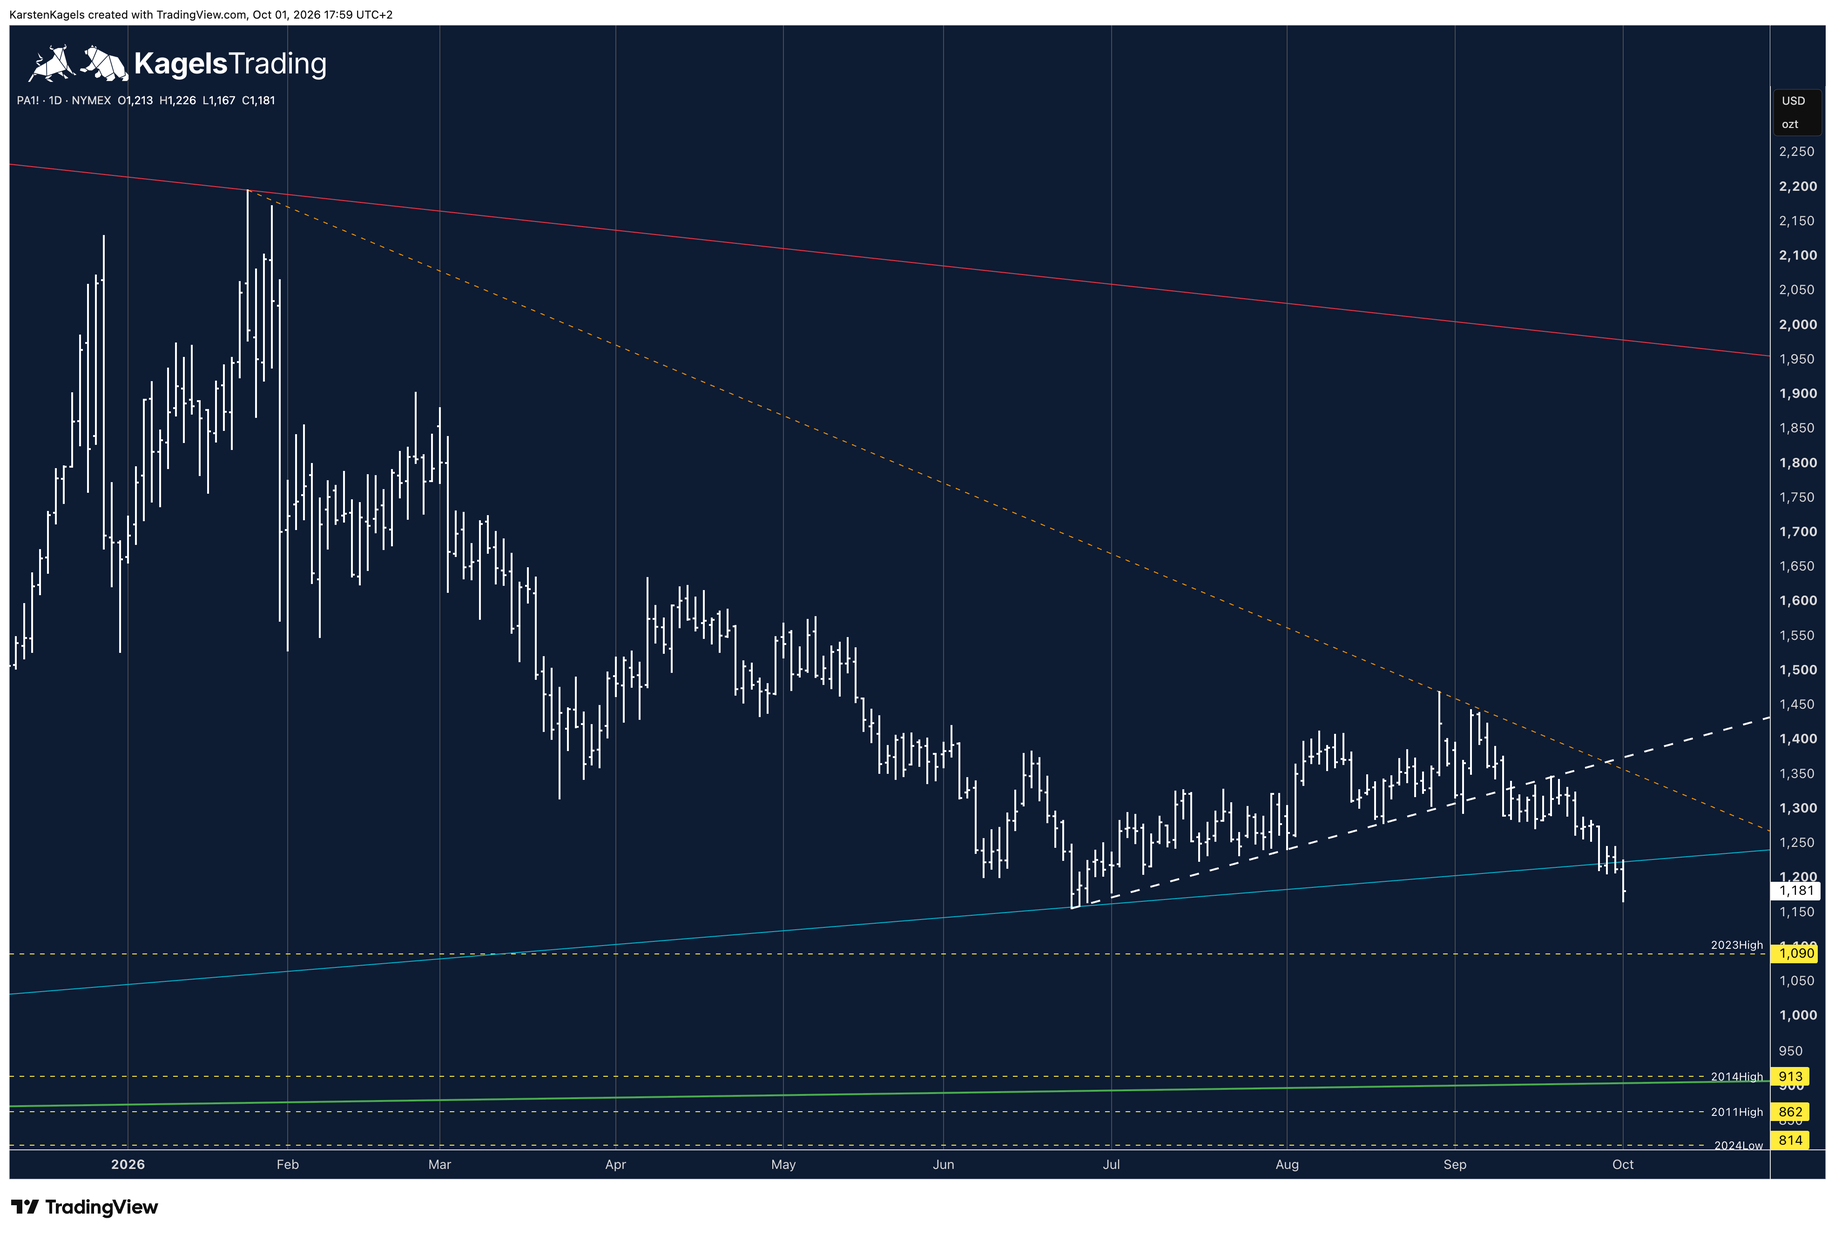
The daily chart shows a clear picture. Since the 2026 high at $2,196 in February, palladium has been in a downtrend capped by an orange downtrend line. That line has turned back every recovery attempt this year.
In September a second signal arrived: the price broke the short-term uptrend line that had carried the market since the summer low. The white dashed line in the chart marks it. Since then palladium has traded below that line.
The moving averages make the picture even clearer, because the market sits below all four of them. The 20-day average stands at $1,313, the 50-day and the 100-day both at $1,322, and the 200-day average at $1,500. That is between 10% and 21% above the current price.
When a market trades below every moving average, sellers are in control. For the picture to ease, palladium would first have to climb back above the cluster at $1,313 to $1,322, and only then would the breakout level at $1,355 come back into reach.
Bullish case: back above the moving averages
A recovery needs the cluster of daily averages at $1,313 to $1,322 first. Above it, the breakout level at $1,355 becomes the next target. Until that happens, every rally is a counter-move inside the downtrend.
Resistance zone: $1,313 – $1,355
Bearish case: the 2026 low gives way
If the 2026 low at $1,156 falls, the path to the 1,090 level is open. Below that waits the round $1,000 mark. Both levels together form the last dense zone before the market gets a lot cheaper.
Support zone: $1,000 – $1,156
Resistance
- $2,196
- $1,531
- $1,355
Price at analysis$1,185
Support
- $1,156
- $1,090
- $1,000
Palladium forecast 2027: the weekly chart at the support cluster
 Click to enlarge
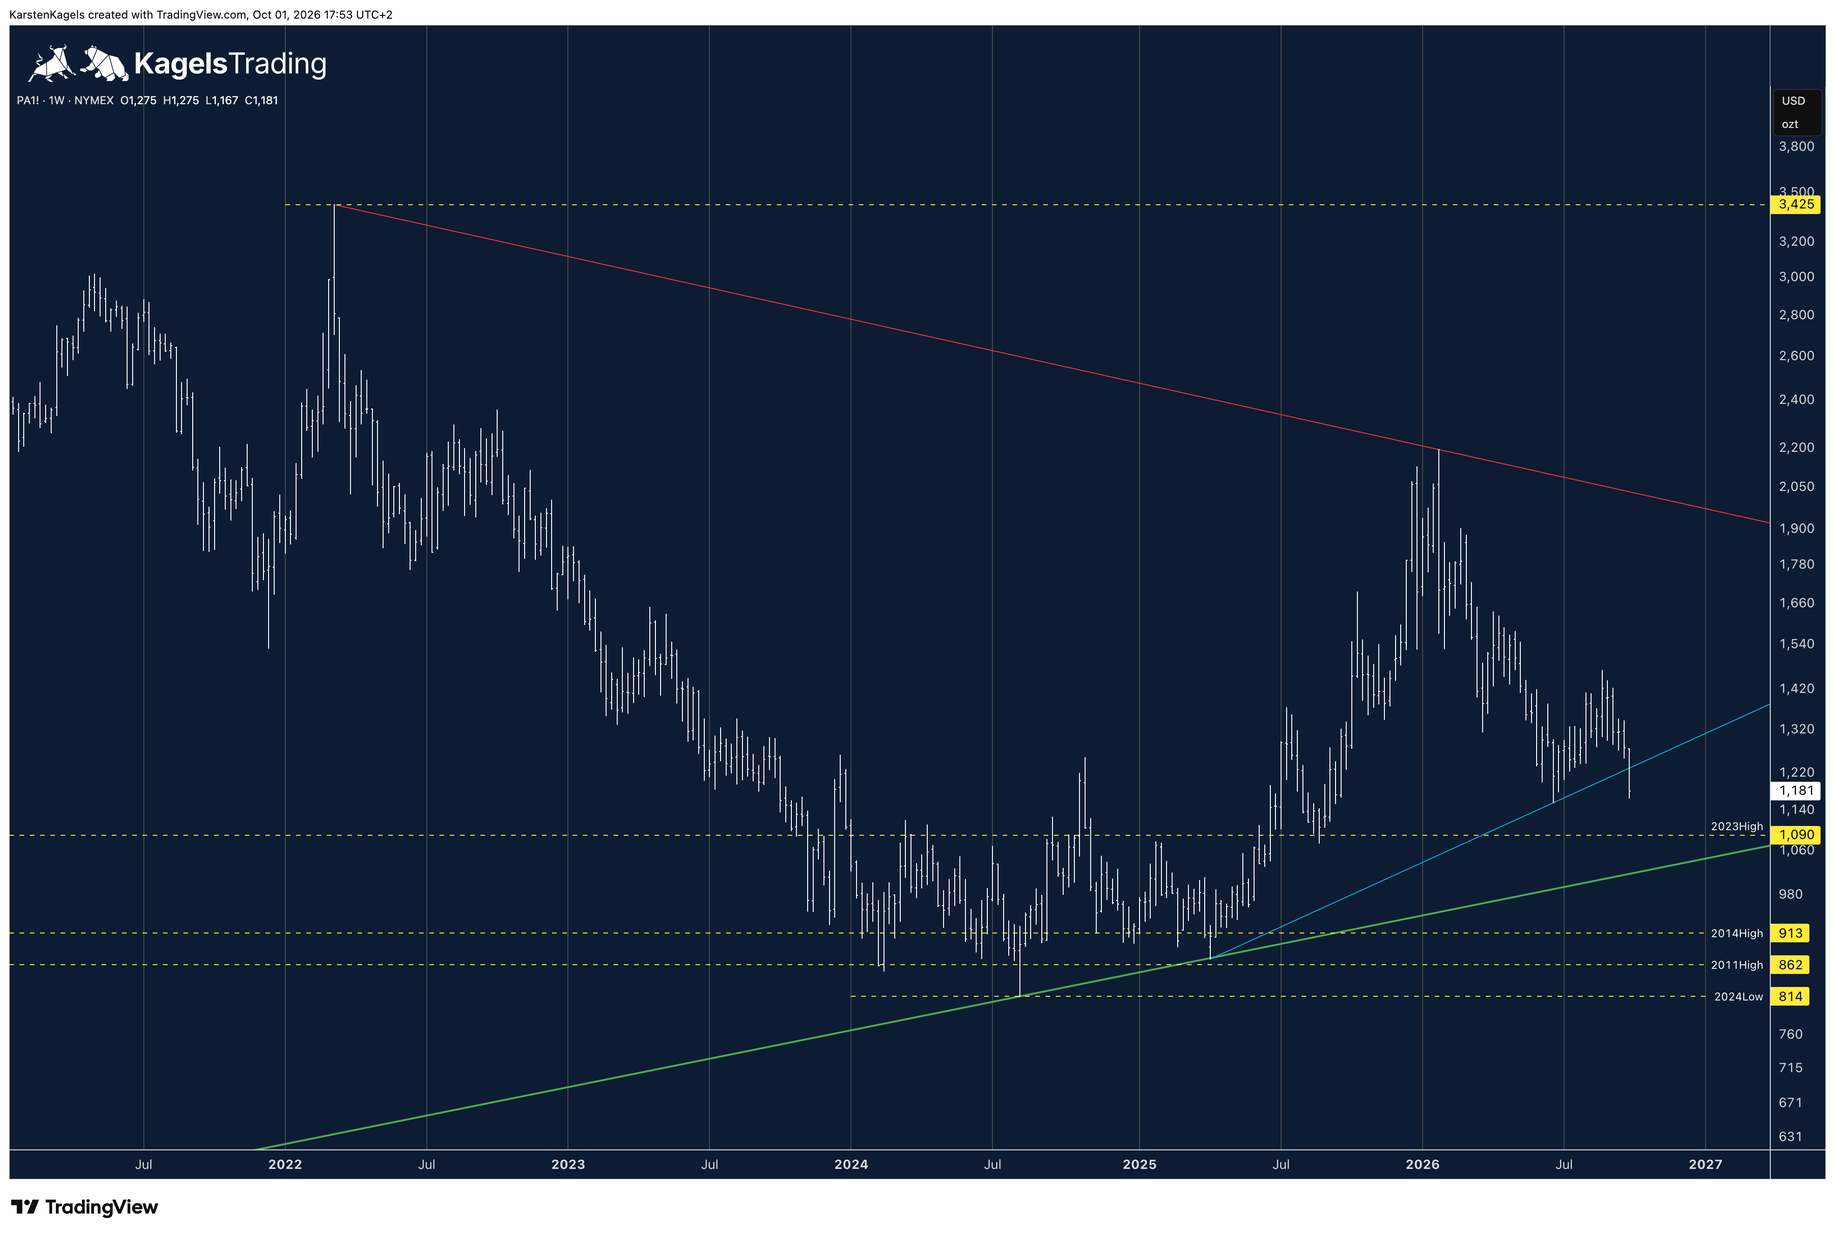
On the weekly chart palladium has broken the short-term uptrend line that had carried the market since the 2024 low. The light blue line in the chart marks it. With that, the recovery which began in autumn 2025 is over for now.
The market is now approaching the support cluster that decides the next months. It consists of two elements: the 2001 high at $1,090 and the psychologically important $1,000 mark. Roughly 8% separate the two.
A market running into such a double zone is rarely waved through without resistance. On a weekly basis the price also trades below both averages: 9.5% below the 20-week line at $1,305 and 20.6% below the 50-week line at $1,487.
Resistance
- $1,531
- $1,355
Support
- $1,156
- $1,090
- $1,000
Palladium on the monthly chart: the correction since the record high
 Click to enlarge
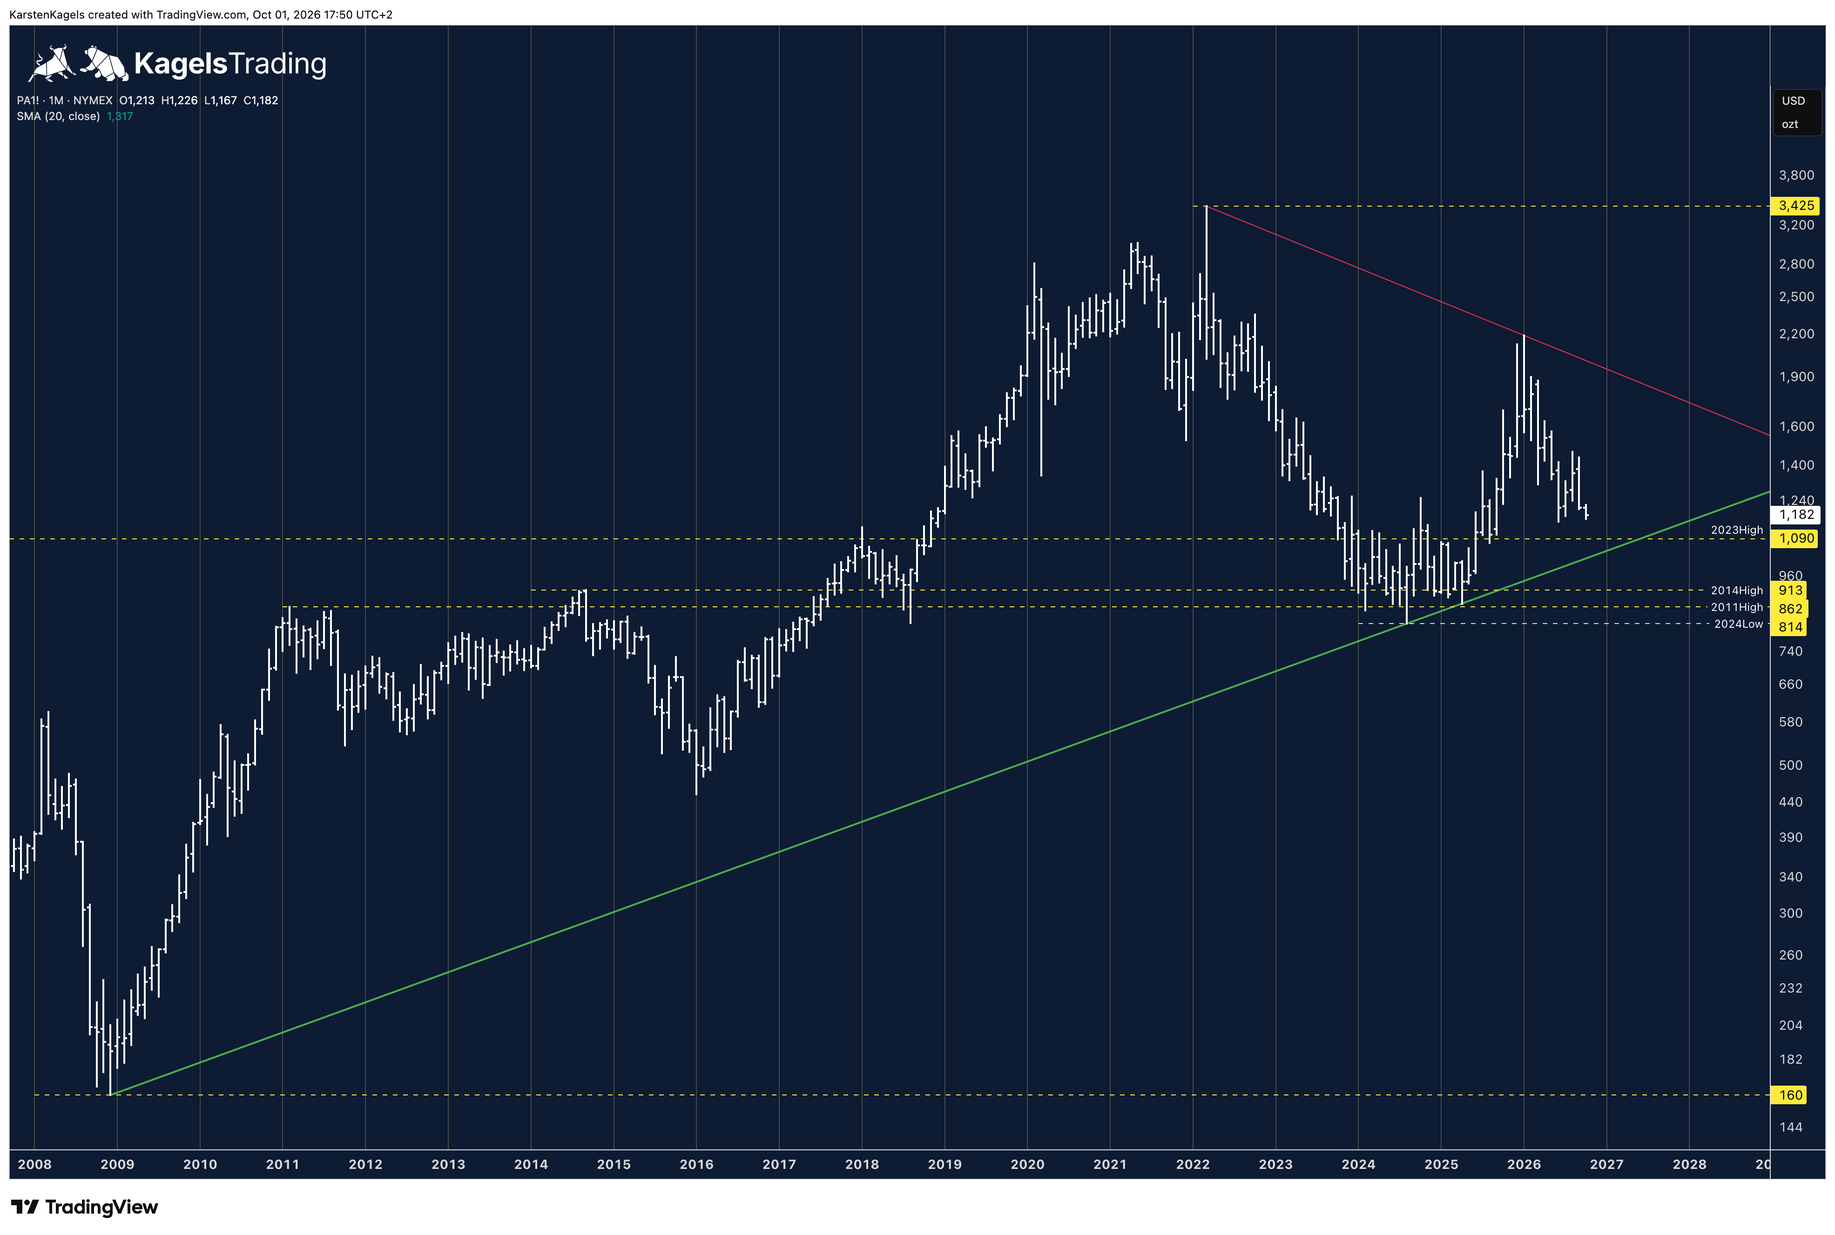
The logarithmic monthly chart shows the whole move: from the crisis low at $160 up to the all-time high at $3,425 in 2022, and the correction of the past years. What was built over more than a decade has largely been given back.
Palladium trades 10.3% below the 20-month average at $1,317. That matters because this average worked as a guide for years. As long as the price stays below it, the broader recovery is not confirmed.
The chart also shows how dense the support zone below the market is. Between the 2001 high at $1,090 and the 2024 low at $814 sit four levels within roughly 25%. Below $814 the chart offers nothing until far lower.
Resistance
- $2,196
- $1,841
- $1,355
Support
- $1,317
- $1,090
- $913
- $814
Palladium forecast 2030: the yearly chart since 1992
 Click to enlarge
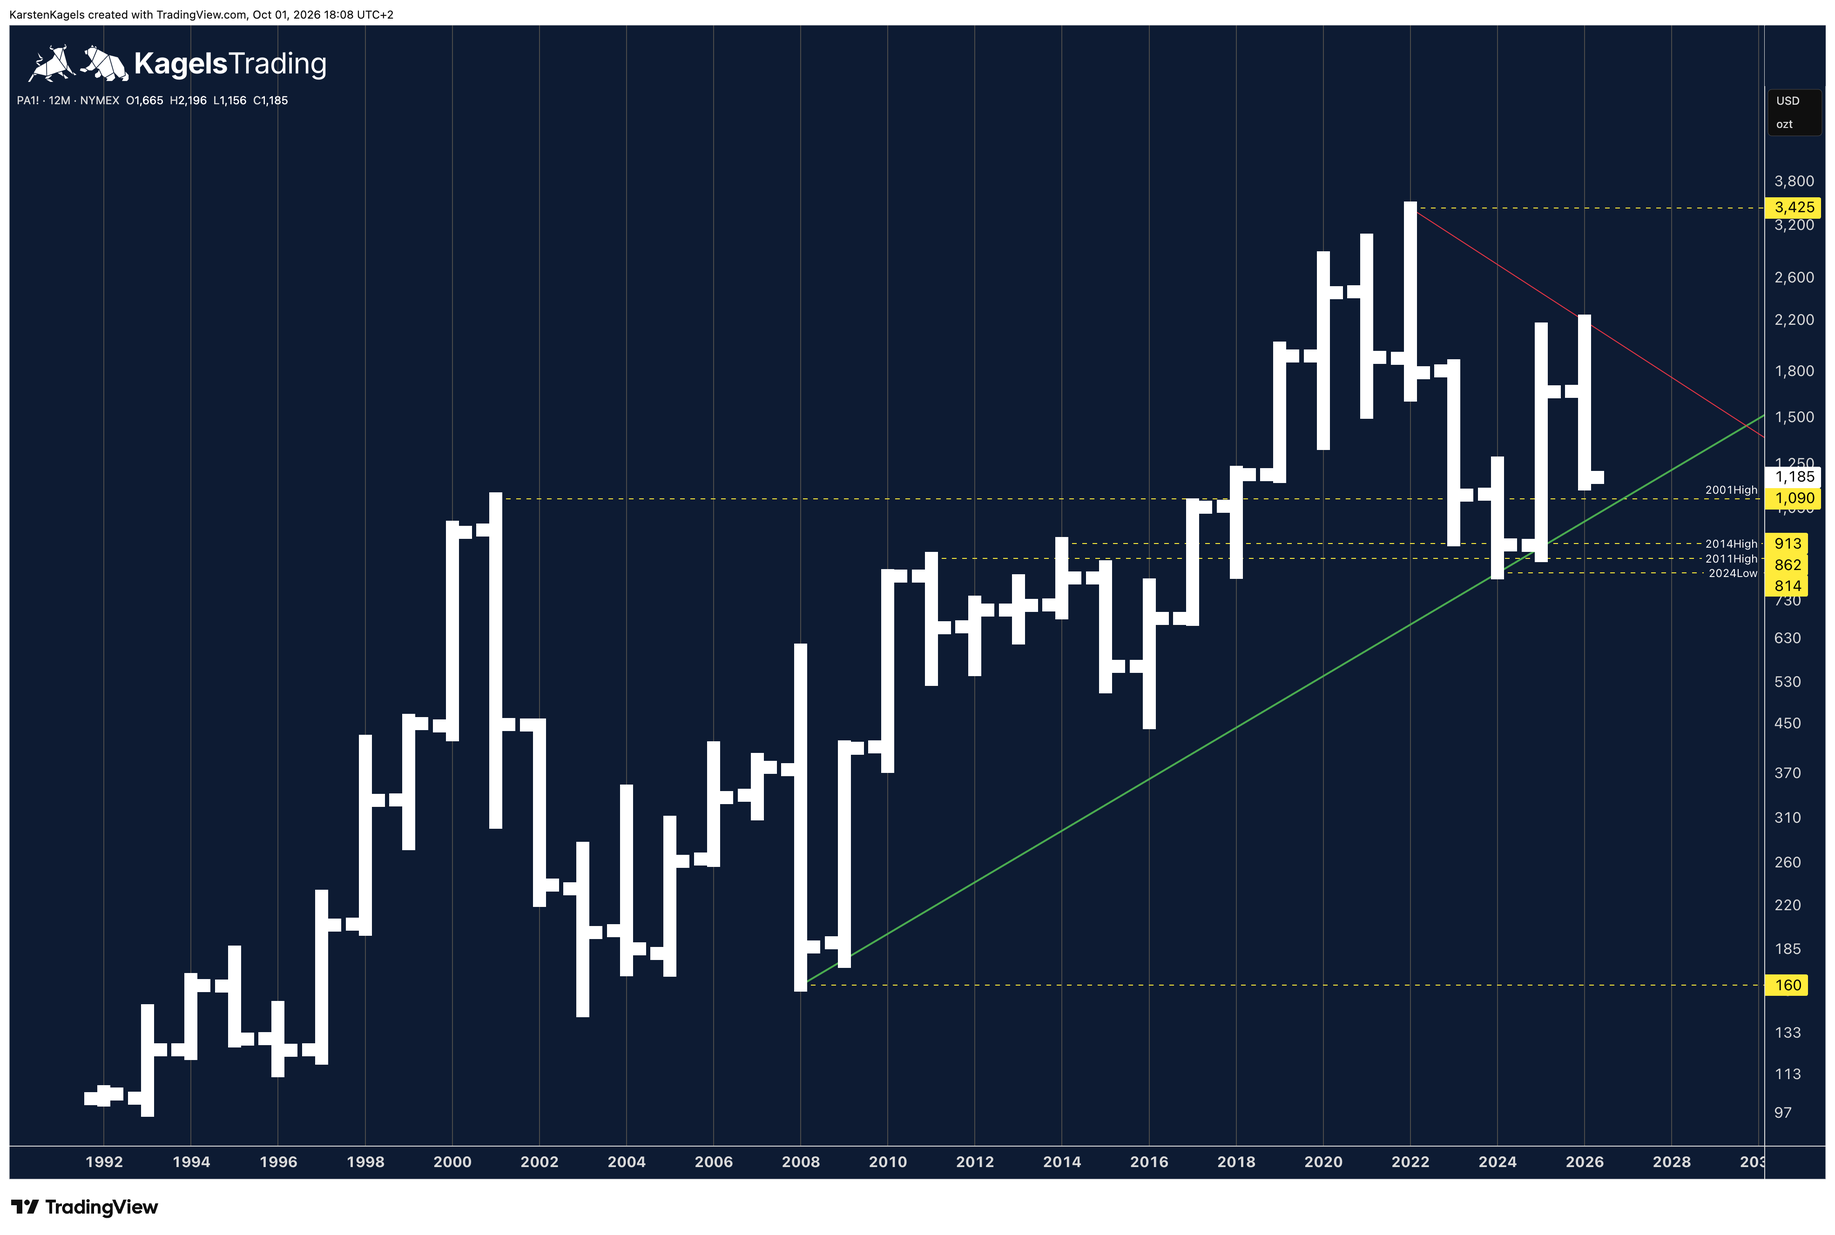
On the yearly chart since 1992 the scale becomes visible. The 2026 yearly candle opened at $1,665, printed a high at $2,196 and currently stands at $1,185. That is a loss of 28.8% since the start of the year, and the year is not over.
The market is therefore close to reaching its most important support: the 2001 high at $1,090. From here that is roughly 8%. A level that has been in the chart for 25 years carries more weight than any interim low of the past months.
If selling pressure continues, the next supports are the highs of 2014 at $913 and of 2011 at $862, below them the 2024 low at $814. These are not price targets, they are the levels where the market last found a floor. For reference, the 2023 high sits at $1,841.
Resistance
- $3,425
- $2,196
- $1,841
Support
- $1,090
- $1,000
- $913
- $862
- $814
What the analysts expect for palladium
Chart analysis shows where a market stands, the forecasts of the big houses show what the professionals expect. At palladium the two views sit unusually far apart in 2026.
UBS is worth a closer look, because the headline misleads. The bank did cut its palladium target in May 2026 by $200. But the new value is $1,600 per ounce, roughly 35% above today's price. A lowered forecast is still an optimistic forecast here. UBS justified the cut with the dependence on the car sector, which accounted for 80% to 85% of total consumption over the past six years.
On the long-term picture the bank is far more direct: without new markets, palladium is heading into a structural surplus in the coming years. At the same time UBS points to new applications. The largest producer has filed patents that are expected to create demand of 1.7 million ounces between 2030 and 2035, mainly in fibre optics production in China, plus solar technology and microelectronics. Measured against the roughly 8 million ounces the catalyst sector consumes each year, that remains a fraction.
Heraeus expects a larger market surplus for 2026 and a range of $950 to $1,500. Primary supply should rise slightly, secondary supply as well through higher recycling rates, while global demand is seen slightly lower. One remark stands out: the palladium price could rise if the platinum price moves up.
The model run by Trading Economics arrives at around $1,273 for the end of the quarter and about $1,048 in twelve months. That is an extrapolation, not a house view, but it works as a sober cross-check against the chart.
Taken together the picture is unusual: the fundamentals argue against palladium at all three sources, yet the price targets range from $950 to $1,600. Anyone reading a precise annual forecast for palladium should be sceptical. That is why this page works with scenarios and levels rather than a single target.
Resistance
- $1,600
Support
- $1,048
- $950
Palladium vs gold, platinum and silver
 Click to enlarge
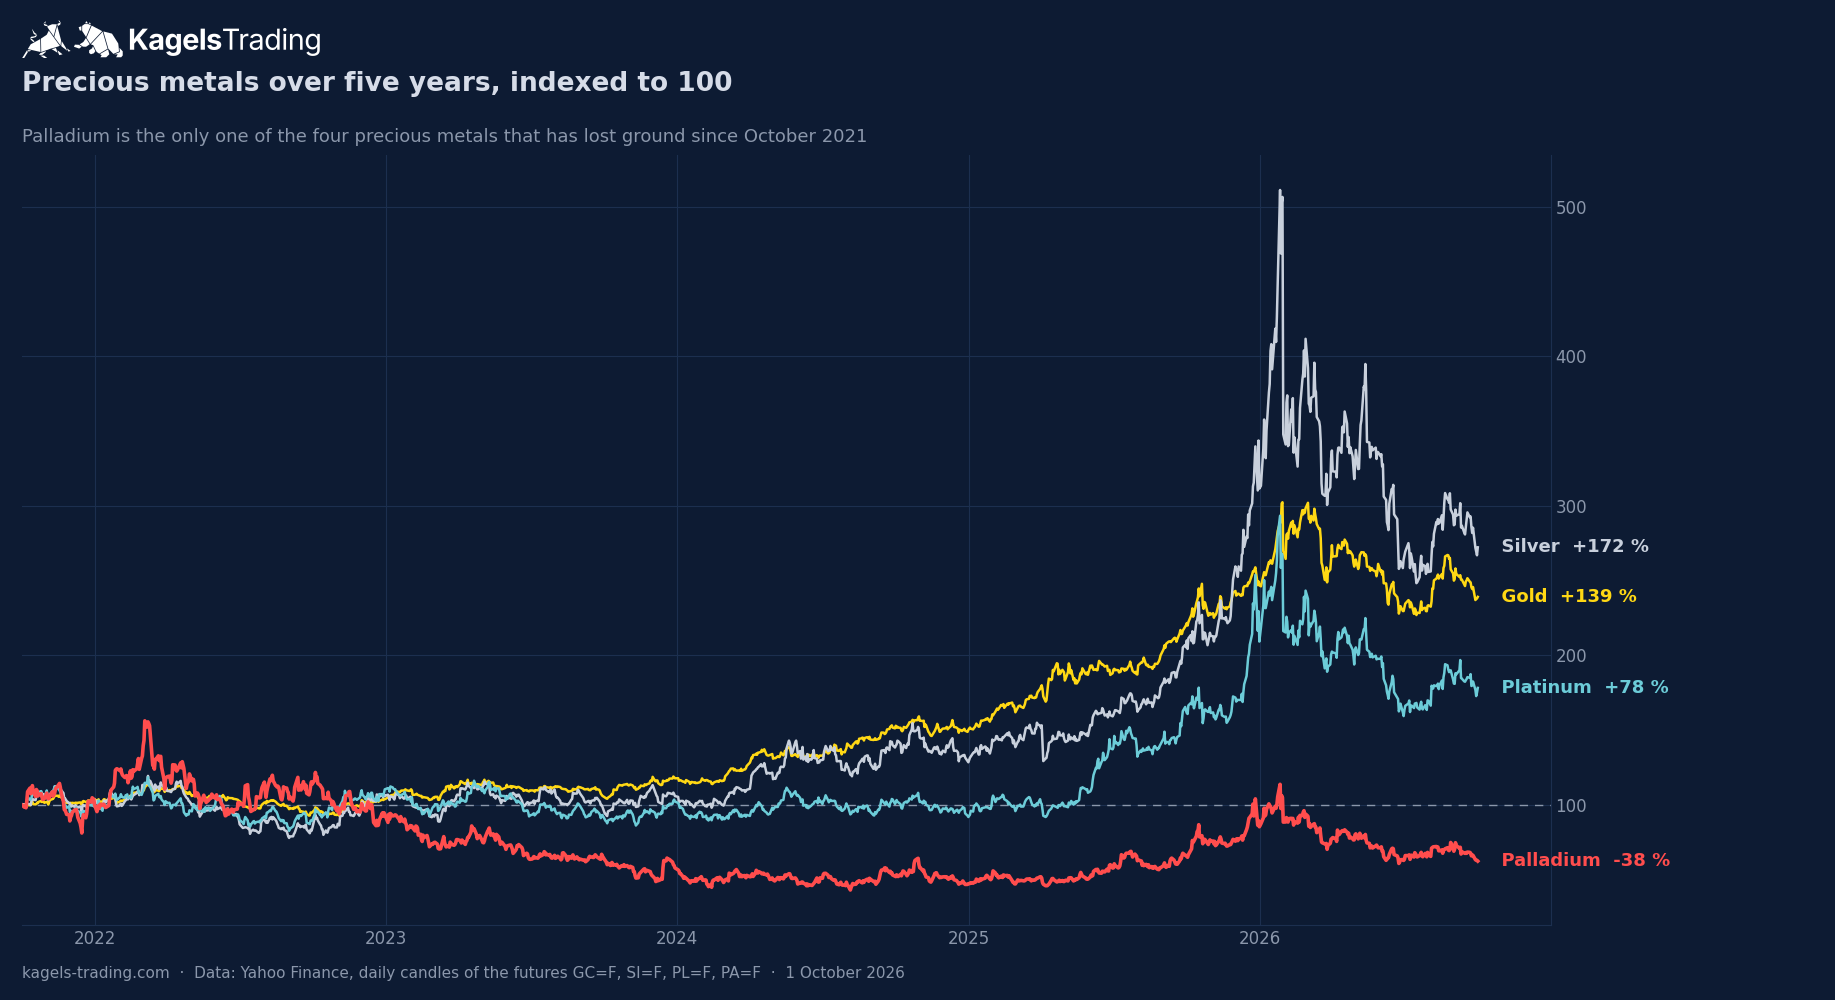
The four precious metals have developed very differently over the past five years. Gold gained 139%, silver even 172%, and platinum 78%. Palladium lost 38% in the same period and is the only one of the four in the red.
The chart makes the break visible. Until the end of 2022 all four metals moved closely together. Then gold and silver pulled away, carried by rate cut expectations and central bank buying, while palladium tipped into its downtrend.
Platinum only broke out in 2026, and in doing so overtook palladium for good. On 1 October 2026 platinum traded at about $1,733, palladium at $1,185. Platinum is therefore around 45% more expensive, which reverses the argument that drove the market for years: carmakers used to replace palladium with cheaper platinum.
For a portfolio that means gold stays the defensive element, silver combines investment and industrial demand, and platinum and palladium are the two most industrial of the four. Of all four, palladium depends most on a single industry. How the platinum side looks is in our platinum price forecast.
What moves the palladium price
Four forces set the palladium price: car demand, supply from two countries, the relationship to platinum and the interest rate environment. Anyone who keeps these four in view understands most of the moves.
Around 80% of the metal goes into catalysts for petrol and hybrid cars. Stricter emission rules support demand in principle, delays in implementing them slow it down. At the same time the share of pure electric vehicles keeps growing, and those need no palladium. The hybrid segment is therefore the decisive factor.
Russia and South Africa account for roughly three quarters of world production, which makes the market vulnerable to single disruptions. New sanctions against Russia could hit exports, as in 2021 and 2022 when the ounce briefly cost more than $3,000. South Africa's mining industry struggles with power shortages and ageing infrastructure.
The most important change compared with previous years is the surplus. Both Heraeus and UBS expect a supply surplus for 2026, driven from two sides: recycling from spent catalysts is rising while demand from the car industry gives way. A market in surplus needs an outside trigger to rise sustainably.
A strong US dollar makes palladium more expensive for buyers outside the United States, and rising rates make non-yielding metals less attractive. Add speculation on the futures exchanges, which can amplify short-term swings. These factors do not set trends, but they set the pace.
What is palladium? Supply and demand at a glance
Palladium is a silvery-white precious metal from the platinum group that is used mainly in car catalysts and occurs almost exclusively as a by-product of platinum and nickel mining. It trades on the commodity exchanges in US dollars per troy ounce, one troy ounce being 31.1035 grams.
These two properties explain almost everything that happens in this market. Because the metal is corrosion-resistant and converts exhaust gases reliably, it is hard to replace in petrol and hybrid engines. And because it is barely mined on purpose, supply cannot react quickly to rising prices. A producer who wants more palladium has to mine more platinum or nickel.
A car catalyst is a component in the exhaust system that uses precious metals such as palladium, platinum and rhodium to convert harmful exhaust gases into less harmful substances.
Roughly 80% of global palladium demand falls on this single application. The rest is spread across electronics, where the metal sits in contacts and capacitors, plus jewellery and investment products. That concentration on one customer makes palladium more exposed to economic cycles than gold or silver.
Palladium price history: the yearly record since 2007
Anyone who wants to put palladium in context should know the annual results. They show that this market does not move in quiet trends but in jumps and crashes. Three years with gains above 50% stand against five years with double-digit losses.
| Year | Close | Change |
|---|---|---|
| 2026 (1 Oct) | $1,180 | −27.5% |
| 2025 | $1,629 | +80.4% |
| 2024 | $903 | −18.2% |
| 2023 | $1,104 | −38.3% |
| 2022 | $1,789 | −6.2% |
| 2021 | $1,908 | −22.1% |
| 2020 | $2,448 | +28.3% |
| 2019 | $1,909 | +52.3% |
| 2018 | $1,254 | +16.8% |
| 2017 | $1,074 | +57.3% |
| 2016 | $683 | +21.7% |
| 2015 | $561 | −29.8% |
| 2014 | $798 | +11.3% |
| 2013 | $717 | +2.1% |
| 2012 | $703 | +7.2% |
| 2011 | $656 | −18.4% |
| 2010 | $803 | +97.2% |
| 2009 | $407 | +118.2% |
| 2008 | $187 | −48.9% |
| 2007 | $365 |
Annual closing prices of the palladium future, data: Yahoo Finance. The levels in the chart sections come from the original charts and can differ slightly because of settlement and contract rolls.
Three phases stand out. From 2009 to 2020 a long upward cycle ran, carried by stricter emission standards and tight supply. In those twelve years the price rose roughly sixfold. Then came the peak in 2021 and 2022 with the all-time high, and since then a correction that still holds.
The year 2025 is striking, with a gain of 80.4%. That recovery has been given back almost entirely in 2026. Anyone who read the 2025 rally as a trend reversal is paying tuition this year.
How to invest in palladium
There are several ways into the palladium market, and they differ mainly in time horizon and risk. The choice depends less on the metal than on whether you want to invest or to trade.
Physical bars and coins are the most direct route and the most expensive one. Storage costs money and the spread between buying and selling price is noticeable. For short-term positions physical palladium is not practical.
An ETC is an exchange-traded note that tracks the price of a commodity and is usually backed by physically held metal.
Available products include the iShares Physical Palladium, the WisdomTree Physical Palladium and the UBS ETF Palladium. The difference to a fund matters: an ETC is legally a debt security, not a segregated fund. Physical backing is therefore the decisive selection criterion. How mining shares behave against the metal price instead is shown in our overview of silver producers.
A future is an exchange-traded contract in which two parties agree to exchange a set quantity of a commodity at a fixed price on a future date.
The palladium future on the NYMEX is the instrument of professional market participants and the basis of the prices on this page. Its contract size of 100 ounces means a value of roughly $118,000 per contract at the current price, which is too large for most private investors.
Producer shares are the indirect route. The names accessible to investors are Valterra Platinum, which was called Anglo American Platinum until May 2025, plus Sibanye Stillwater and Impala Platinum. The Russian market leader Norilsk Nickel dominates world production, but its depositary receipts are no longer practically tradable on Western exchanges. Producer shares also swing harder than the metal itself, because company risk is added to price risk.
Frequently asked questions about the palladium forecast
Will palladium rise again?
Long term palladium has upside, short term the chart and the fundamentals argue against it. The price trades below every moving average and sits only around 2% above the low of the year. What matters is the support cluster between the 2001 high at $1,090 and the round $1,000 mark. Only if buyers show up there does the correction turn into a floor.
How high can palladium go?
The estimates differ widely. UBS sees palladium at $1,600, even though it cut its target by $200 in May 2026. Heraeus names a range of $950 to $1,500, and the model from Trading Economics arrives at about $1,048 over twelve months. On the chart, the breakout level at $1,355 and then the 2026 high at $2,196 are the markers to the upside.
Is palladium a good store of value?
Palladium is far more an industrial metal than a store of value. Around 80% of demand hangs on a single industry, which makes it more volatile than gold. As an addition for investors who deliberately want exposure to the industrial cycle it can fit. As a defensive anchor it does not.
Why is platinum more expensive than palladium?
For years carmakers replaced palladium with the cheaper platinum, which pushed palladium demand down. That calculation no longer works: on 1 October 2026 platinum traded at about $1,733 and palladium at $1,185. Platinum is therefore roughly 45% more expensive, and the substitution argument has reversed. The effect works slowly, though, because changing catalyst recipes takes years.
What is the basis for these palladium forecasts?
The basis is the technical analysis of the palladium chart across four time frames, from the daily chart to the yearly chart since 1992. We work with horizontal levels, trend lines and moving averages. Fundamental factors are added on top, meaning supply and demand, economic developments and the role of the metal in industry. Forecasts from outside houses are listed separately and with their source.
This forecast is translated from the German edition on kagels-trading.de.
How our forecasts are made and reviewed: How we work.