
USD/JPY Forecast: Next Week, Coming Days and Long Term


This analysis is from 18 October 2026. Prices have moved since, so the levels below may no longer apply until the next update.
USD/JPY ended the week at 157.98 yen. For the second time since late September the price tested the 2025 high at 158.87; the weekly high was 158.95. USD/JPY has been moving sideways since 25 September, and at the end of October the Fed and the Bank of Japan meet in the same week.
USD/JPY forecast in 30 seconds
Next week
The area around 159 yen is holding the price back. The 2025 high at 158.87 has been tested twice.
Short term
USD/JPY has been moving sideways since 25 September. A sell signal arises below 157.54, last week's low.
Long term
A resistance cluster has formed around 160 yen. It comes from the yearly highs of 1990, 2024 and 2025.
Dates
The Fed and the Bank of Japan meet in the same week. The Fed decides on 28 October, the Bank of Japan on 30 October.
On this page
- USD/JPY forecast in 30 seconds
- USD/JPY forecast for the week of 19 October 2026: resistance around 159 yen
- USD/JPY forecast for the coming days: sell signal below 157.54
- 4-hour chart: sideways since 25 September
- What can move USD/JPY next: three dates
- Three scenarios: which level decides
- USD/JPY forecast long term: resistance cluster around 160 yen
- Yearly chart since 1971: three yearly highs around 160 yen
- USD/JPY forecast 2026: what the banks expect
- USD/JPY forecast 2027 and 2028: what the banks expect
- USD/JPY forecast 2030: what purchasing power parity says
- Why is the yen so weak?
- Yen intervention: how Japan supports its currency
- How this forecast is made
- Conclusion: USD/JPY sideways below resistance around 159 yen
- Frequently asked questions
- Please note
USD/JPY forecast for the week of 19 October 2026: resistance around 159 yen
 Click to enlarge
All charts on this page are by Karsten Kagels, with FXCM prices. They were exported on Sunday, 18 October 2026, between 12:12 and 13:35 CEST. The currency market was closed, so every chart shows Friday's close on 16 October 2026 at 157.98.
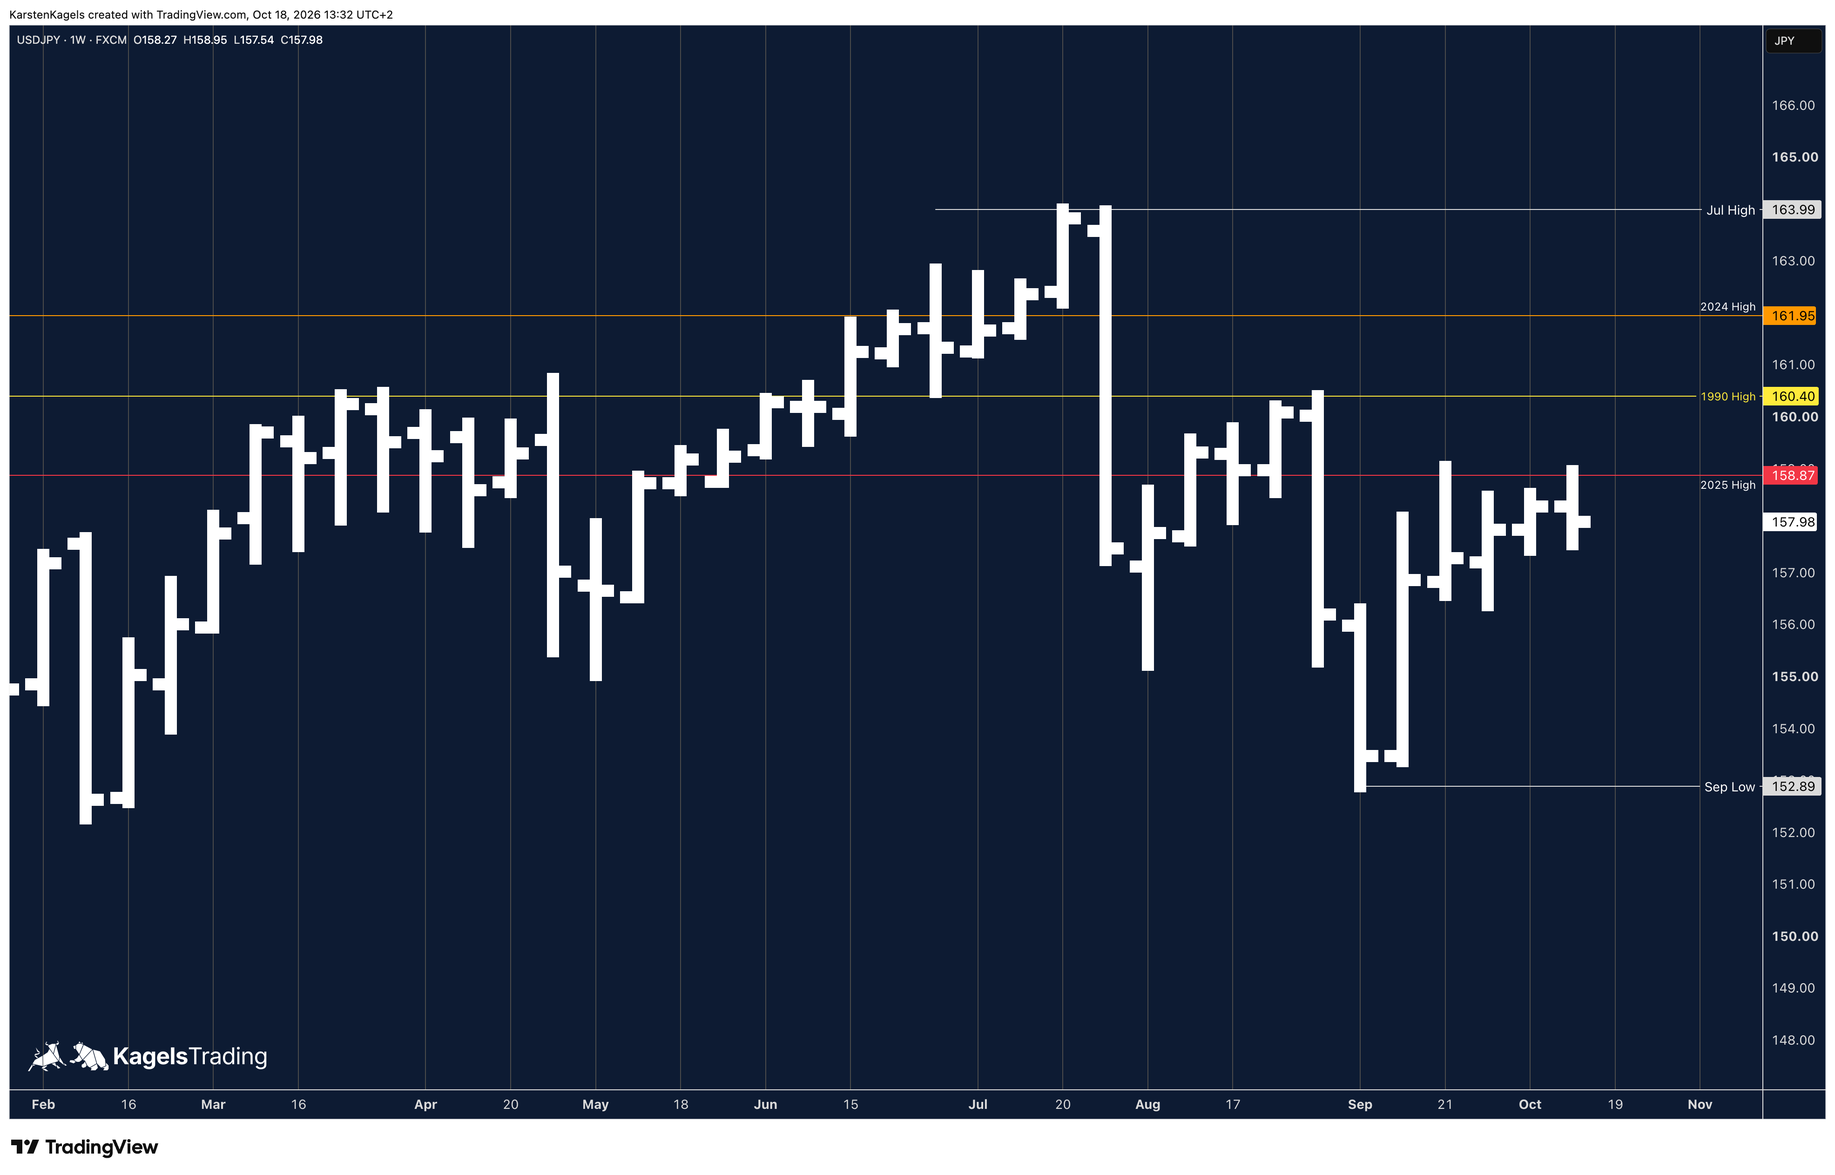
The weekly chart shows a three-part correction from the 2026 high. It ran from the July high at 163.99 to the September low at 152.89. A recovery followed in recent weeks and tested the 2025 high at 158.87 twice: at the end of September and last week.
Last week's high was 158.95, just above the 2025 high. USD/JPY closed below it, at 157.98, and the weekly low was 157.54. The next resistance levels are the 1990 high at 160.40 and the 2024 high at 161.95.
The levels for next week, from top to bottom: the 2026 high at 163.99, the 2024 high at 161.95, the 1990 high at 160.40, the weekly high at 158.95 and the 2025 high at 158.87 as resistance; the weekly low at 157.54, the October low at 156.94, the September low at 152.89 and the 2026 low at 152.09 as support.
Resistance
- 163.99
- 161.95
- 160.40
- 158.95
- 158.87
Price at analysis157.98
Support
- 157.54
- 156.94
- 152.89
- 152.09
USD/JPY forecast for the coming days: sell signal below 157.54
 Click to enlarge
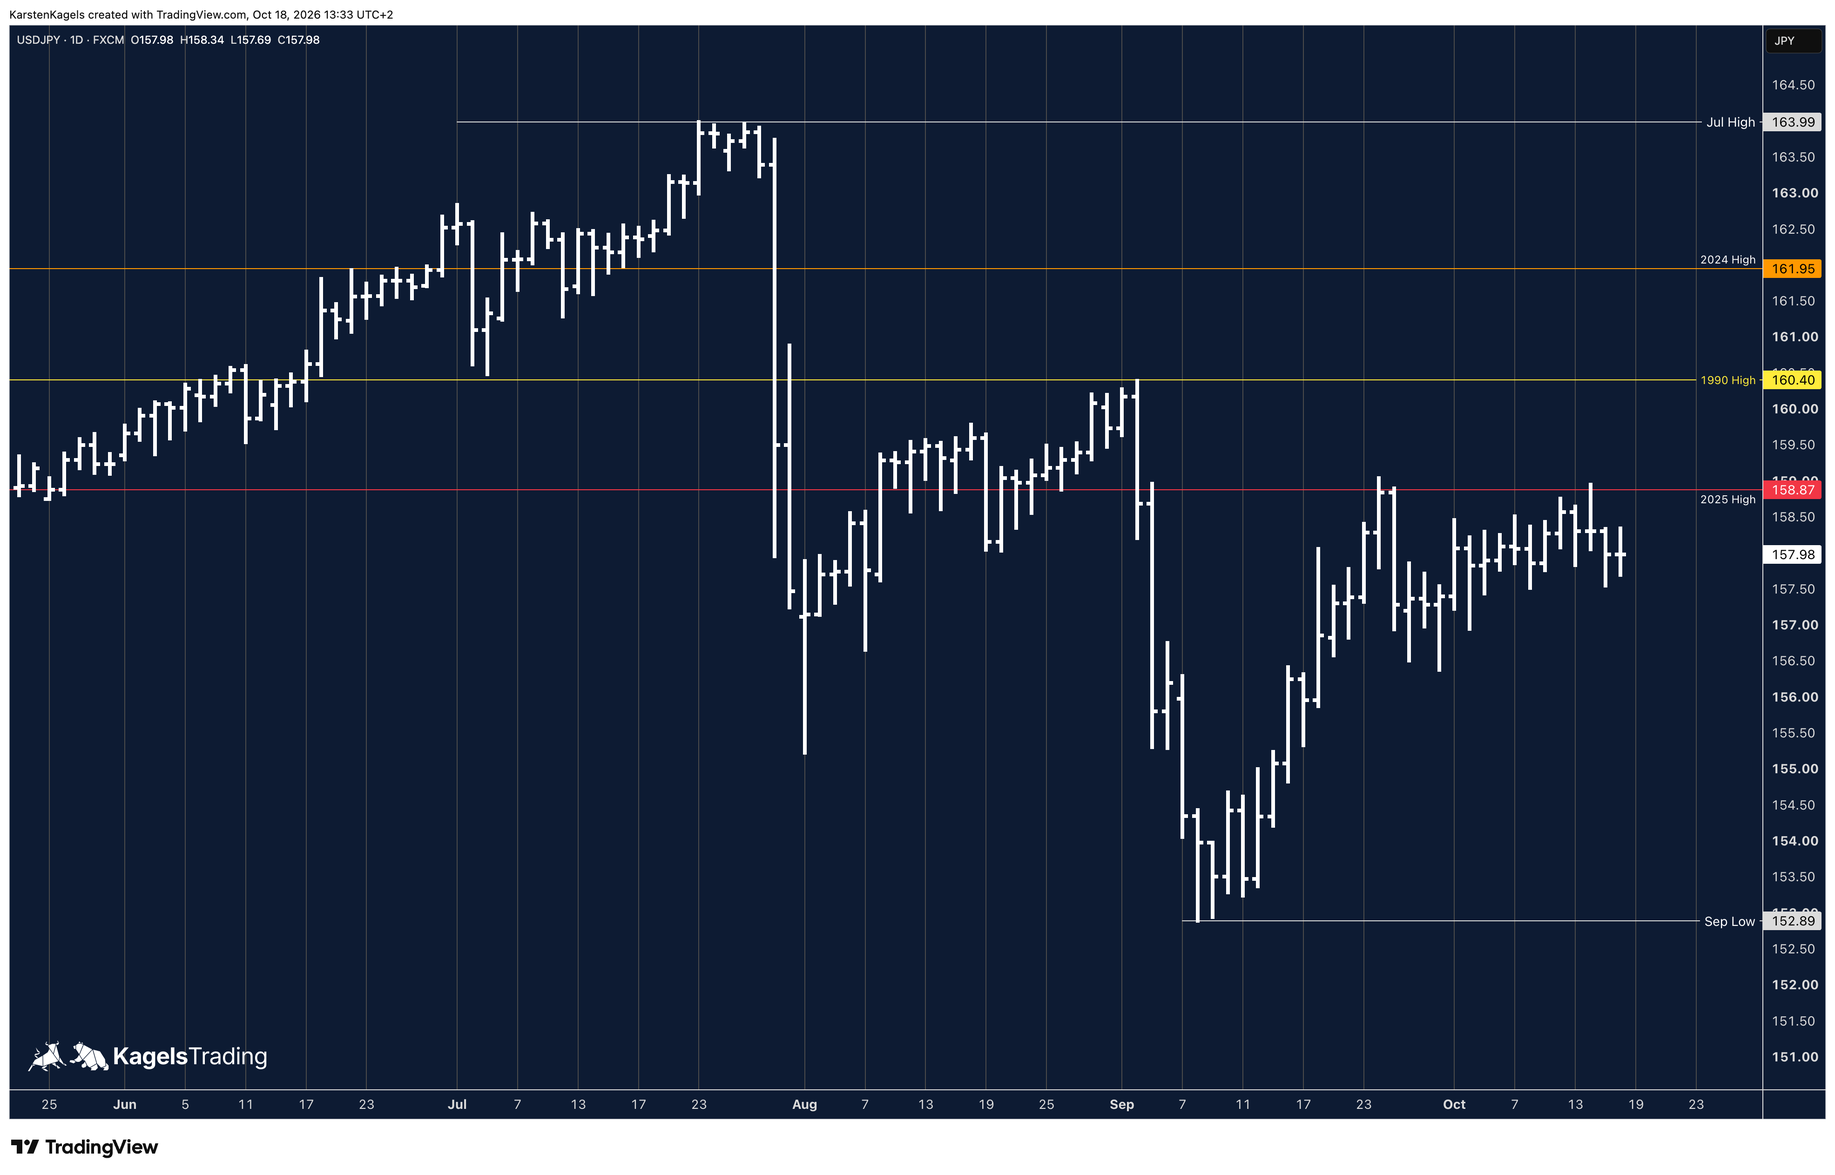
On the daily chart it is even clearer that the area around 159 yen has become important resistance. That is where the 2025 high at 158.87 lies. At the end of September and on 14 October, USD/JPY rose just above it and fell back below it each time.
Resistance
- 163.99
- 161.95
- 160.40
- 158.87
Support
- 152.89
4-hour chart: sideways since 25 September
 Click to enlarge
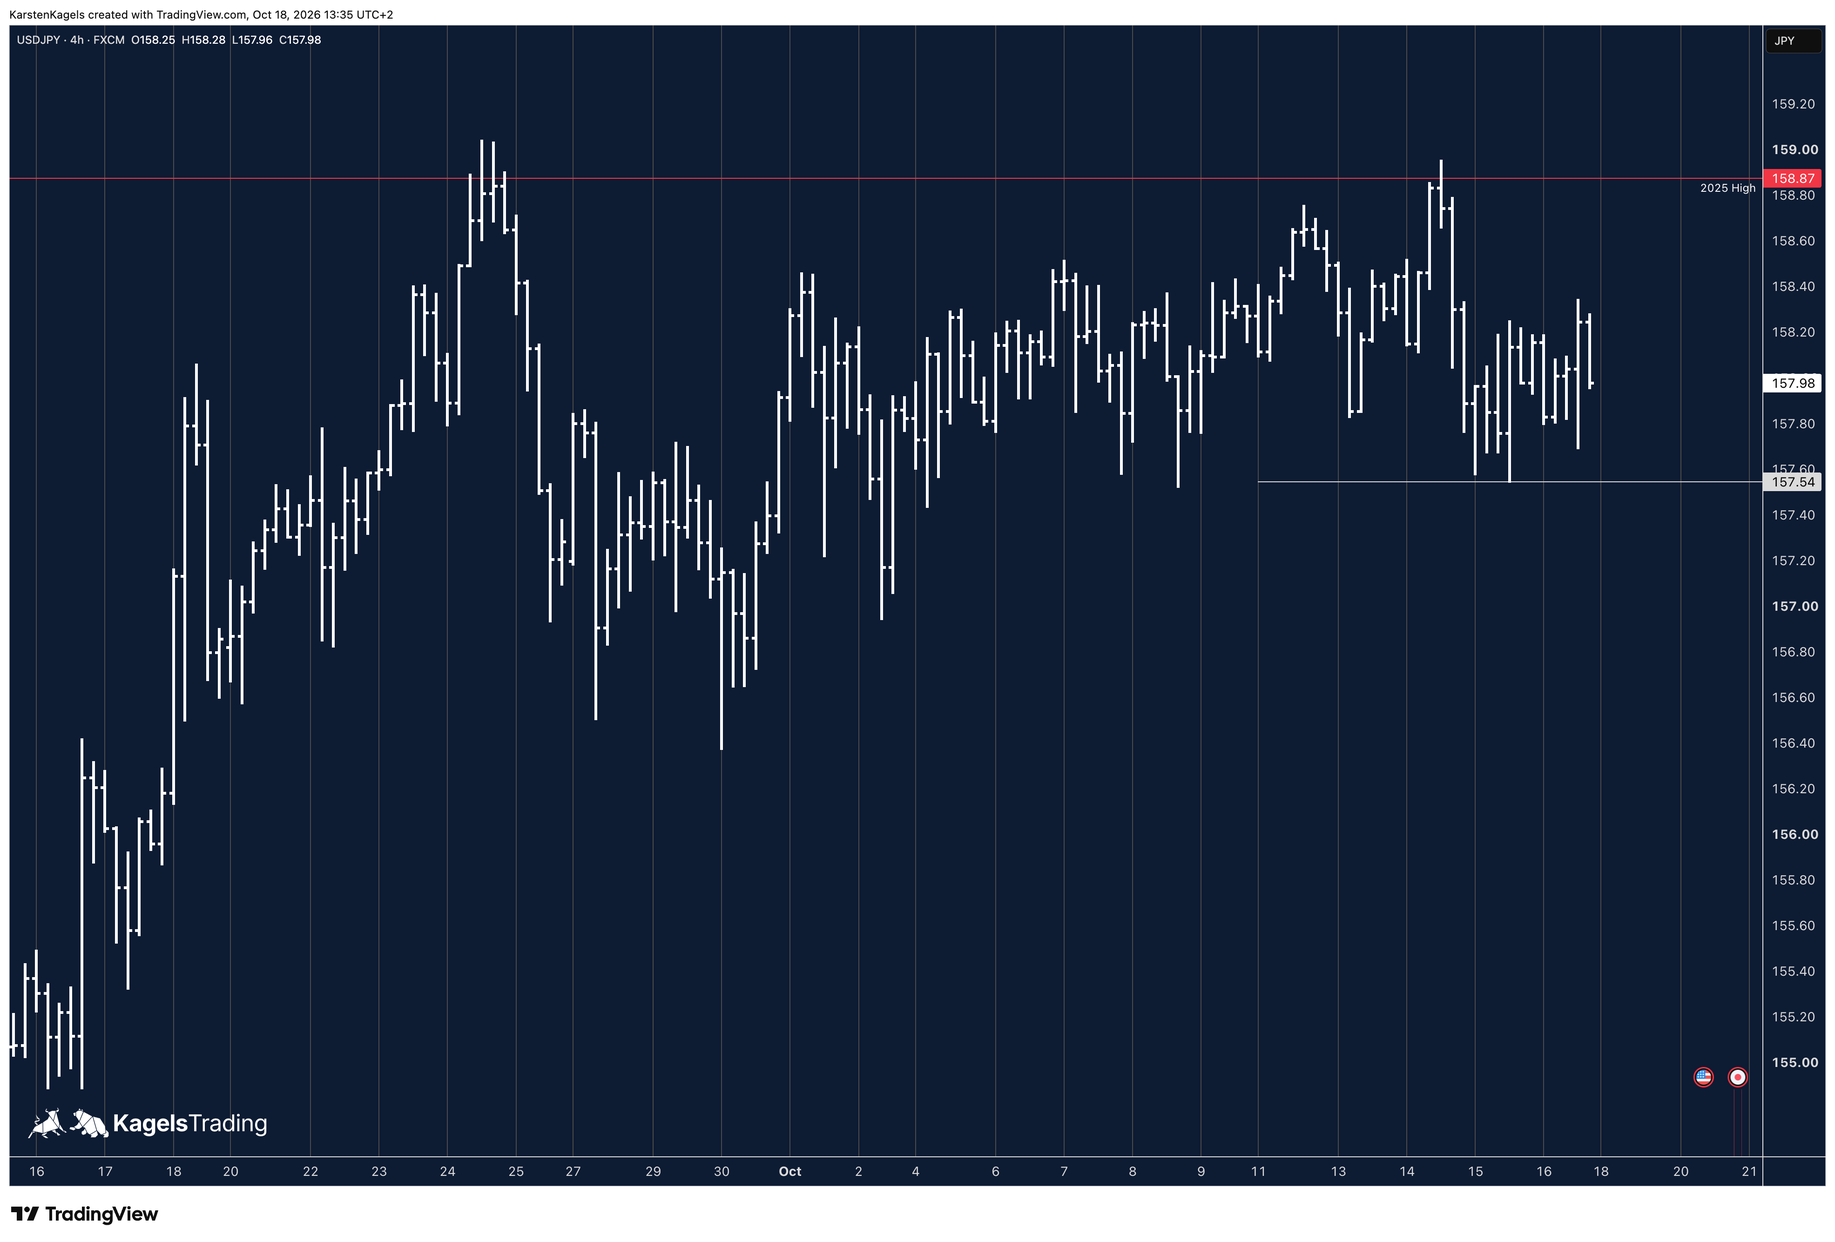
The 4-hour chart shows the sideways move since 25 September very clearly. A sell signal arises if last week's low at 157.54 is broken. The 2025 high at 158.87 lies within the resistance area around 159 yen.
Resistance
- 158.87
Support
- 157.54
What can move USD/JPY next: three dates
US inflation carried USD/JPY to the resistance last week. US consumer prices for September rose 3.7 percent year on year according to CNBC, against an expected 3.6 percent. Afterwards the price reached the weekly high at 158.95 on 14 October but closed the week below it.
Three dates are coming up in the next few weeks. They are reasons to read the chart again, not a forecast of a particular reaction. US release times are Eastern Time, with central European time in brackets.
28 October, usually 2:00 p.m. ET (19:00 CET): Fed rate decision after the meeting of 27 and 28 October (FOMC calendar).
30 October: Bank of Japan rate decision after the meeting of 29 and 30 October, with the key points of the Outlook Report (BoJ calendar).
6 November, 8:30 a.m. ET (14:30 CET): US employment report for October (BLS schedule).
The Fed and the Bank of Japan meet in the same week. More on the US central bank is in our article on the Fed rate decision, and the yen against the euro is covered in the EUR/JPY forecast.
Three scenarios: which level decides
The only signal level in Karsten's charts is below the price, at 157.54. Above, there is resistance around 159 and 160 yen. These are reference levels, not order rules, and the chart needs a fresh look after every week.
Bullish: resistance around 159 and 160 yen
To the upside, USD/JPY first has to overcome the area around 159 yen. Above it lies the resistance cluster around 160 yen with the 1990 high at 160.40 and the 2024 high at 161.95, then the 2026 high at 163.99. The charts currently show no signal level for rising prices.
Wait: sideways since 25 September
USD/JPY has been moving sideways since 25 September. The only signal in Karsten's charts is a sell signal below last week's low at 157.54. Until then, in this sideways phase, no signal is also a result.
Bearish: sell signal below 157.54
A sell signal arises if last week's low at 157.54 is broken. That is what Karsten's 4-hour chart shows. As reference levels below, the charts show the October low at 156.94, the September low at 152.89 and the 2026 low at 152.09.
Resistance
- 163.99
- 161.95
- 160.40
- 158.87
Support
- 157.54
- 156.94
- 152.89
- 152.09
USD/JPY forecast long term: resistance cluster around 160 yen
 Click to enlarge
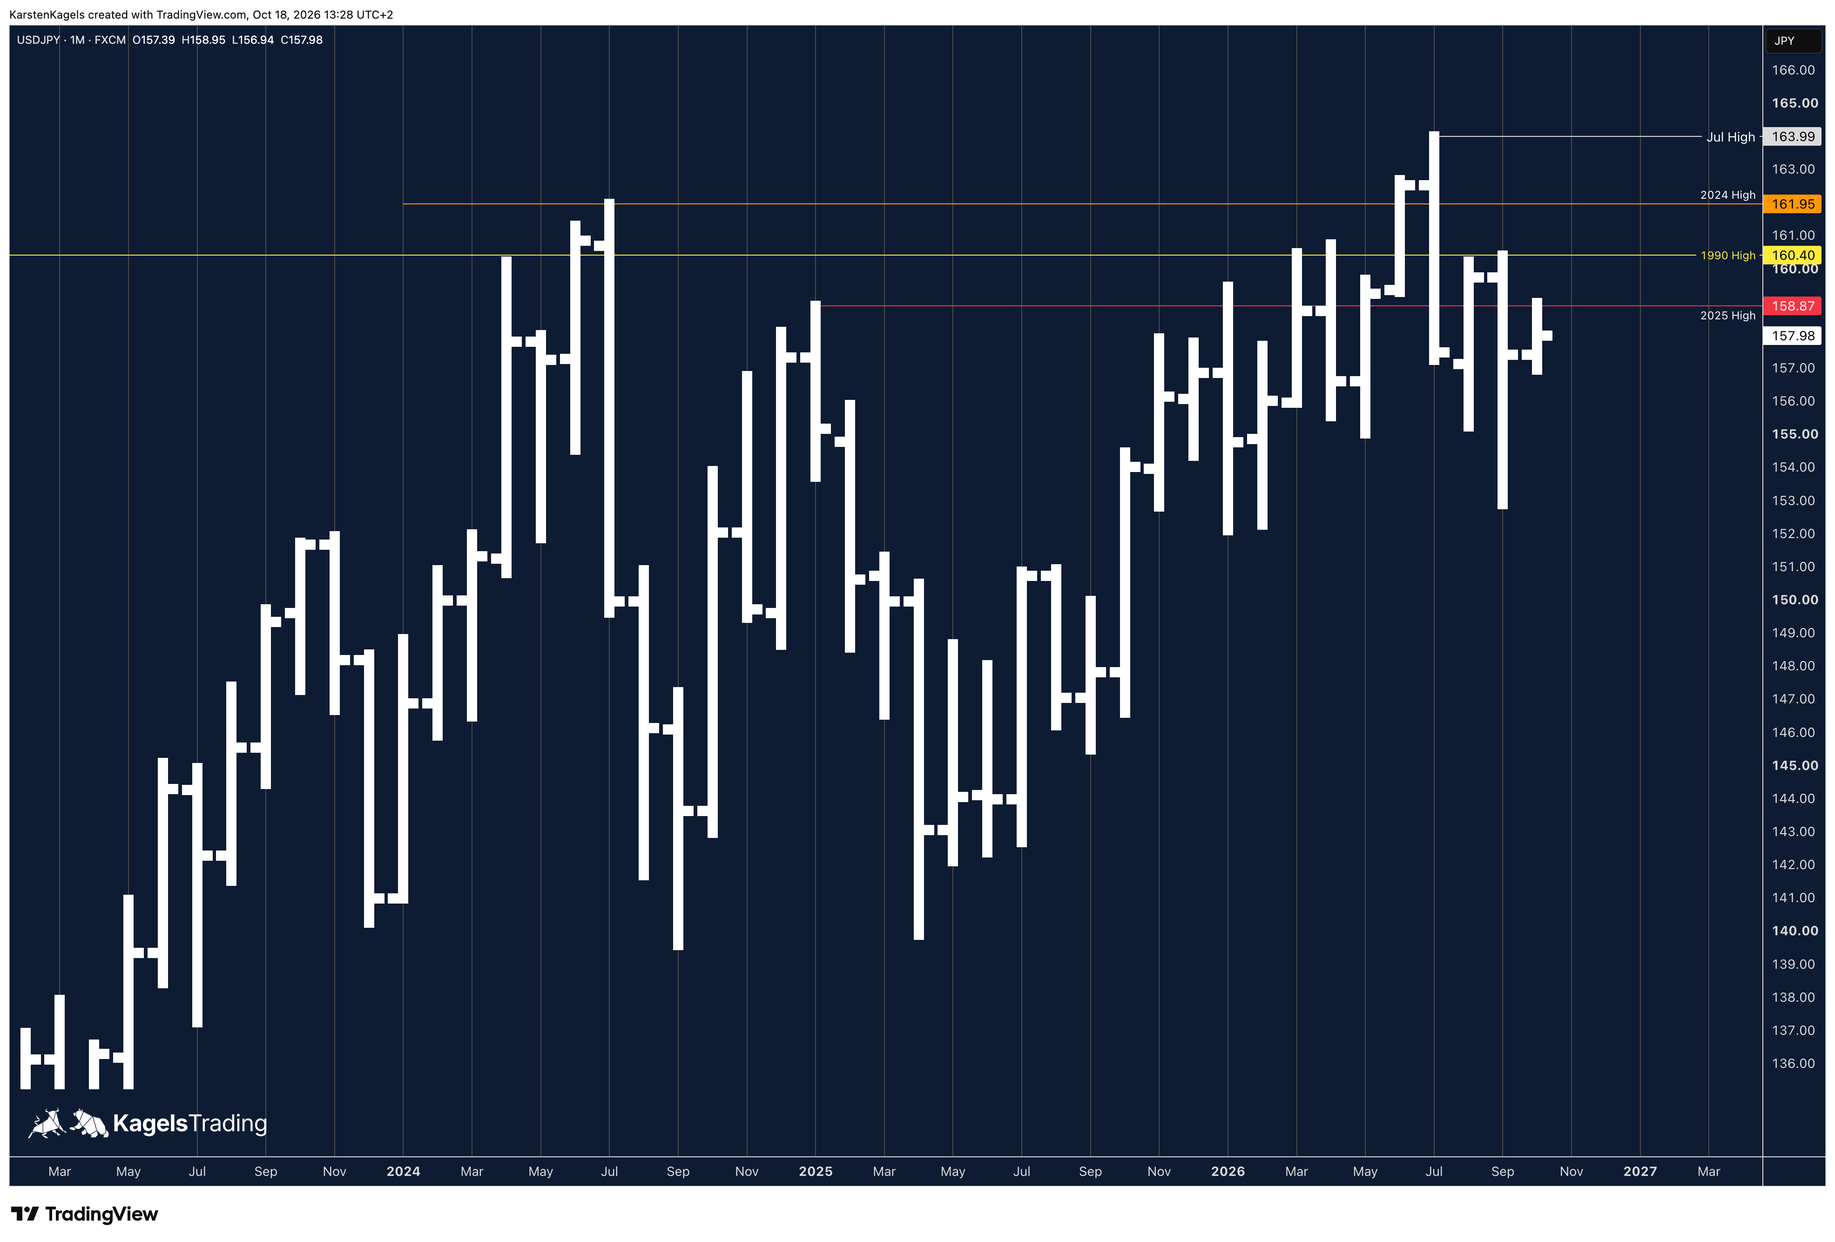
From the 2026 high, USD/JPY has corrected sharply over the last three months. The monthly chart shows it: after the July high at 163.99 the price fell to 152.89 by September. In October it tested the previous year's high, the 2025 high at 158.87.
Resistance
- 163.99
- 161.95
- 160.40
- 158.87
Support
- 156.94
- 152.89
Yearly chart since 1971: three yearly highs around 160 yen
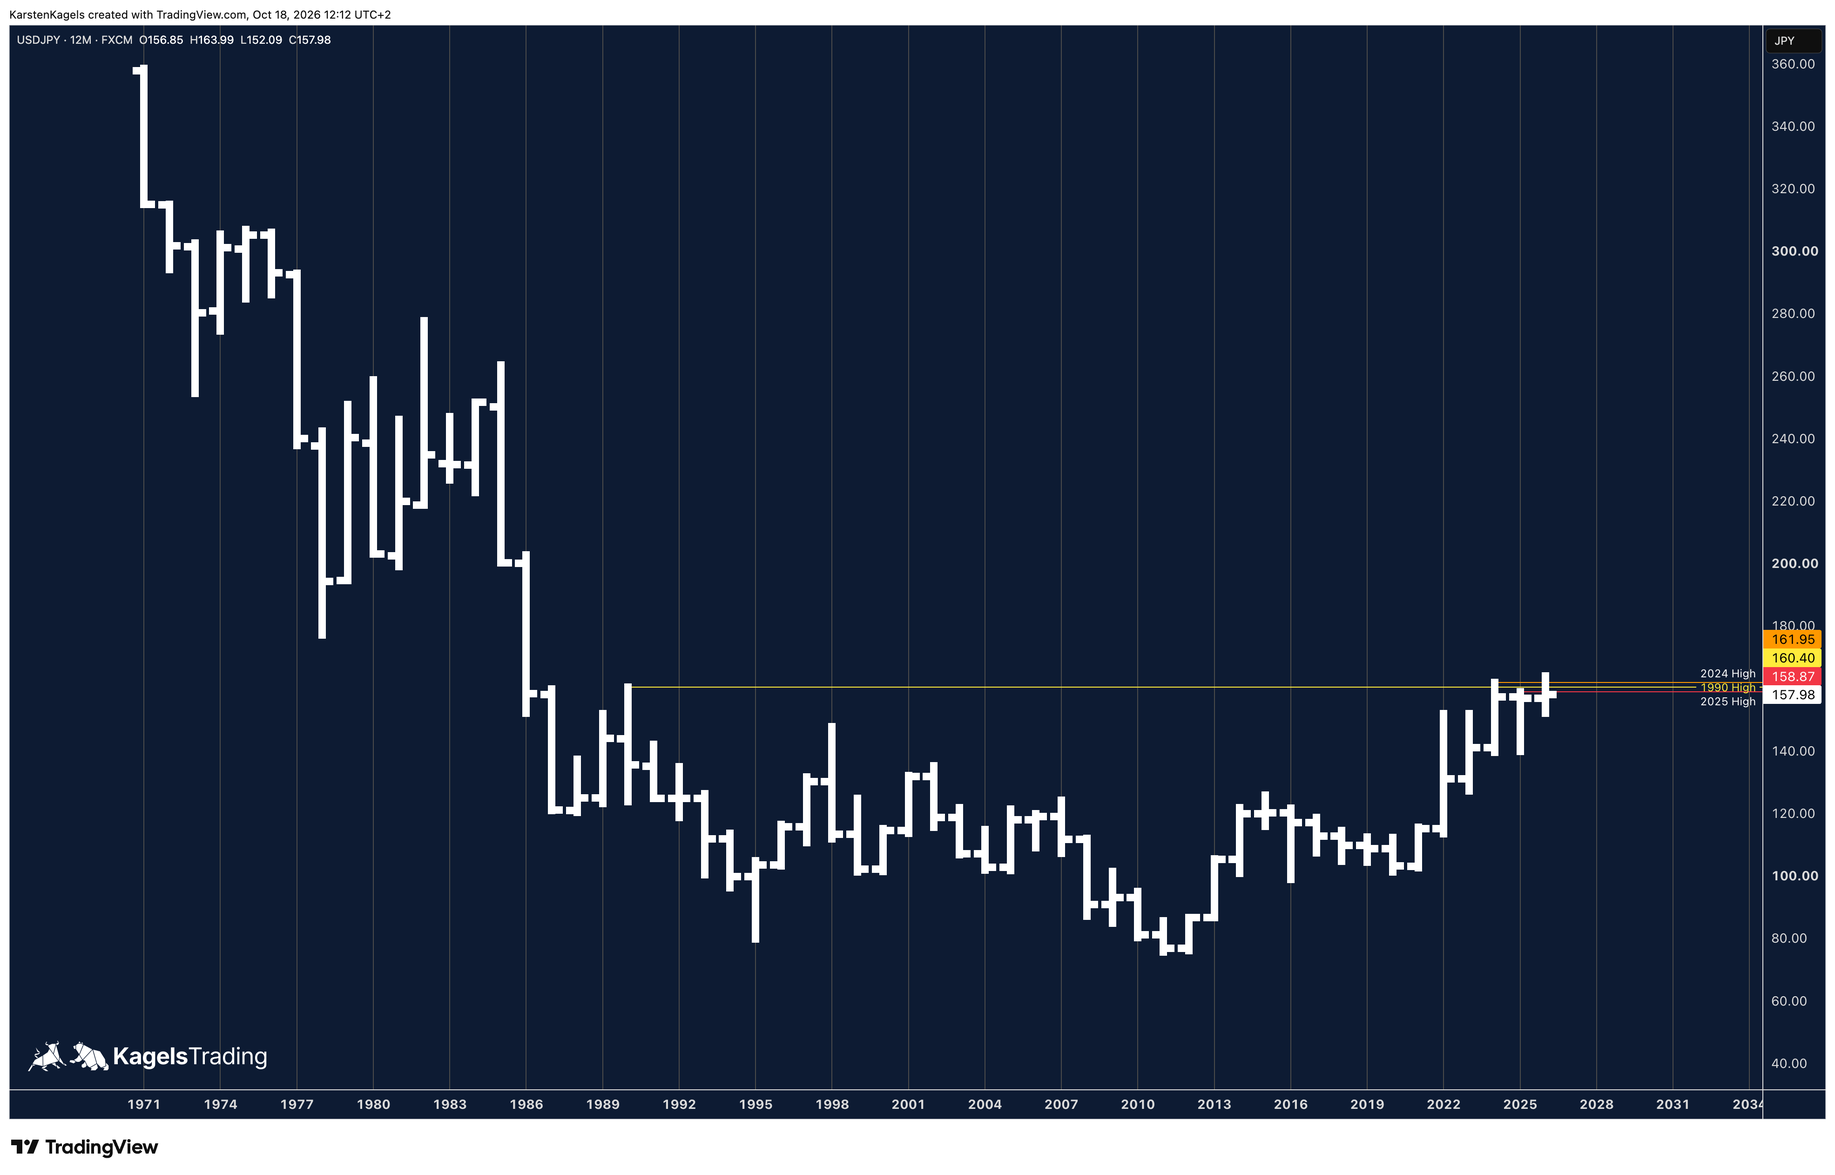 Click to enlarge
The very long-term yearly chart puts these levels in context. The yearly highs of 1990 (160.40), 2024 (161.95) and 2025 (158.87) all lie in the current price area. Together they form a strong resistance cluster around 160 yen.
Resistance
- 163.99
- 161.95
- 160.40
- 158.87
Support
- 152.89
- 152.09
USD/JPY forecast 2026: what the banks expect
Most banks expect USD/JPY to fall slowly. The Bloomberg consensus stood at 156 yen for the end of 2026 and 150.5 yen for the end of September 2027 in early October. That is how the Japanese bank MUFG quotes it in its currency outlook of 1 October 2026. MUFG itself expects 155 yen at the end of 2026 and 149 yen at the end of September 2027.
| Bank | Forecast | Horizon |
|---|---|---|
| MUFG | 155 / 149 | end of 2026 / Sept 2027 |
| Crédit Agricole | 156 / 150 | Q4 2026 average / Q4 2027 |
| UBS | 160 / 158 | Dec 2026 / Sept 2027 |
| Goldman Sachs | 150 | about Oct 2027 |
| Rabobank | 155 | about Jan 2027 |
Forecasts revised from late September 2026, as reported up to 10 October 2026; MUFG from its own outlook, the others as reported by Exchange Rates UK and FXStreet (links in the text).
Some banks cut their targets at the end of September. According to Exchange Rates UK, Goldman Sachs names 150 yen in twelve months (report of 10 October 2026), and Crédit Agricole expects an average of 156 yen in the fourth quarter, pointing to possible shifts of capital (report of 2 October 2026). Rabobank sees 155 yen in three months (6 October 2026), according to FXStreet. MUFG bases its targets on changed rate expectations.
UBS is the main exception to the upside. According to Exchange Rates UK, the Swiss bank sees the dollar at 160 yen at the end of 2026 and slightly lower in 2027 (forecast of 29 September 2026). The range of forecasts is wide, and bank forecasts are third-party assessments, not a trading recommendation.
USD/JPY forecast 2027 and 2028: what the banks expect
For different points in 2027, the banks selected here name values from about 145 to 158 yen. UBS expects 158 yen for September 2027, Goldman Sachs 150 yen for about October 2027 and Crédit Agricole 150 yen for the fourth quarter of 2027. In July, Commerzbank saw a path towards 145 yen by the end of 2027, a forecast made before the Fed’s rate rise in September (FXStreet).
For 2028 we found only one documented forecast. According to Exchange Rates UK, the Australian bank Westpac names 146 yen for the end of 2028, as of 2 September 2026. Westpac assumed a Fed rate of 3.625 percent; the Fed has since raised its target range to 3.75 to 4.00 percent. It is a dated forecast value from a single bank, not a reliable prediction.
Karsten’s charts show the current situation, not a forecast for a particular year. On the yearly chart, the yearly highs of 1990, 2024 and 2025 all lie in the current price area and form a strong resistance cluster around 160 yen.
USD/JPY forecast 2030: what purchasing power parity says
Purchasing power parity is the exchange rate at which goods cost the same in two countries.
In the sources checked for this article we found no reliable bank forecast for 2030. There are valuation yardsticks. In its World Economic Outlook of October 2026, the International Monetary Fund puts purchasing power parity for Japan at 93.7 yen per international dollar in 2030, and at 94.1 for 2026. Compared with the 2026 value of 94.1, the yen is clearly undervalued at the current rate of just under 158.
No price target follows from this. Exchange rates can drift away from purchasing power parity for decades; it is an equilibrium value, not a timetable.
Why is the yen so weak?
The rate gap is the distance between the policy rates of two currency areas. The wider it is, the more attractive the higher-yielding currency becomes for investors.
The main reason for the yen’s weakness is the rate gap to the United States. The Bank of Japan raised its policy rate to 1.25 percent on 18 September, effective 24 September. The Fed raised its target range to 3.75 to 4.00 percent on 16 September, effective 17 September. The gap is therefore about 2.6 percentage points, using the midpoint of the Fed range.
The dollar’s rate lead favours carry trades and can weigh on the yen. Investors borrow in yen and invest the money at higher rates; that is the carry trade. How the yen reacted to the Bank of Japan’s rate steps is in our article on the BoJ rate decision; market expectations for the Fed can be followed with the CME FedWatch Tool.
Yen intervention: how Japan supports its currency
In a currency intervention the Japanese Ministry of Finance buys yen in the market and sells dollars for it, to support its own currency.
Japan intervened in two major rounds in 2026. Between 28 April and 27 May it spent 11.73 trillion yen; for the reporting period from 30 July to 26 August the Ministry of Finance reported another 15.40 trillion yen. On 31 July Japan bought yen together with the US Treasury. According to FXStreet, both rounds followed moves above 160 yen.
After that, Japan reported no further intervention, but it warned again. For 27 August to 28 September the ministry reported no intervention; there is no official monthly report yet for the period after that. On 15 October, Finance Minister Satsuki Katayama said, according to The Japan Times, that Japan was ready to step into the currency market again if needed.
For traders that means: interventions can cause sharp price jumps and slippage. Slippage means an order is filled at a different price than expected. Stop distance and position size should fit a predefined loss limit, and staying out of the trade is also an option.
How this forecast is made
The charts are my own, with FXCM price data, from the 4-hour to the yearly chart. Each shows the highs and lows of earlier years that matter for its horizon. How such levels work is explained in our guide to support and resistance. The charts were made with TradingView, and this page follows our editorial policy. For the dollar against the euro, see our EUR/USD forecast. The other safe-haven currency is covered in the USD/CHF forecast.
Conclusion: USD/JPY sideways below resistance around 159 yen
As an active trader since 1980, I see USD/JPY in a sideways phase below strong resistance. After the three-part correction from the 2026 high to the September low, the price recovered and tested the 2025 high at 158.87 twice. It has been moving sideways since 25 September.
In the short term, last week’s low at 157.54 decides. Below it, a sell signal would arise. To the upside, the first resistance is around 159 yen, and in the long term the resistance cluster around 160 yen from the yearly highs of 1990, 2024 and 2025.
Frequently asked questions
Will USD/JPY rise or fall?
That is an open question at the moment. USD/JPY has been moving sideways since 25 September. A sell signal arises below last week’s low at 157.54. To the upside, the area around 159 yen with the 2025 high at 158.87 holds the price back, and above it follows the resistance cluster around 160 yen.
Will the yen rise again?
The yen rises when USD/JPY falls. According to Karsten’s 4-hour chart, a sell signal for USD/JPY arises below last week’s low at 157.54. As reference levels below, the charts show the October low at 156.94 and the September low at 152.89. Most of the banks named here expect USD/JPY to fall by 2027, which means a somewhat stronger yen.
What does USD/JPY mean?
USD/JPY is the currency pair US dollar against Japanese yen. The rate shows how many yen one US dollar costs. A rate of 157.98 means that one dollar costs 157.98 yen. If the rate rises, the dollar becomes more expensive and the yen weaker.
What is the forecast for the yen in 2026?
For the end of 2026, the Bloomberg consensus cited by MUFG stood at 156 yen per dollar in early October. The individual forecasts range from 155 yen (MUFG) to 160 yen (UBS). These are point targets for the end of the year, not a trading range.
What does a yen intervention mean for traders?
In a currency intervention the Japanese Ministry of Finance buys yen in the market to support the currency. In 2026 that happened in two rounds, both after moves above 160 yen. Such steps can cause sharp moves within minutes and slippage. Stop distance and position size should therefore fit a predefined loss limit.
When do the Fed and the Bank of Japan meet?
The Fed decides on 28 October 2026, after its meeting of 27 and 28 October. The Bank of Japan decides on 30 October 2026, after its meeting of 29 and 30 October. On 30 October the BoJ also publishes the key points of its Outlook Report; the full report follows on the next business day.
Please note
The scenarios are a personal assessment based on experience. They summarize possible price developments for each time frame and are not a certainty. This is market analysis, not investment advice. Keep your position sizes in line with your own risk management.
This forecast is translated from the German edition on kagels-trading.de.
How our forecasts are made and reviewed: How we work.