
USD/CAD Forecast: US Dollar to Canadian Dollar Outlook
USD/CAD forecast in 30 seconds
Today
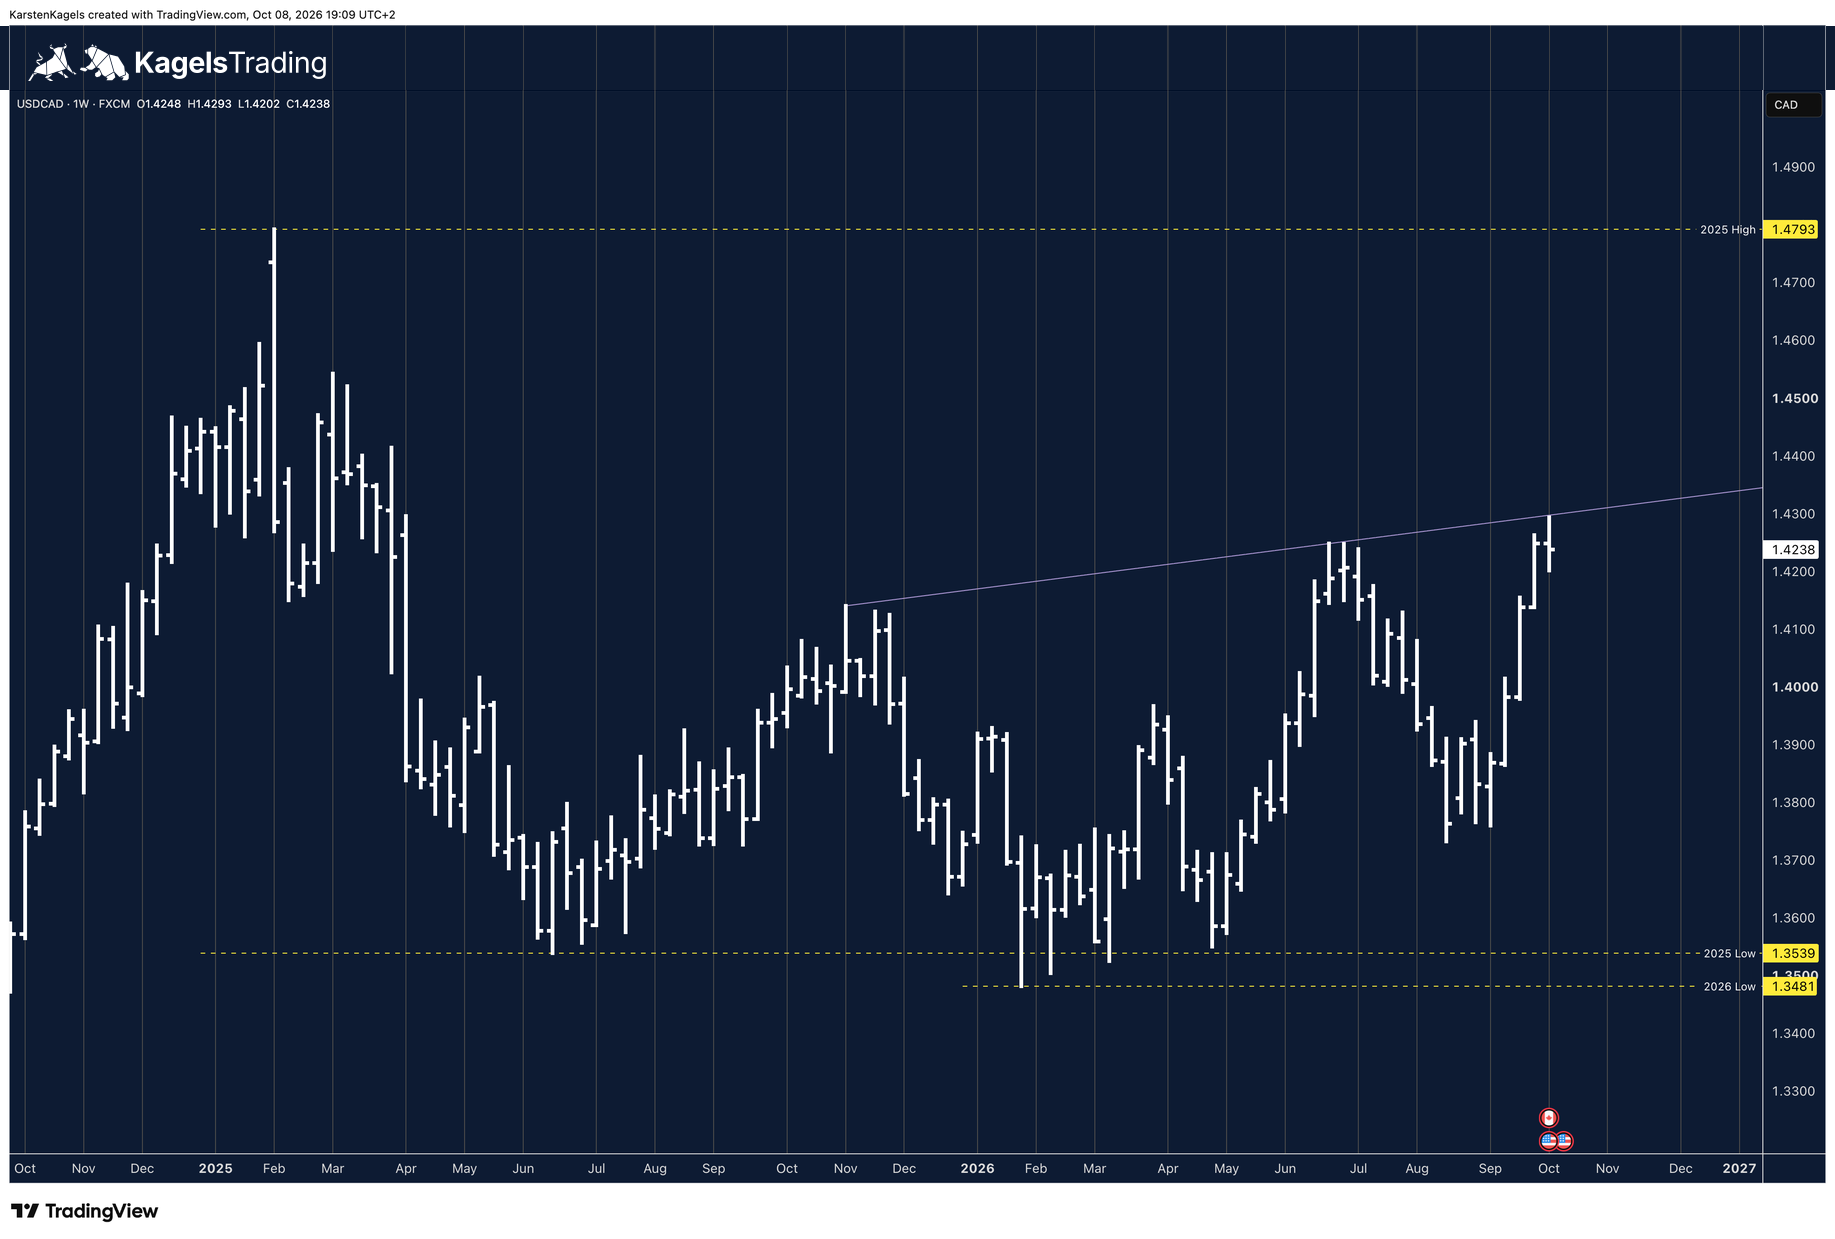
1.4234 at 19:13 CEST on 8 October 2026. After a four-week rally, USD/CAD has almost reached the possible diagonal resistance line (purple). On the yearly chart from 19:13 the 2026 high so far is 1.4294.
Medium term
The uptrend is intact. After the strong rise, a technical reaction may come first; how far it could go is open.
Long term
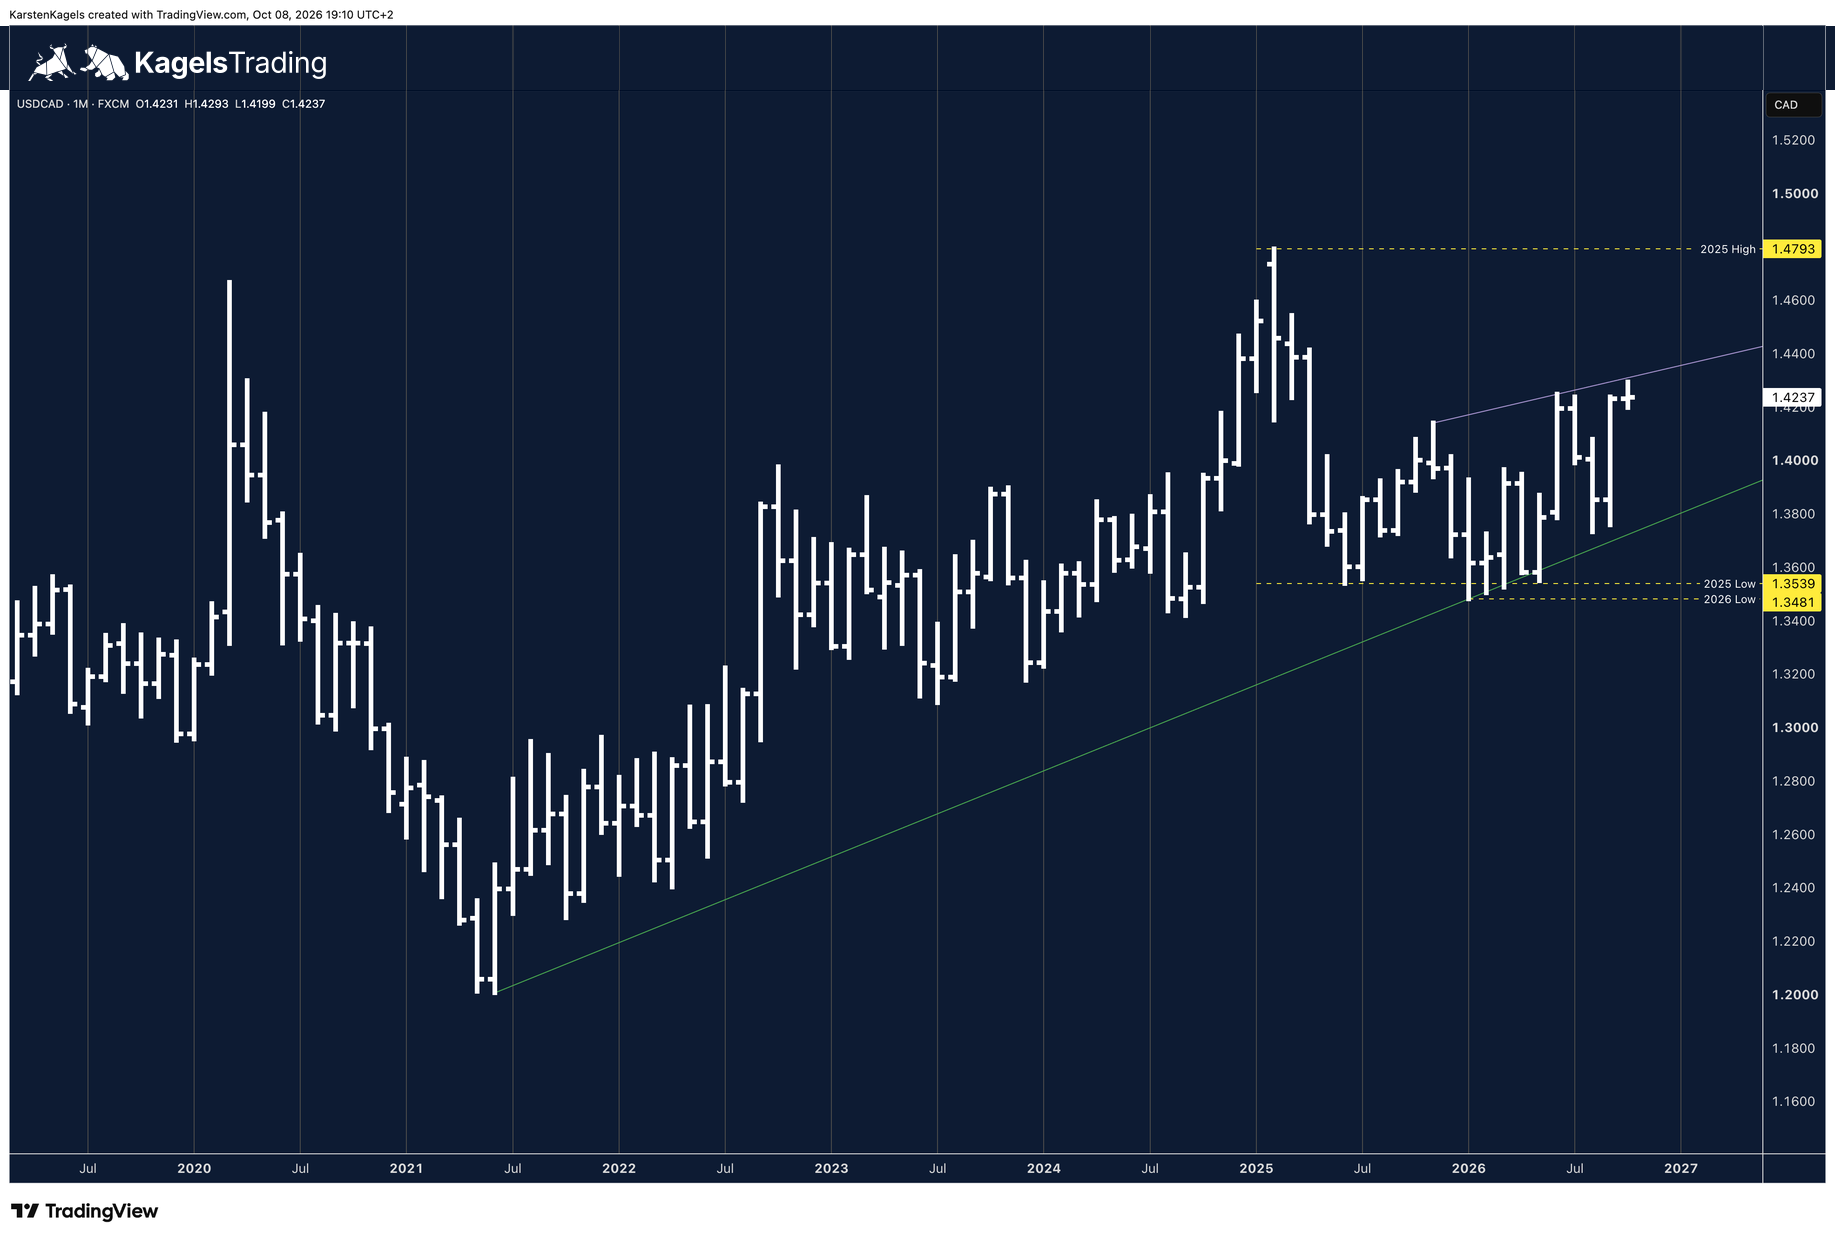
On the monthly chart, an uptrend line confirmed several times (green) underpins the long-term uptrend.
Very long term
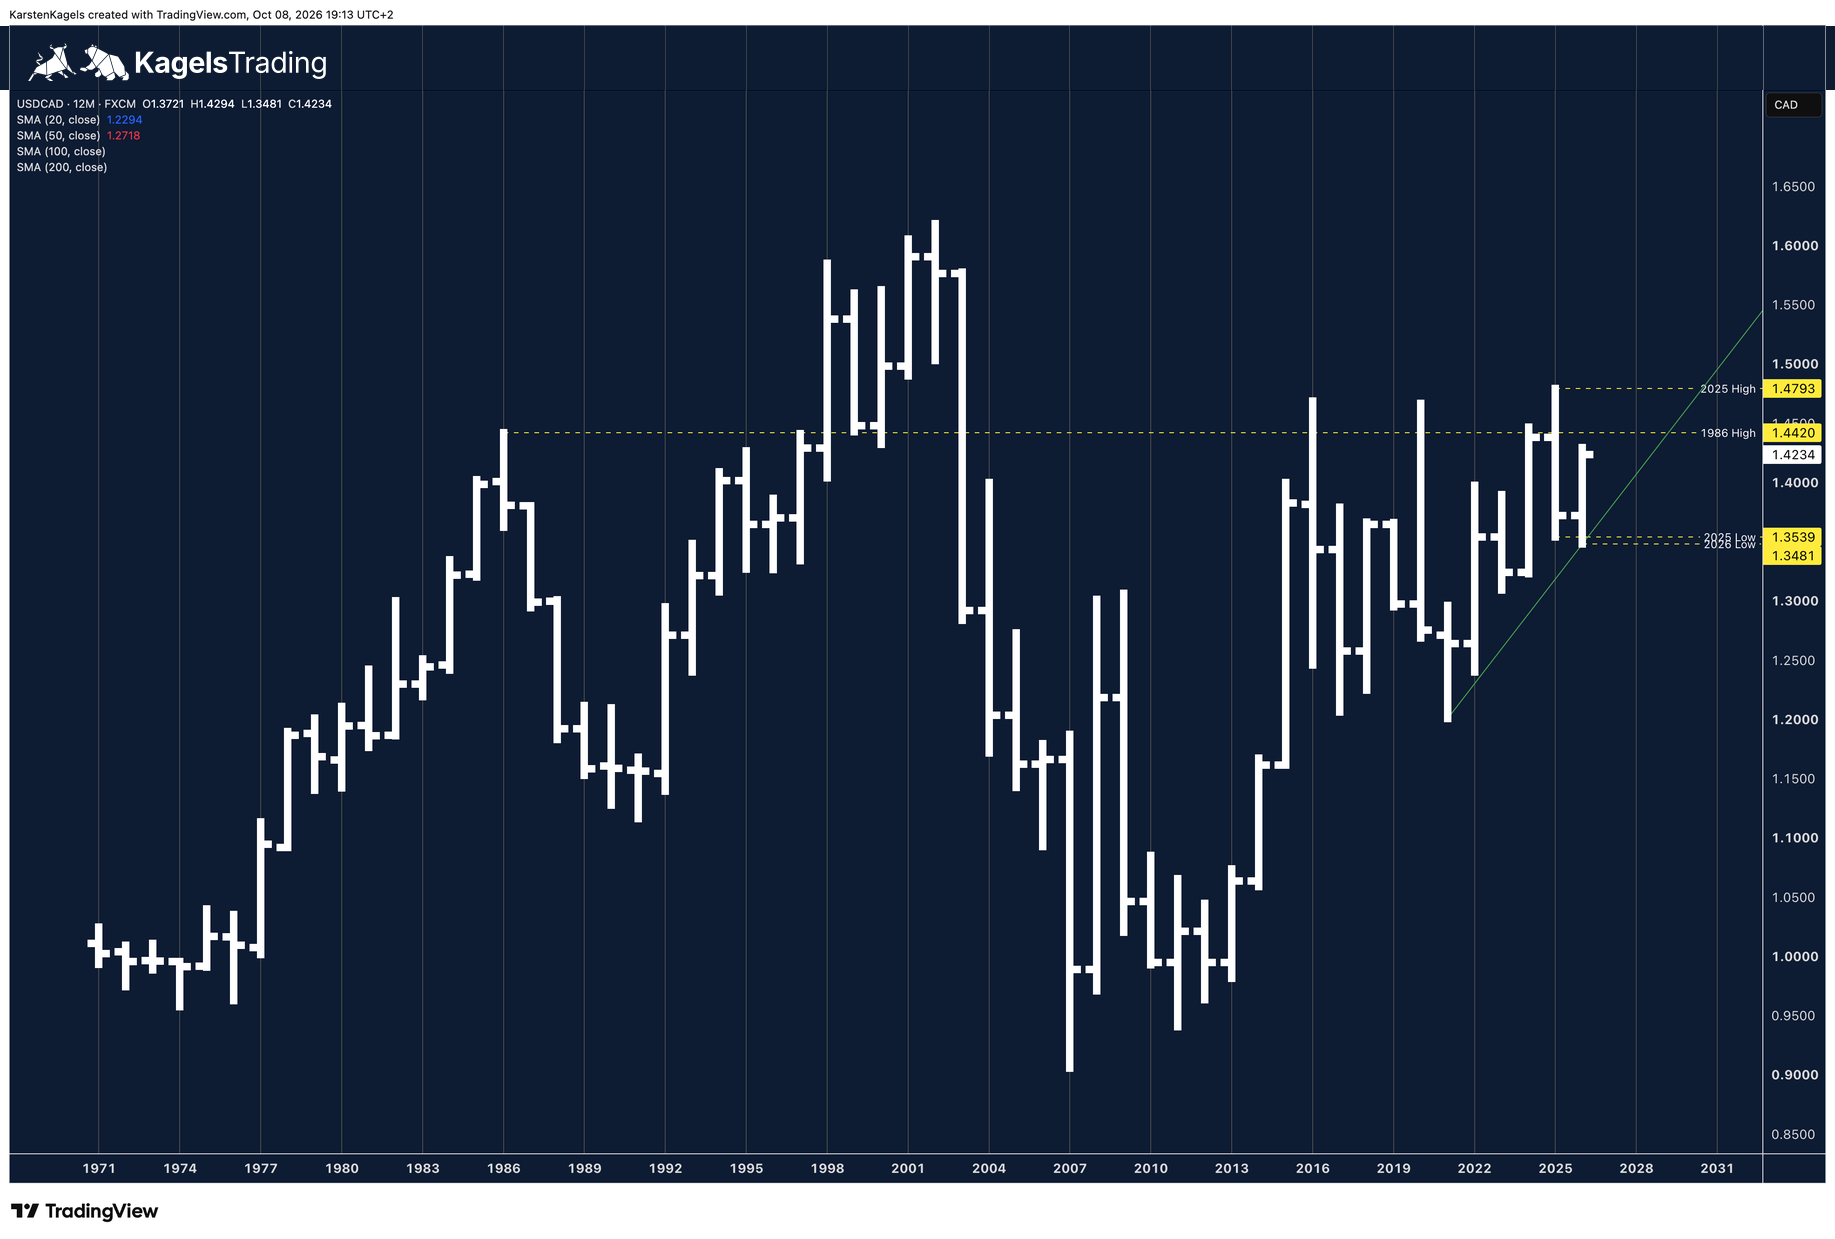
Karsten sees a strong resistance zone between 1.44 and 1.48. It holds the 1986 high at 1.4420 and the 2025 high at 1.4793. Over the long term, the US dollar could rise further.
On this page
- USD/CAD forecast in 30 seconds
- USD/CAD forecast, medium term: four-week rally, uptrend intact
- USD/CAD forecast, long term: the uptrend line on the monthly chart
- USD/CAD forecast, super long term: the resistance zone 1.44 to 1.48
- USD/CAD forecast for the coming weeks: three paths
- What can move USD/CAD next
- How this forecast is made
- Conclusion: assessment by Karsten Kagels
- Frequently asked questions
- Please note
USD/CAD forecast, medium term: four-week rally, uptrend intact
For Thursday, 8 October 2026
 Click to enlarge
All charts on this page are by Karsten Kagels, with FXCM prices. USD/CAD shows how many Canadian dollars one US dollar buys. The charts were exported on 8 October 2026 between 19:09 and 19:13 CEST (1.4234 to 1.4238). The key points use the latest reading from 19:13, 1.4234; each chart section names its own export.
After a four-week rally, USD/CAD has almost reached a possible diagonal resistance line this week. It is drawn in purple on the chart. This week opened at 1.4248, rose to 1.4293 and fell to 1.4202; at 19:09 CEST USD/CAD stood at 1.4238.
In principle, the uptrend is intact. It remains to be seen whether a technical reaction to the strong rise of recent weeks comes first. That means a counter-move after a steep rise; how far it could go is open. The marked lows of 2025 and 2026 are much lower and are not a forecast for the next reaction.
Resistance
- 1.4793
- 1.4293
Price at analysis1.4234
Support
- 1.3539
- 1.3481
USD/CAD forecast, long term: the uptrend line on the monthly chart
For Thursday, 8 October 2026
 Click to enlarge
On the monthly chart we see the long-term uptrend, underpinned by an uptrend line confirmed several times. It is drawn in green. The chart also shows the purple line from the weekly chart and the highs and lows of 2025 and 2026.
October opened at 1.4231. The monthly high so far is 1.4293 and the monthly low 1.4199; at 19:10 CEST USD/CAD stood at 1.4237. The 2025 high at 1.4793 is about 560 pips higher.
Resistance
- 1.4793
Support
- 1.3539
- 1.3481
USD/CAD forecast, super long term: the resistance zone 1.44 to 1.48
For Thursday, 8 October 2026
 Click to enlarge
On the yearly chart, the 1986 high at 1.4420 stands out. It lies a little below the price peaks of recent years, which reach up to the 2025 high at 1.4793. The whole area between 1.44 and 1.48 can therefore be seen as strong resistance.
In principle, however, we are looking at an uptrend. From a long-term perspective, the US dollar could therefore rise further. USD/CAD opened 2026 at 1.3721, fell to the 2026 low at 1.3481 and most recently rose to the 2026 high so far at 1.4294. From 1.4234, the 1986 high is still 186 pips away.
Resistance
- 1.4793
- 1.4420
Support
- 1.3539
- 1.3481
USD/CAD forecast for the coming weeks: three paths
The base case is the intact uptrend; the next move is open. The price levels come from Karsten's charts; the weekly close condition is an editorial guide. These are reference levels, not order rules.
Higher: above the 2026 high
A weekly close above the 2026 high so far at 1.4294 would be an extra sign of strength. Above it lie the resistance levels 1.4420 (1986 high) and 1.4793 (2025 high), both in the zone between 1.44 and 1.48.
Technical reaction: a counter-move after the rally
After the rally, a counter-move may come first; how far it could go is open. Karsten currently rates the uptrend as intact in principle. The marked lows of 2025 and 2026 at 1.3539 and 1.3481 are much lower and are not a forecast for the next reaction.
Wait: below the 2026 high
Below the 2026 high so far, it is open whether the rise continues straight away. A technical reaction may come first instead. The dates below are the next reasons to read the chart again.
Resistance
- 1.4793
- 1.4420
- 1.4294
Support
- 1.3539
- 1.3481
What can move USD/CAD next
Four events are coming up in the next few weeks. They are reasons to read the chart again, not a forecast of a particular reaction. On 28 October both central banks decide on the same day. New tariffs and changes in trade relations can also move USD/CAD outside these fixed dates. Times are given in Eastern Time, with central European time in brackets.
- 9 October, 8:30 a.m. ET (14:30 CEST): Canadian Labour Force Survey for September (Statistics Canada)
- 14 October, 8:30 a.m. ET (14:30 CEST): US consumer prices for September (BLS schedule)
- 28 October, 9:45 a.m. ET (14:45 CET): Bank of Canada rate decision with a new Monetary Policy Report (BoC events)
- 28 October, 2:00 p.m. ET (19:00 CET): Fed rate decision after the meeting of 27 and 28 October (Fed October calendar)
US interest rates are higher than Canadian rates. The Fed raised its target range to 3.75 to 4.00 percent on 16 September 2026. The Bank of Canada has held its policy rate at 2.25 percent since 30 October 2025 and confirmed it for the seventh time in a row on 2 September 2026. Against the middle of the Fed range, the gap is about 1.6 percentage points. More in our articles on the Bank of Canada rate decision and the Fed rate decision.
The Canadian dollar is seen as a commodity currency. Canada is the largest oil supplier to the United States. A rising oil price therefore tends to support the Canadian dollar and push USD/CAD down. For oil itself, see our crude oil price forecast. The Australian dollar is also linked to commodity prices, see the AUD/USD forecast.
How this forecast is made
The charts are my own, with FXCM price data, from the weekly to the yearly chart. Each shows the trend lines and the highs and lows that matter for its horizon. How such levels work is explained in our guide to support and resistance. The charts were made with TradingView, and this page follows our editorial policy. How the same dollar trades against a safe haven is shown in the USD/CHF forecast.
Conclusion: assessment by Karsten Kagels
As an active trader since 1980, I see USD/CAD in an intact uptrend. The green uptrend line on the monthly chart, confirmed several times, underpins it, and after four weeks of gains the pair has almost reached the possible resistance line on the weekly chart.
My assessment for the coming weeks: after the strong rise, a technical reaction may come first. In the long run, the US dollar could rise further, but the whole area between 1.44 and 1.48 remains strong resistance.
Frequently asked questions
What is the USD/CAD forecast for 2026?
On the chart, the picture points up. On the monthly chart a green uptrend line confirmed several times underpins the long-term uptrend. After the four-week rally, a technical reaction may come first. Above, Karsten sees a strong resistance zone between 1.44 and 1.48 with the 1986 high at 1.4420.
Will the Canadian dollar get stronger or weaker?
The chart currently points to a weaker Canadian dollar. When USD/CAD rises, the US dollar gains and the Canadian dollar loses. The uptrend is intact, and over the long term the US dollar could rise further. The resistance zone between 1.44 and 1.48 can slow it down.
How high are the policy rates in the United States and Canada?
The Fed’s policy rate is higher. It raised its target range to 3.75 to 4.00 percent on 16 September 2026. The Bank of Canada has held its policy rate at 2.25 percent since 30 October 2025. Both central banks announce their next decisions on 28 October 2026.
What role does the oil price play for USD/CAD?
Canada is the largest oil supplier to the United States. A high oil price brings export revenue into the country and tends to strengthen the Canadian dollar, so USD/CAD tends to fall. This link is why the Canadian dollar counts as a commodity currency.
Please note
The conclusion is my personal assessment based on experience; the three paths are reference levels. Both summarize possible price developments and are not a certainty. This is market analysis, not investment advice. Keep your position sizes in line with your own risk management.
This forecast is translated from the German edition on kagels-trading.de.
How our forecasts are made and reviewed: How we work.