
GBP/USD Forecast: Pound to Dollar Outlook and Levels
This analysis is from 22 September 2026. Prices have moved since, so the levels below may no longer apply until the next update.
GBP/USD forecast in 30 seconds
Where it stands
1.3352 at 10:09 CEST on 22 September 2026, below all four daily moving averages.
Short term
The averages between 1.3432 and 1.3489 cap the price; the picture points to the 1.32 zone.
Key support
The marked support at 1.3141, where the pair found a floor in June 2026.
Key resistance
The August high, which Christian puts at 1.3675, then the marked resistance at 1.3789.
On this page
- GBP/USD forecast in 30 seconds
- GBP/USD forecast, short term: below the moving averages
- GBP/USD forecast to 2028, medium term: the range since summer 2025
- GBP/USD forecast to 2030, long term: recovery after the 2022 low
- The two paths for GBP/USD and when they apply
- What is the GBP/USD currency pair?
- What moves the GBP/USD rate
- How this forecast is made
- Conclusion: recovery with a test ahead
- Frequently asked questions about the GBP/USD forecast
- Please note
GBP/USD forecast, short term: below the moving averages
 Click to enlarge
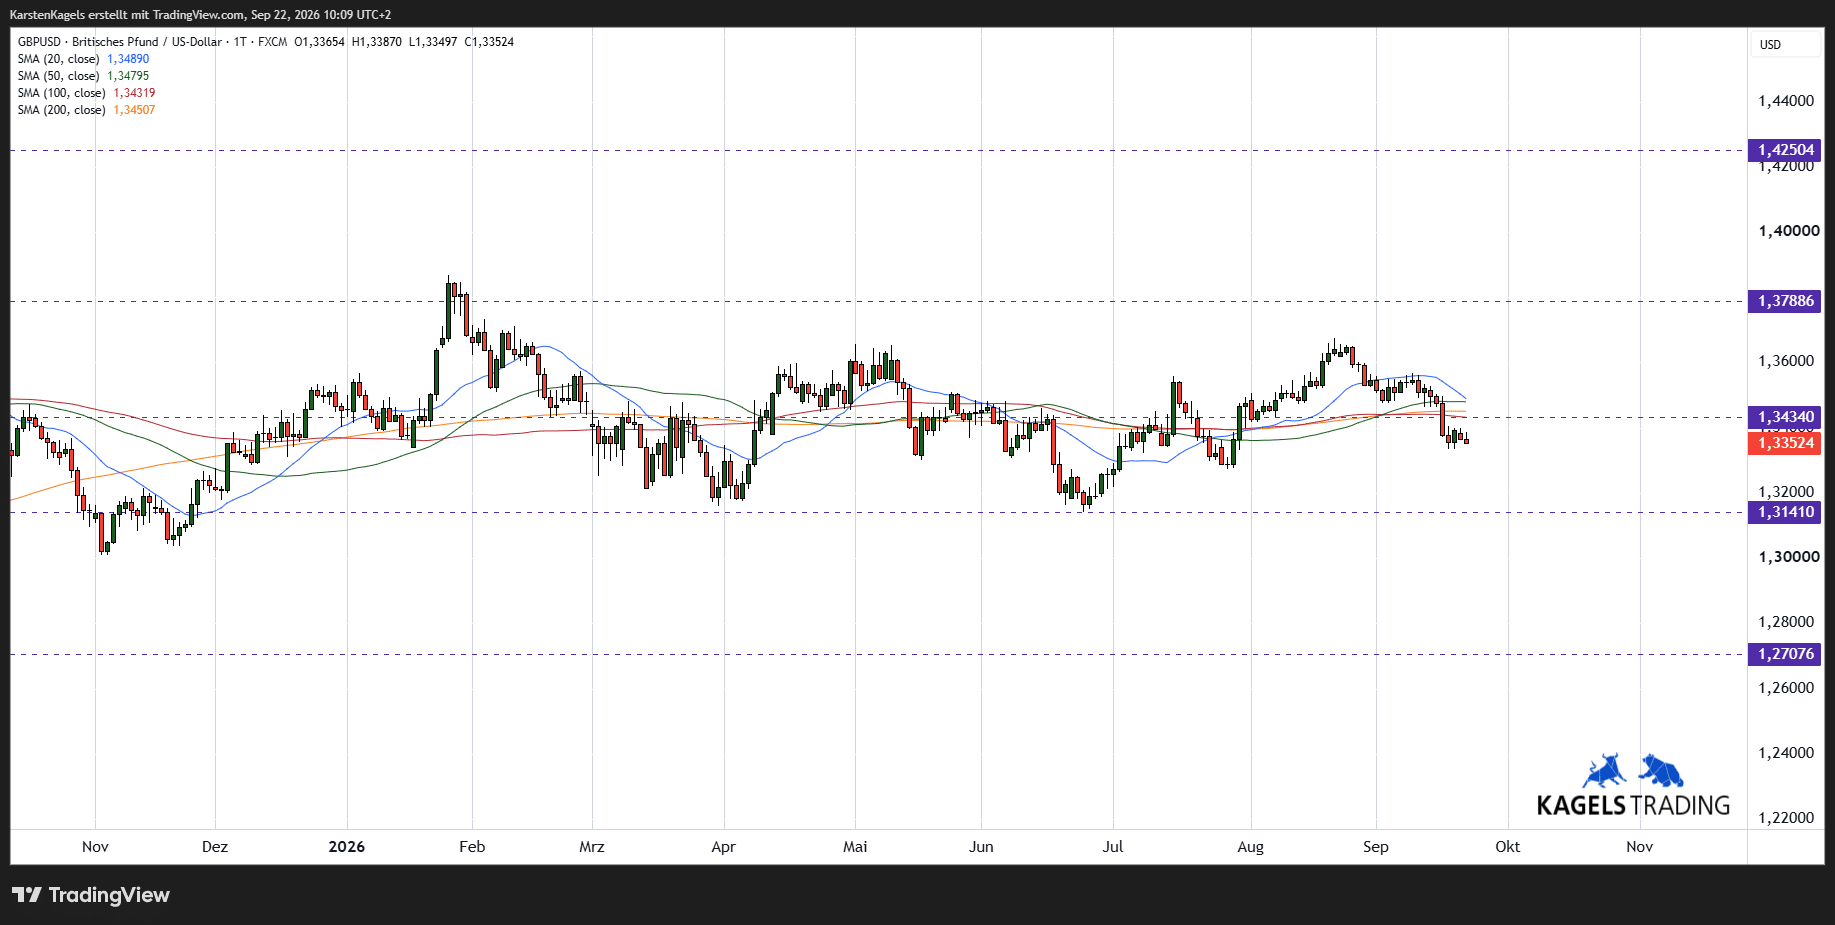
Looking back, the pair has moved sideways since the start of the year. After the January high above 1.38, GBP/USD fell back and found support near the marked line at 1.3141 in June. In August it reached a high that Christian puts at 1.3675, and since then it has been correcting again.
In the week of the Fed and BoE decisions, GBP/USD dropped below all four moving averages. At 10:09 CEST on 22 September the pair stood at 1.3352. The 20 day line sits at 1.3489, the 50 day line at 1.3480, the 200 day line at 1.3451 and the 100 day line at 1.3432. The 50 and 200 day lines are only about 30 pips apart.
Such a tight cluster forms in long sideways phases and often resolves into a clear move. Together with the 2024 high at 1.3434, the averages form a resistance zone between 1.3432 and 1.3489. The direction is decided at the established edges near 1.31 and 1.38.
For now, the short-term picture points to the 1.32 zone. Only a return above the cluster of moving averages would bring the 1.38 area back into play, and the August high at 1.3675 is the threshold on the way. Below the marked support at 1.3141, the chart marks the next line at 1.2708.
Resistance
- 1.3789
- 1.3675
- 1.3489
- 1.3432
Price at analysis1.3352
Support
- 1.3141
- 1.2708
GBP/USD forecast to 2028, medium term: the range since summer 2025
 Click to enlarge
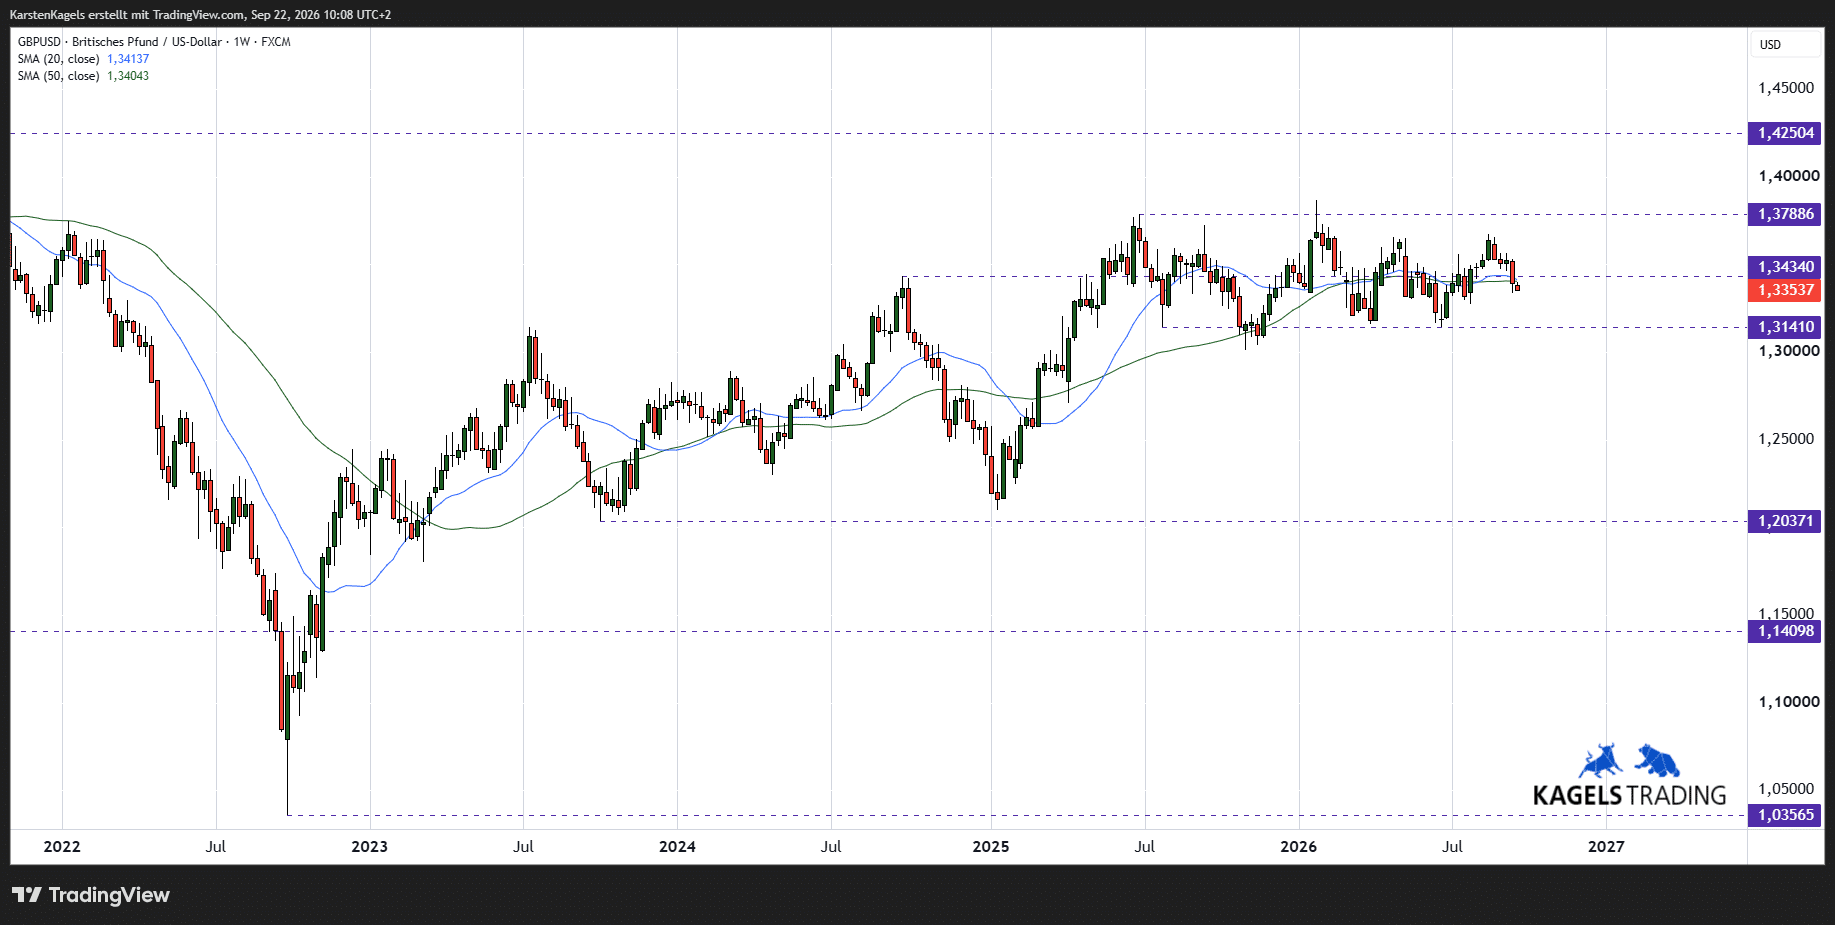
Since the low of 2022, the weekly chart shows a broad recovery in stages. Strong rises alternate with sideways phases that last for months. Since the summer of 2025 such a phase has shaped the chart, roughly between the marked resistance at 1.3789 and the marked support at 1.3141. The lowest weekly bars of the range reach down to about 1.30.
At the moment, GBP/USD trades below both weekly averages. The 20 week line sits at 1.3414 and the 50 week line at 1.3404; at 10:08 CEST the pair stood at 1.3354. Within the limits of 1.30 and 1.38, the sideways phase continues. Only a confirmed breakout would set the direction and the price targets that follow from it.
The way to 2028 hangs on two levels. A weekly close above the January high, above 1.38, would signal a continuation, with targets in the area of 1.42; the chart marks the 2021 high at 1.4250. A sustained break below 1.30 would end the upward structure and bring 1.28 and 1.25 into focus.
Resistance
- 1.4250
- 1.3789
- 1.3434
- 1.3414
- 1.3404
Support
- 1.3141
- 1.2037
GBP/USD forecast to 2030, long term: recovery after the 2022 low
 Click to enlarge
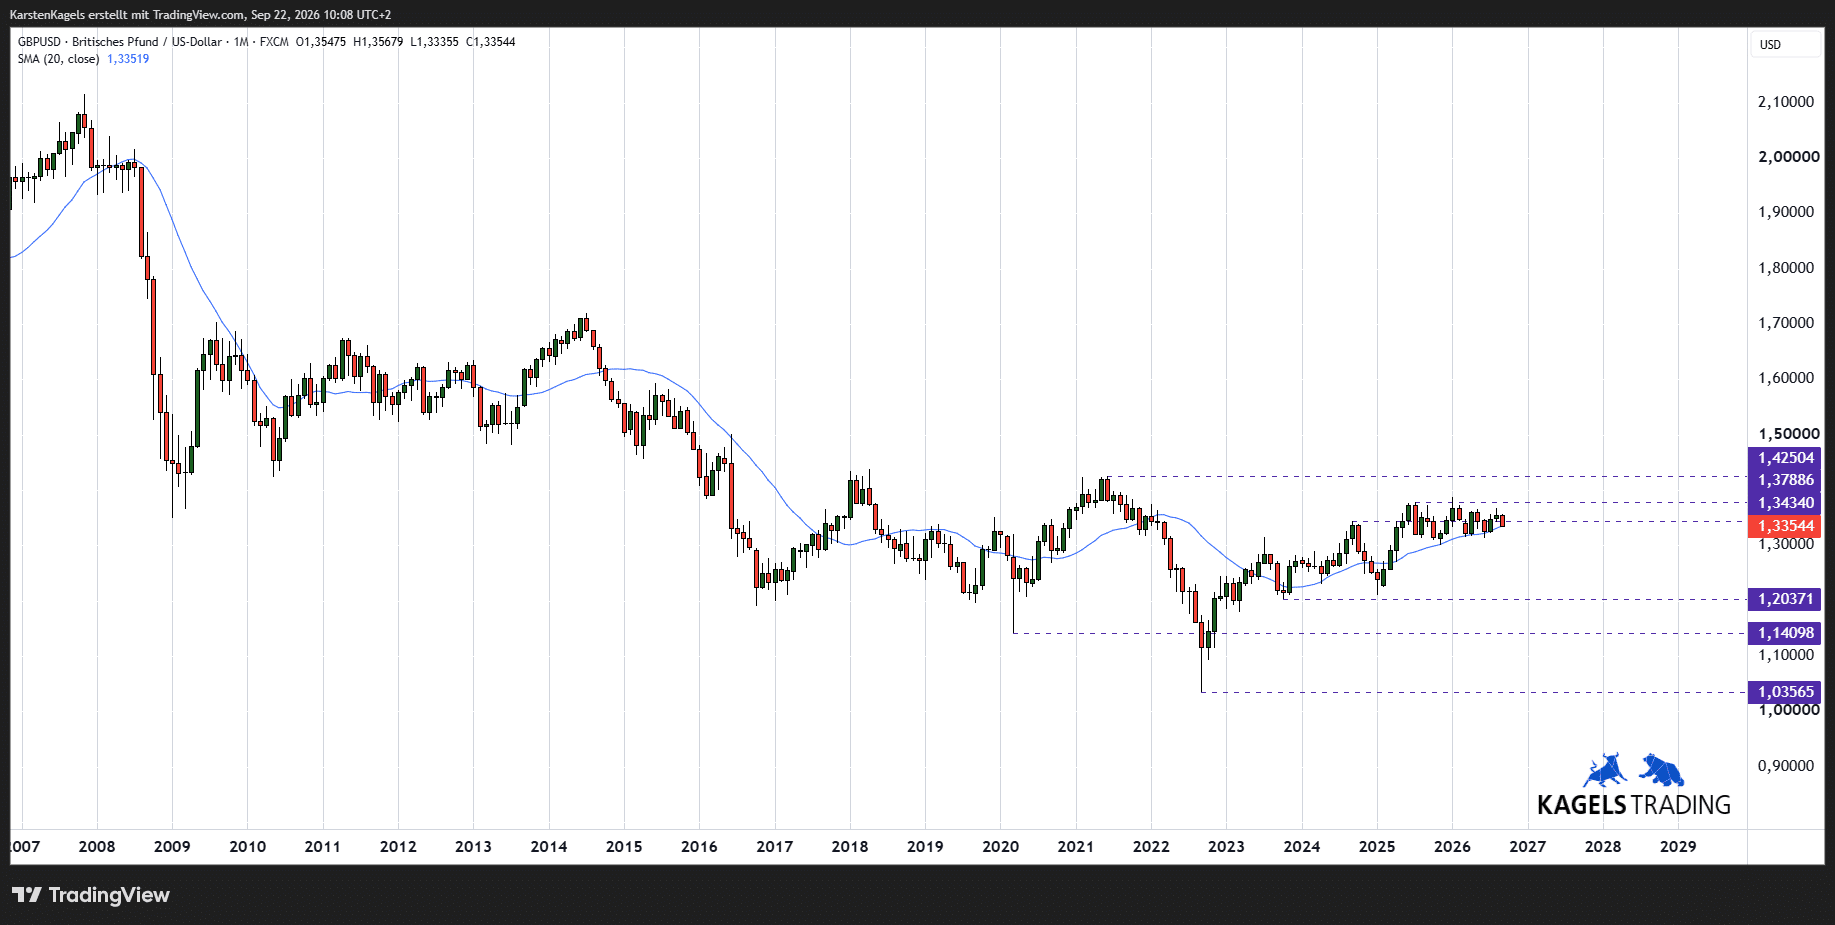
The monthly chart tells a story of decline. From the 2014 high above 1.71, the pair fell through the Brexit referendum and the pandemic to 1.0357 in September 2022, the lowest level in the FXCM data of our charts. Since then a recovery has been running.
The price sits on the rising 20 month line, and that supports a continuation of the recovery. The 20 month line is at 1.3352, and at 10:08 CEST GBP/USD stood just above it at 1.3354. The way up is long: more than 3,500 pips separate the current price from the 2014 high, and the area of 1.42 to 1.44 has acted as a lid several times in recent years.
For the outlook to 2030, two scenarios are plausible. If the recovery holds, a return to the band between 1.40 and 1.45 would be the next step. If it fails, the zone between 1.20 and 1.25 remains the area where the pair spent years after Brexit; the chart marks support at 1.2037 and the 2020 low at 1.1410. In Christian's assessment, a crisis comparable to 2022 could put the record low back into focus.
Resistance
- 1.4250
- 1.3789
- 1.3434
Support
- 1.3352
- 1.2037
- 1.1410
- 1.0357
The two paths for GBP/USD and when they apply
Two conditions describe the next big move, a third one describes waiting. What counts is the weekly close on the FXCM chart shown here. These are reference levels, not order rules, and the picture has to be reassessed after every weekly close.
Bullish: weekly close above the January high
A weekly close above the January high, above 1.38, would signal a continuation. Targets lie in the area of 1.42, where the 2021 high at 1.4250 is marked. Before that, the pair would have to win back the moving averages between 1.3432 and 1.3489 and the August high at 1.3675.
Bearish: sustained break below 1.30
A sustained break below 1.30 would end the upward structure. Then 1.28 and 1.25 come into focus, and on the long-term chart the marked support at 1.2037.
Wait: between 1.30 and 1.38
Between 1.30 and 1.38, neither condition is active. That is the case right now. In the short term the levels of the daily chart count, above all the marked support at 1.3141.
Resistance
- 1.4250
- 1.3789
- 1.3675
Support
- 1.3141
- 1.2037
What is the GBP/USD currency pair?
GBP/USD is the currency pair made of the British pound and the US dollar. The rate says how many US dollars one pound costs. When the rate rises, the pound gains and the dollar loses value.
Traders call the pair “Cable”. The name dates from the 19th century, when the rate was sent between London and New York through a transatlantic cable. GBP/USD is one of the most traded currency pairs and is correspondingly liquid.
Cable can show large moves within a day. It often forms clear trends, and its volatility is part of its appeal. For traders that means larger opportunities and larger risks at the same time.
The strongest moves of recent history came from politics. In the night after the Brexit referendum of 23 June 2016, GBP/USD fell sharply within hours. In late September 2022, after the mini-budget of the Truss government, the pair marked its record low. Whoever trades Cable always trades British politics as well.
What moves the GBP/USD rate
At the moment the rate gap between the two central banks is small. The drivers to watch are the Bank of England, the Fed, UK inflation and the dollar side:
- The rate gap between the Bank of England and the Fed: the Bank of England left Bank Rate at 3.75% on 17 September 2026, the level since 18 December 2025 (Monetary Policy Summary, September 2026). The Fed raised its target range by a quarter point to 3.75 to 4.00% on 16 September, unanimously (Fed statement). The dollar therefore leads by 0 to 0.25 percentage points, a small advantage.
- Why the gap matters: a rate gap works on the currency market like a pull. Capital flows into the currency with the higher rate. Without a clear gap, other factors set the direction, such as economic data, fiscal policy and general risk appetite.
- A split Bank of England: three of the nine members of the Monetary Policy Committee, Megan Greene, Catherine Mann and Huw Pill, voted for a rise to 4% in September, as in July. More on the votes in our article on the Bank of England rate decision.
- UK inflation: consumer prices rose by 3.1% in August, and the Bank of England expects inflation to rise further over the coming quarters, driven by higher energy prices from the conflict in the Middle East. This inflation outlook argues for caution over rate cuts, and in Christian’s assessment that offers some support to the pound.
- The dollar side: in Christian’s assessment, the rise from the June low to the August high came less from British strength than from dollar weakness. Whoever wants to judge the move should look less at London than at Washington. Our EUR/USD forecast shows the dollar side of the largest pair.
The next dates. The Fed decides on 28 October 2026 after its meeting of 27 and 28 October, usually at 2:00 p.m. Eastern Time (19:00 CET), see the Fed rate decision. The Bank of England follows on 5 November 2026 at noon London time (7:00 a.m. Eastern Time, 13:00 CET), together with a new Monetary Policy Report. If one of the two decisions surprises, the rate gap that the pair lacks today can appear.
How this forecast is made
The analysis rests on three time frames. The daily chart shows the coming weeks, the weekly chart the way to 2028 and the monthly chart the long-term frame to 2030. Each chart shows moving averages and marked highs and lows; how such levels work is explained in our guide to support and resistance. The charts are made with TradingView on FXCM data, and this page follows our editorial policy.
Conclusion: recovery with a test ahead
The long-term recovery since 2022 is intact, but in the short and medium term GBP/USD has slipped below its averages. On the daily chart the price is below all four lines, on the weekly chart below the 20 and 50 week lines, and on the monthly chart it sits right on the rising 20 month line. The sideways range between about 1.30 and 1.38 since summer 2025 still holds.
The limitation lies in the drive. In Christian’s assessment, the summer rise came less from British strength than from dollar weakness, and a rate gap that would support the pound hardly exists. If sentiment turns towards the dollar, the move can lose its basis faster than the chart suggests.
In practice that means sticking to the levels. Above, the cluster of averages between 1.3432 and 1.3489 is the first hurdle and 1.3675 the next threshold. Below, the marked support at 1.3141 is the level that matters. Between them lies noise. For a different dollar pair with a wide rate gap, see the USD/CHF forecast.
Frequently asked questions about the GBP/USD forecast
What is the GBP/USD forecast for 2026?
GBP/USD is waiting for a directional impulse. On 22 September 2026 the pair stood at 1.3352, below all four daily moving averages. It needs a breakout from the sideways range between about 1.30 and 1.38 to set the next direction; in the short term the picture points to the 1.32 zone.
Why did the British pound rise against the dollar in the summer?
In Christian’s assessment, the drive came from the dollar side. The rise from the June low to the August high reflected dollar weakness rather than British strength. A rate gap in favour of the pound hardly exists: the Bank of England and the Fed are almost level.
How high are the policy rates in the UK and the United States?
They are almost level. The Bank of England holds Bank Rate at 3.75%, confirmed on 17 September 2026 by six votes to three; the three dissenters wanted 4%. The Fed raised its target range to 3.75 to 4.00% on 16 September 2026. The next decisions come on 28 October (Fed) and 5 November 2026 (Bank of England).
What role does Brexit still play for GBP/USD?
Hardly any as a driver, but still as a price level. Since the referendum of June 2016, the pair has not returned to its level before the vote. The area of 1.42 to 1.44 still acts as resistance; the 2021 high at 1.4250 lies there.
What was the record low of GBP/USD?
The record low came in late September 2022, after the mini-budget of the Truss government. It caused a crisis of confidence on the bond market. In the FXCM data of our charts the low is 1.0357; other price feeds show slightly different values.
How can GBP/USD be traded?
Through forex brokers or derivatives such as CFDs. Cable is one of the most liquid pairs, and the spreads are correspondingly tight. Because of the high volatility, every position needs a stop.
Please note
The scenarios are a personal assessment based on experience. They summarize possible price developments for each time frame and are not a certainty. This is market analysis, not investment advice. Keep your position sizes in line with your own risk management.
This forecast is translated from the German edition on kagels-trading.de.
How our forecasts are made and reviewed: How we work.