
S&P 500 Forecast: Today, This Week, 2027 and 2030 (SPX)


This analysis is from 30 September 2026. Prices have moved since, so the levels below may no longer apply until the next update.
S&P 500 forecast in 30 seconds
Right now
7,670.84 points at the close on 29 September 2026, 1.9 percent below the all-time high of 7,816.70.
Short term
Neutral, above the June high. The gap from 21 September is closed.
Key support
June high and half-year high 7,621.
Next target
A close above the record at 7,817 opens the way to 8,000 points.
On this page
- S&P 500 forecast in 30 seconds
- S&P 500 forecast for Wednesday, 30 September 2026 and the next day: the hourly chart
- S&P 500 forecast for the week of 28 September 2026: the daily chart
- S&P 500 forecast: the weekly chart
- S&P 500 on the monthly chart: an inside bar in September
- S&P 500 forecast 2026: the June high decides
- S&P 500 forecast 2027: the conditions
- S&P 500 on the half-year chart: the half-year high decides
- S&P 500 forecast 2030: 150 years of uptrend
- Bull case and bear case: both hang on the same levels
- What is the S&P 500 index?
- Key drivers for the S&P 500 forecast
- How this forecast is made
- Conclusion: where is the S&P 500 heading?
- Frequently asked questions about the S&P 500 forecast
- Please note
S&P 500 forecast for Wednesday, 30 September 2026 and the next day: the hourly chart
 Click to enlarge
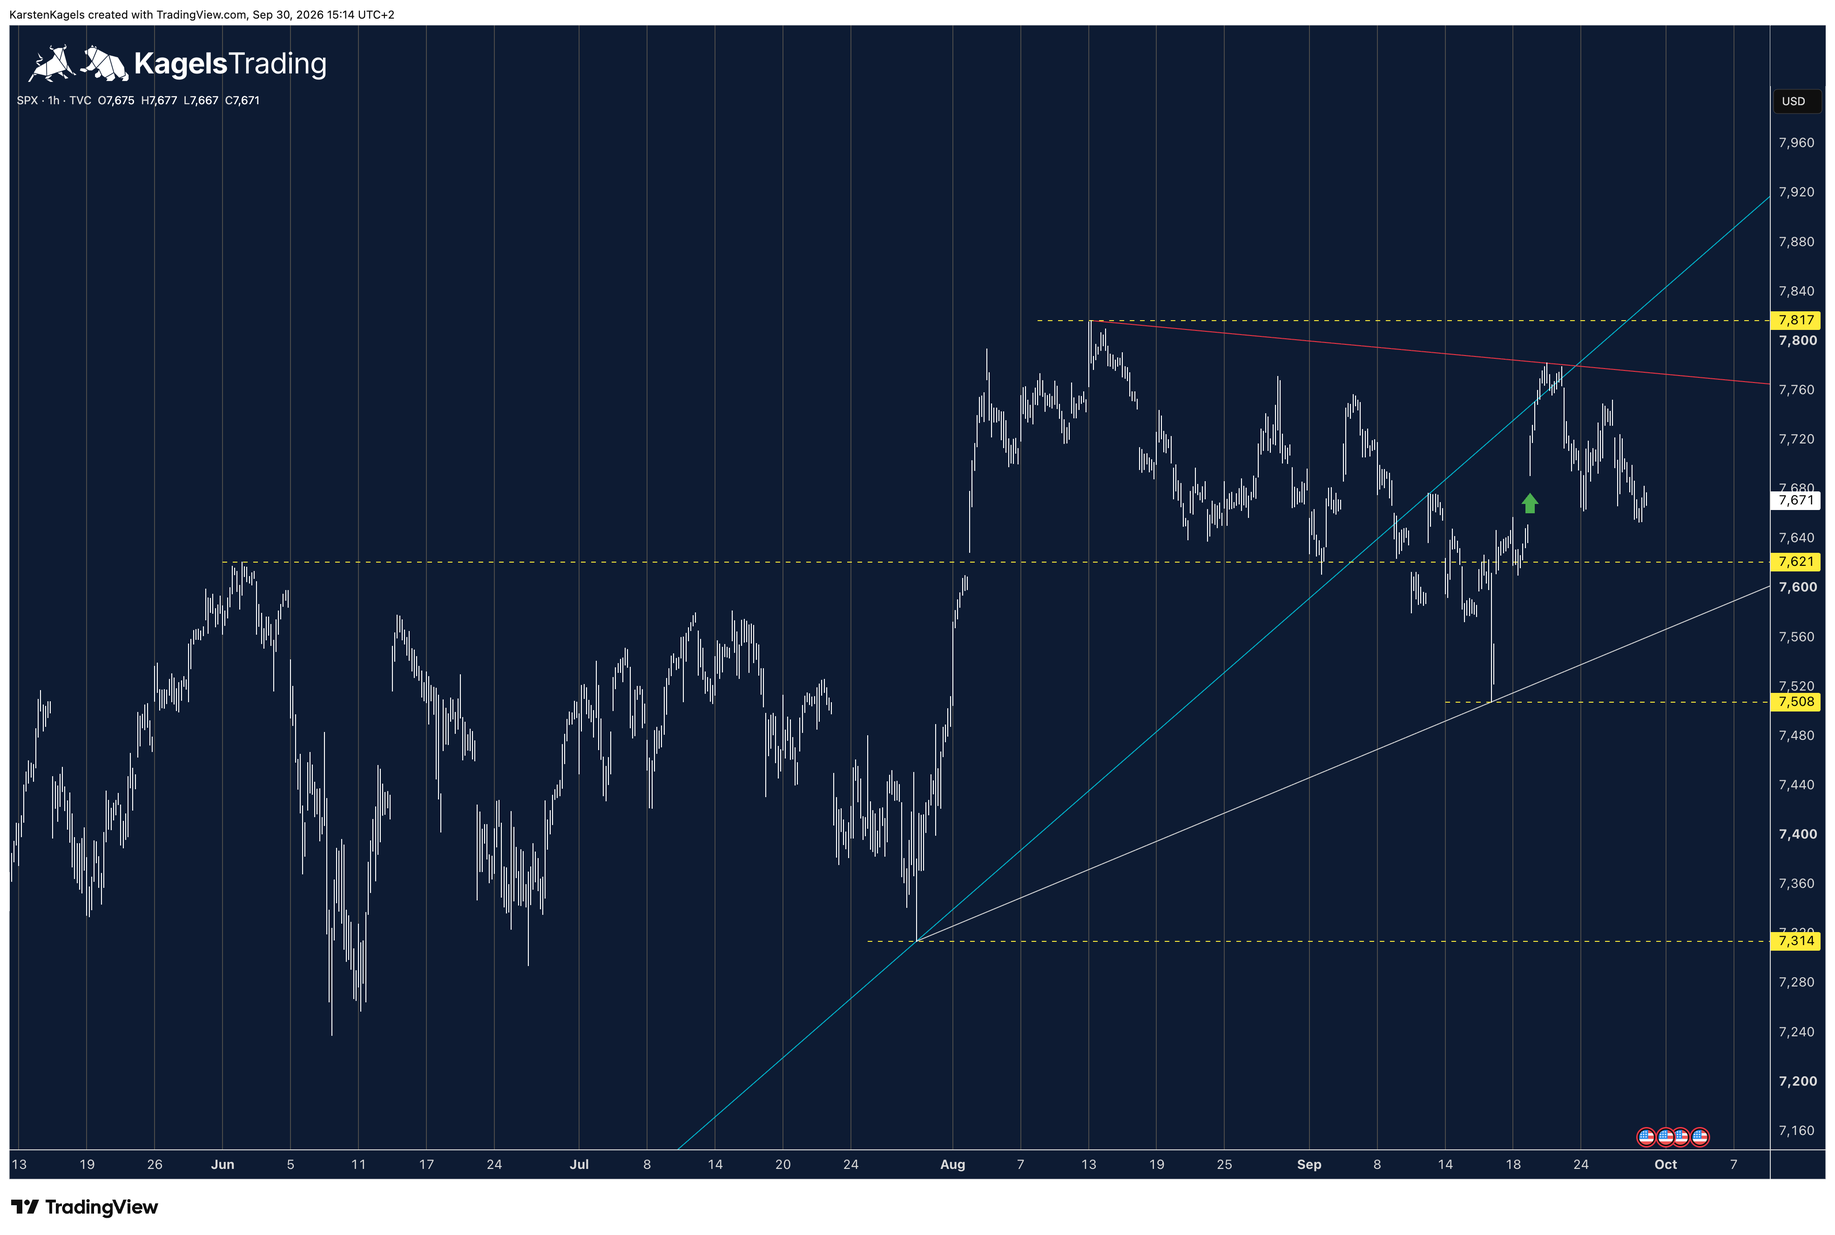
The gap from 21 September is closed, and in my reading it closed to the point. I mean the gap between the trading ranges: the high of 18 September was 7,657.17 points, the low of 21 September 7,691.19. With a low of 7,653.55 on 29 September the index ran through this gap completely. Measured to Friday's close at 7,650.50, 3 points were still open. "To the point" is my chart reading, not an exact match of prices.
Here, a gap means that the price ranges of two consecutive sessions do not overlap. In an upward gap, the later session's low is above the earlier session's high. In my analysis, an unfilled gap is a potential area to watch on a pullback, not a guarantee that price will return to it.
The market is moving sideways, but above the June high. The June high at 7,620.90 points was resistance until early August. On 4 August the index opened with a gap above it, and since then the level has acted as support. In mid-September it fell below it on a few days and had reclaimed it by 17 September. Above this level price swings inside a diagonal triangle.
The two sides of the triangle connect specific highs and lows in my chart reading. The red upper line joins the 13 August high at 7,816.70 to the 22 September high at 7,782.19 and falls slightly. The white lower line is the short-term uptrend line. It joins the 29 July low at 7,313.92 to the 16 September low at 7,507.77 and rises.
The medium-term uptrend line now acts as resistance. The blue line starts at the March low of 30 March at 6,316.91 points and touches the July low. On the hourly chart you only see its last part. In mid-September the index fell below it, last week it tested the line from below and bounced off at 7,782 on 22 September. A broken trend line often turns into resistance, and that is what happened here.
Resistance
- 7,817
- 7,782
Price at analysis7,671
Support
- 7,621
- 7,508
- 7,314
S&P 500 forecast for the week of 28 September 2026: the daily chart
 Click to enlarge
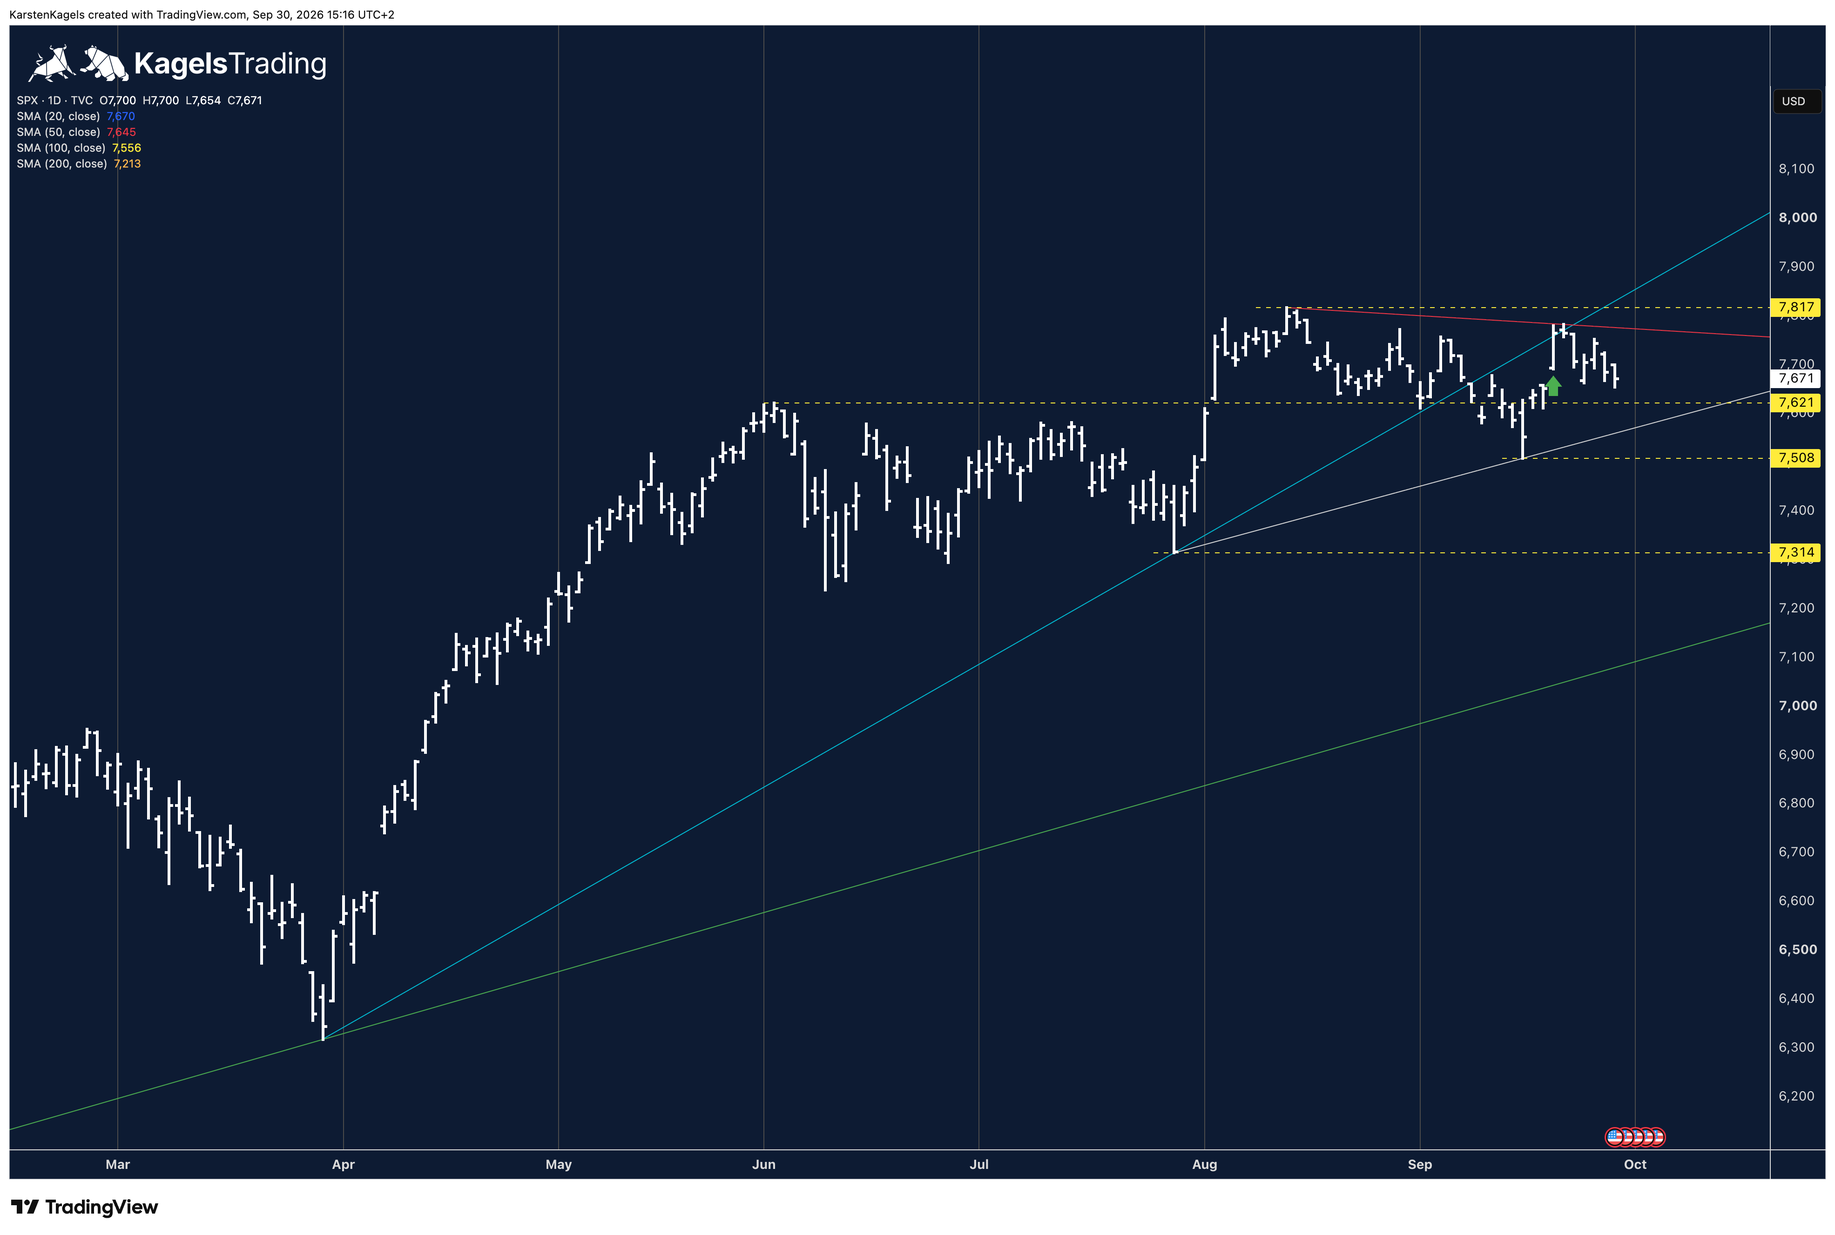
The daily chart shows what is going on in compressed form, and it still looks neutral. Since early August the index has been swinging between the all-time high and the June high. Neither buyers nor sellers have won. The record is only 1.9 percent away.
The most important support is the area around the June high at 7,621. After the pullback to 7,507.77 the index reclaimed the June high. Below it runs the short-term uptrend line in white. It rises by about 6 points per trading day and sits near 7,565 points on 30 September. By mid-October it reaches the June high. It is the next potential support if the June high does not hold.
How the tech stocks are doing is part of the picture. The cross check comes from the Nasdaq 100 forecast, the price-weighted comparison from the Dow Jones forecast.
Resistance
- 8,000
- 7,817
- 7,782
Support
- 7,621
- 7,565
- 7,508
- 7,314
S&P 500 forecast: the weekly chart
 Click to enlarge
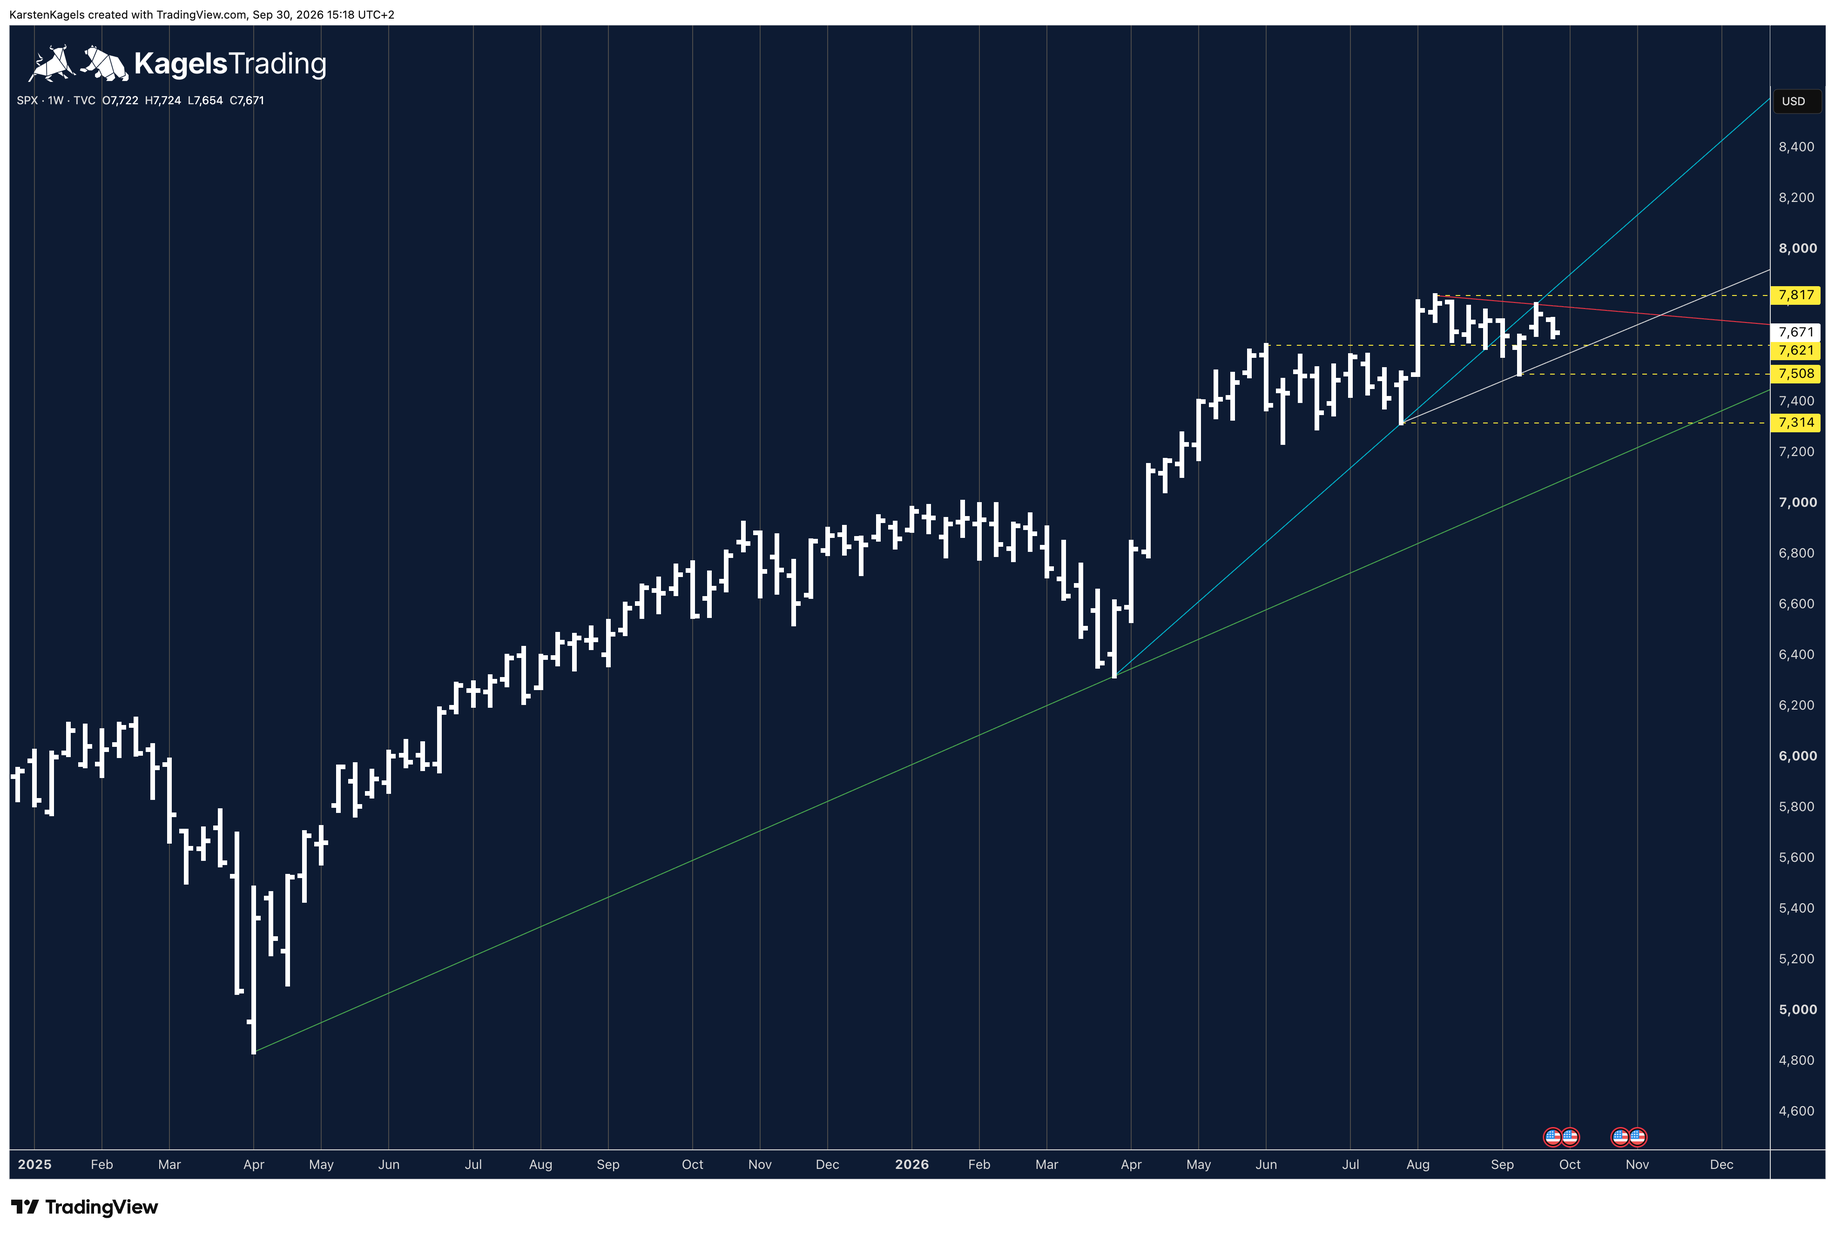
On the weekly chart the S&P 500 moves sideways in a neutral way, right below the all-time high. Since early August the index has been swinging between 7,816.70 and 7,620.90 points. In mid-September it fell below the lower level on a few days, but every weekly close stayed above it. In these eight weeks the market has not found a direction.
Above the market there is only the all-time high. There is no older resistance above it. A weekly close above 7,817 would therefore be the clear signal for the next leg toward 8,000 points.
Below lie the three most important supports, shown in the chart as yellow dashed lines. First the June high at 7,621, resistance until August and support since the breakout. Then the low of 16 September at 7,508, where the last pullback turned. Finally the low of 29 July at 7,314, where the rally to the all-time high started.
Two trend lines carry the uptrend. The long-term uptrend line in green connects the low of 7 April 2025 at 4,835.04 points with the March 2026 low at 6,316.91. Today it runs near 7,100 points, about 7 percent below the price. The white short-term uptrend line lies much closer to the market. As long as both hold, the bigger trend stays intact.
The two key levels mark different warning stages. Losing the June high and half-year high at 7,621 again would weaken the breakout picture. A brief dip below it is not enough on its own: what matters is whether the index reclaims 7,621 quickly. A weekly close below 7,314 would be the more serious damage to the uptrend on the weekly chart.
Resistance
- 8,000
- 7,817
Support
- 7,621
- 7,508
- 7,314
S&P 500 on the monthly chart: an inside bar in September
 Click to enlarge
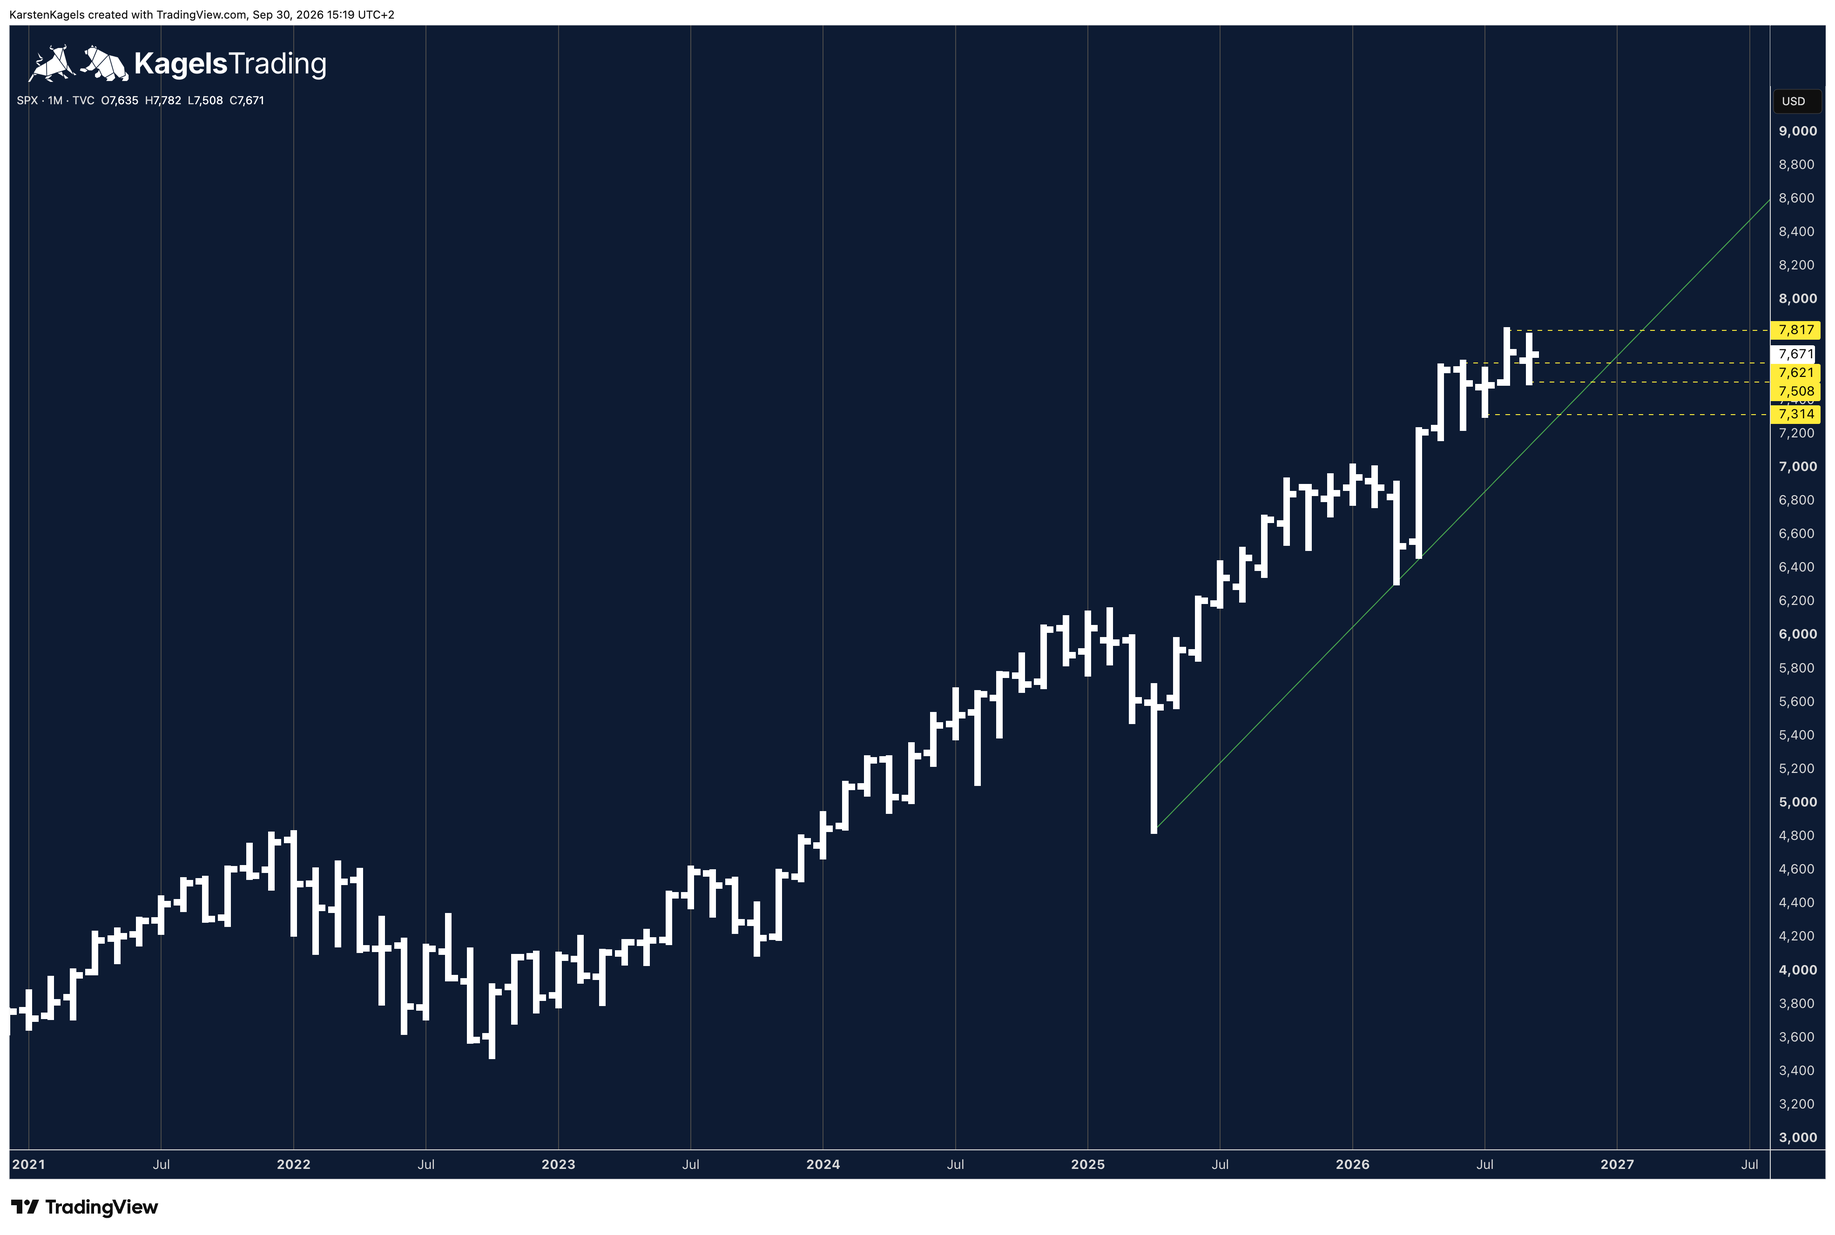
From the monthly chart's point of view, the long-term uptrend is intact. Since the low in October 2022 at 3,491.58 points the index has more than doubled, by almost 120 percent up to 29 September. The green uptrend line from the April 2025 low to the March 2026 low lies well below the price.
September 2026 finished as an inside bar. That is a candle whose high and low both lie inside the previous candle. The September high of 7,782.19 stayed below the August high of 7,816.70, and the September low of 7,507.77 stayed above the August low of 7,504.78. The month closed at 7,651.54. The chart above was exported before the final September session.
An inside bar shows a pause, not a direction. The decision comes when one of the two August levels breaks. A monthly close above 7,817 continues the uptrend. A break below 7,505 opens the way to the July low at 7,314 points.
Resistance
- 8,000
- 7,817
Support
- 7,621
- 7,505
- 7,314
S&P 500 forecast 2026: the June high decides
Since the start of the year the S&P 500 is up about 12 percent. The year 2025 ended at 6,845.50 points. In March the index fell to 6,316.91, then the rally to the all-time high in August followed. For the close of 2026 one level decides in my view: if the half-year high at 7,621 holds, the chart picture stays positive and a test of 8,000 is possible.
The published year-end targets of the banks are still far apart. Bank of America raised its target for the end of 2026 in September from 7,100 to 7,400 points. Citigroup names 8,100 points, and so does HSBC after raising it from 7,650. Against the close of 29 September this selection spans about minus 3.5 to plus 5.6 percent.
The earnings season delivers strong numbers, but also includes one-off effects. FactSet reports for the second quarter of 2026, as of 25 September, that 86 percent of companies beat earnings estimates and that earnings growth reached 52.2 percent year over year. Large gains on investments and valuations at Alphabet and Amazon lifted that rate. It should not be read as equally strong growth in the ongoing business of all companies.
Participation of single stocks matters for what comes next. A weaker market breadth would be a warning sign if fewer and fewer stocks carry the index higher. The SPX chart alone cannot show that. On top comes the Fed rate rise of 16 September.
S&P 500 forecast 2027: the conditions
For 2027 the chart does not give a price target yet, but it does give the conditions. If the index holds above the half-year high at 7,621 and manages a monthly close above the all-time high, it moves into unknown territory. Then there are no old resistance levels above it any more, only round numbers such as 8,000 and 8,500.
A calculation example shows the order of magnitude. Since the end of 1995 the S&P 500 has risen at an annualized rate of 8.55 percent, without dividends. At that rate it would reach about 8,500 points at the end of 2027. This is a calculation with a historical growth rate, not a forecast. In single years the index moves far away from it; in 2022, for example, it lost 19.4 percent.
I will add bank targets for the end of 2027 with source and publication date. I will separate a calendar-year target from a rolling 12-month target. Until then: as long as the uptrend on the weekly and monthly chart is intact, the outlook for 2027 stays constructive.
S&P 500 on the half-year chart: the half-year high decides
 Click to enlarge
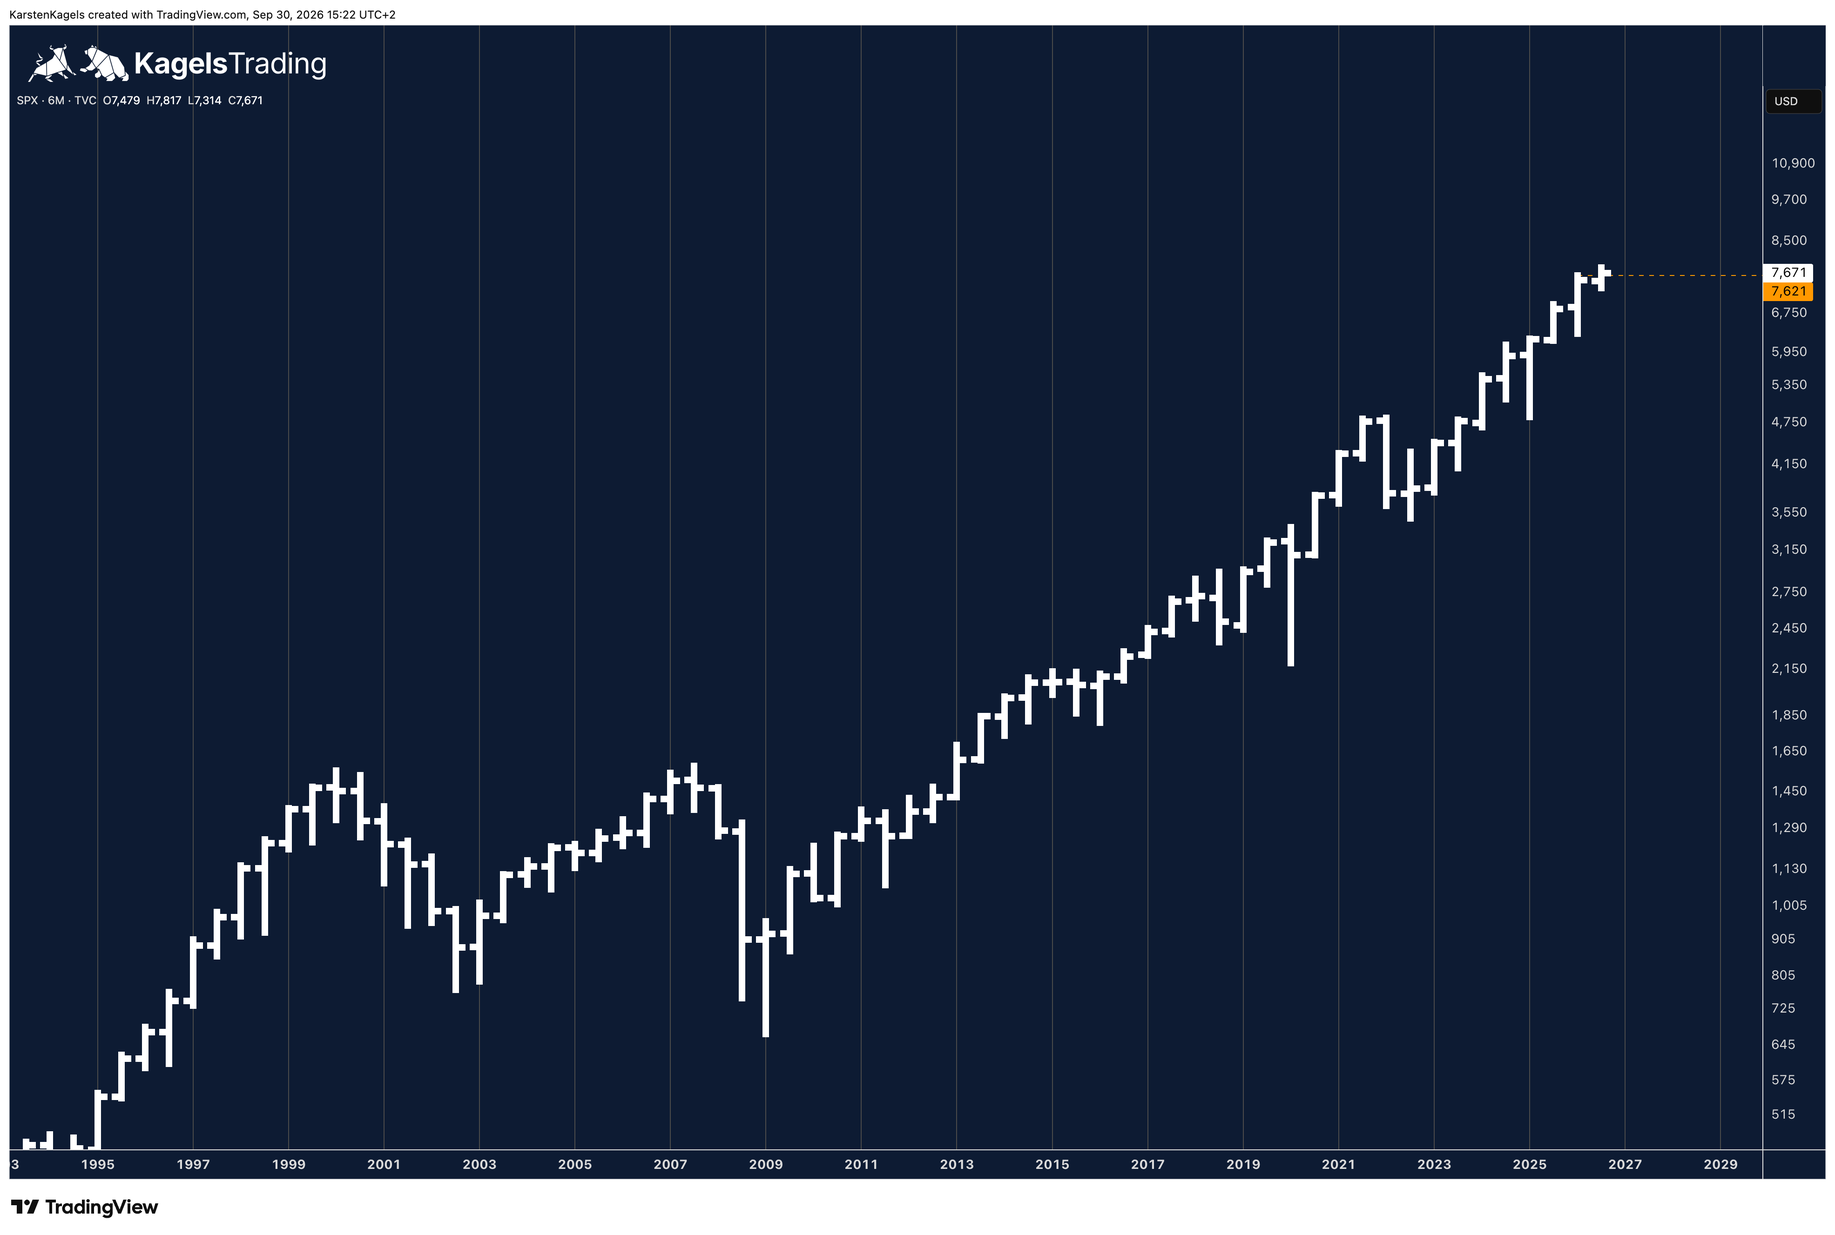
On the half-year chart each candle stands for six months, and the scale is logarithmic. Logarithmic means that equal distances on the price axis stand for equal percentage moves. That makes the crash of 2008 and today's moves comparable, although the index traded below 700 points back then.
What matters now is the half-year high, drawn as an orange line in the chart. It is the high of the first half of 2026 from 2 June at 7,620.90 points, the same level that shows up as the June high on the shorter time frames. In the second half of the year the index broke above it in August.
If the S&P 500 falls through the half-year high, the longer-term chart picture would also get clearly worse. If the level is lost and not reclaimed quickly, the breakout of the second half would have failed, and the index would fall back into the range of the first half. That range ran from the March low at 6,316.91 to 7,620.90 points.
A brief dip below the June high is not enough on its own to confirm a failed breakout. What matters is whether the index reclaims 7,621 quickly. A weekly close below 7,314 remains the separate, more serious warning stage.
Support
- 7,621
- 7,314
- 6,317
S&P 500 forecast 2030: 150 years of uptrend
 Click to enlarge
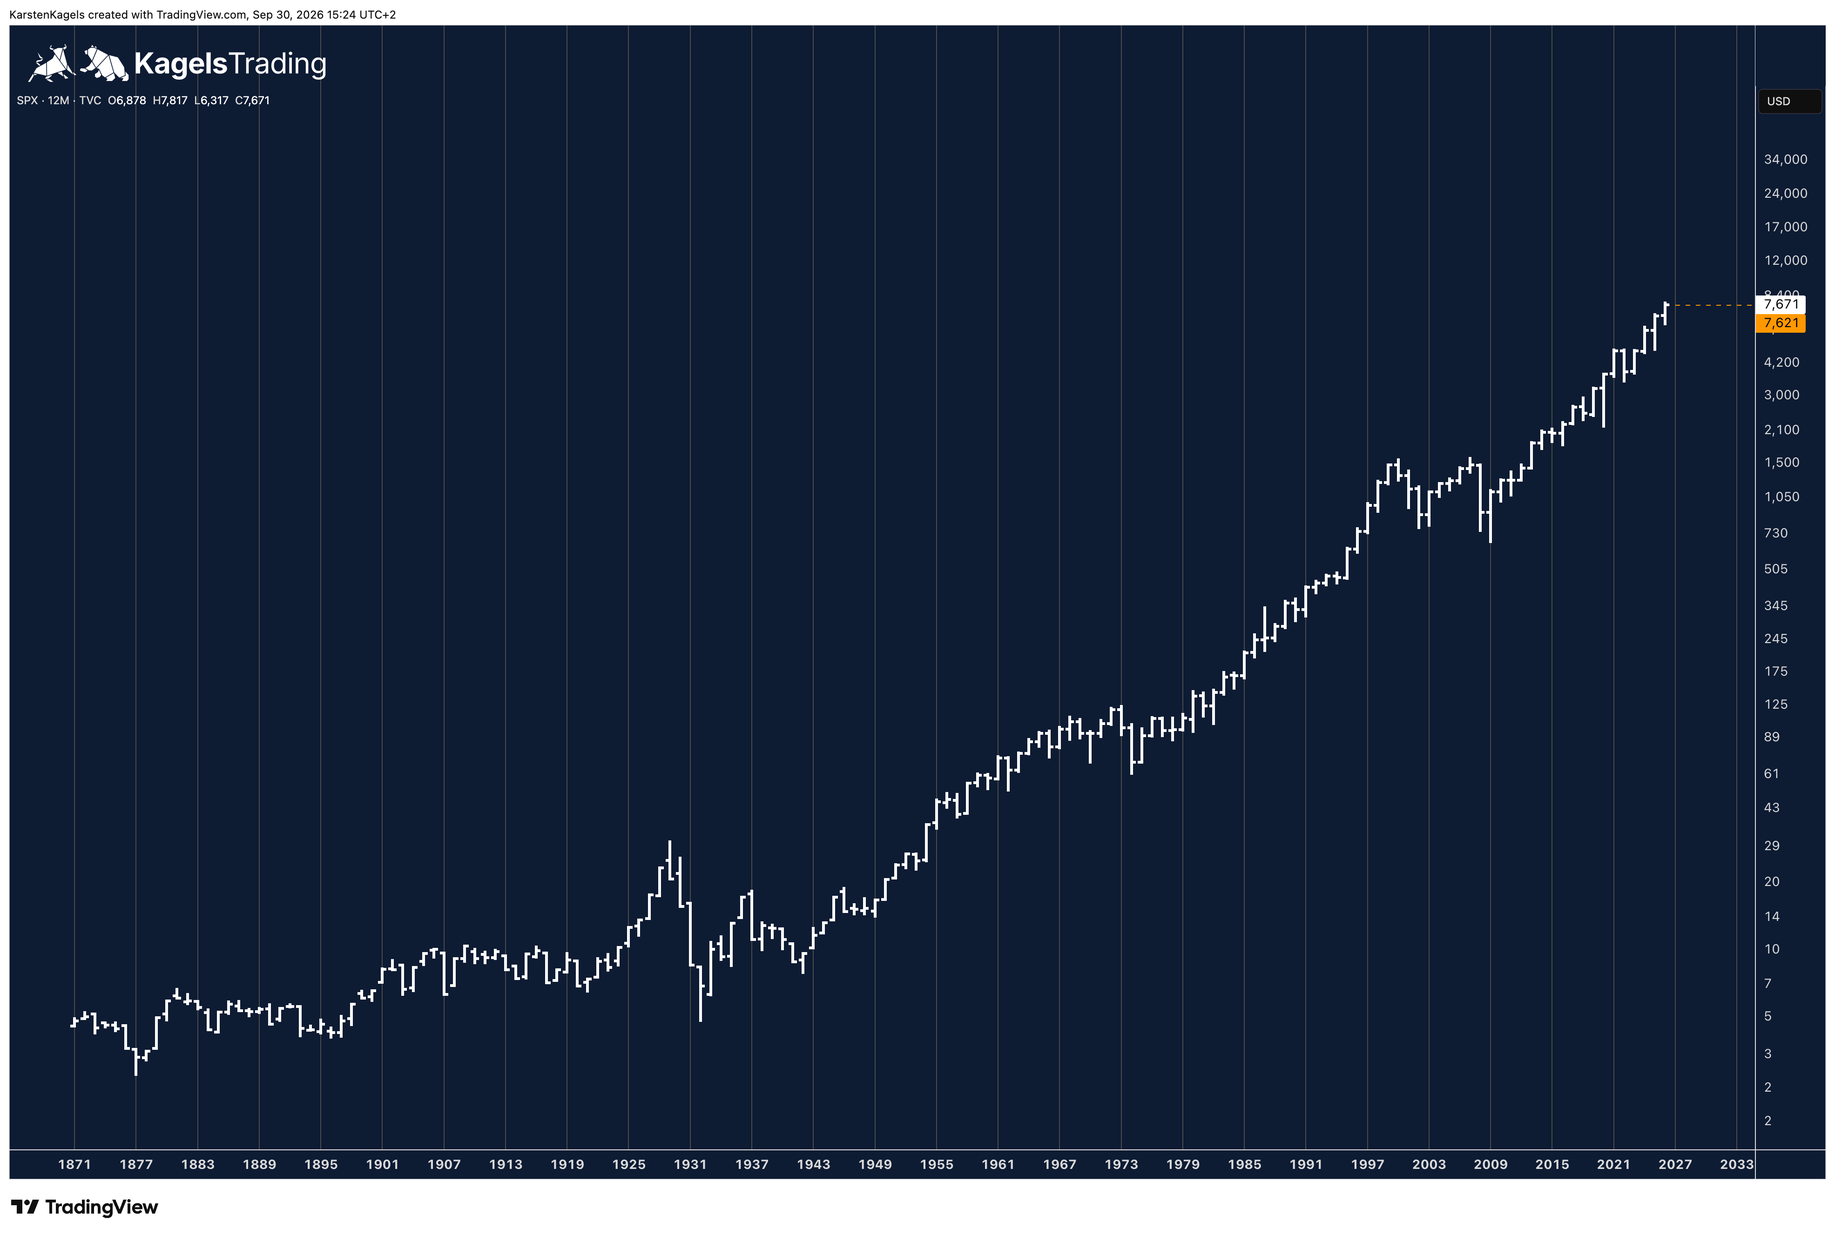
The ultra long-term yearly chart since 1871 shows the uptrend of the last 150 years. It is logarithmic as well. The S&P 500 with 500 companies has existed since 1957; for the SPX, TradingView also shows a historical predecessor series back to 1871. The early parts are not prices of today's index published at the time. The Great Depression, the oil crisis, the dotcom crash and the financial crisis leave clear marks in the chart, with long bear markets and heavy losses. In this chart they did not end the long rise.
The annualized price growth depends on the period you pick. From the end of 1949 to 29 September 2026 it comes to about 8.31 percent a year. Since the end of 1995 it is 8.55 percent, since the end of 2005 about 9.15 percent. Each figure is the geometric annual growth rate of the price index, without dividends. The two shorter periods cover about 30¾ and 20¾ years.
Losing years are part of it. From 1986 to 2025 the S&P 500 closed the year lower ten times, counting the almost flat year 2011. The deepest fall came in 2008 with 38.5 percent, and in 2022 it lost 19.4 percent.
At the annualized price growth since the end of 1995, the S&P 500 would reach about 10,900 points at the end of 2030. The calculation starts from the close of 29 September at 7,670.84 points with 8.55 percent a year. In ten years, in autumn 2036, that would be about 17,400 points.
Small differences in the rate make big differences in the result. At 6 percent a year it would be about 9,800 points at the end of 2030, at 10 percent about 11,500. For 2036 the range runs from 13,700 to 19,900. These are conditional calculations, not price targets. A crash like 2008 could push any of these numbers back by years or put them out of reach.
Bull case and bear case: both hang on the same levels
The current chart allows two clearly separated scenarios, and both depend on the same price levels. The all-time high at 7,817 and the June high at 7,621 decide which one plays out.
Bull case: a daily close above the record at 7,817
If the S&P 500 closes above 7,817 points on a daily basis, the sideways phase is resolved to the upside. The upper side of the triangle is then broken, and above the all-time high there is no old resistance left. The next target is the round number 8,000. The year-end targets of Citigroup and HSBC at 8,100 points lie just above it. A weekly or monthly close above the record would confirm the breakout. A continued strong earnings season and a Fed that pauses after the September rate rise would support it.
Bear case: losing the June high at 7,621 again
If the S&P 500 loses the June high at 7,621 again and does not reclaim it quickly, the August breakout would have failed. The next supports are the short-term trend line near 7,565 and the September low at 7,508. Below that waits the July low at 7,314 points. Because the June high is also the half-year high, the longer-term picture would get clearly worse as well. A weekly close below 7,314 would be the next, more serious warning stage. Below that, the green long-term uptrend line near 7,100 comes into focus in my chart reading. Triggers could be further Fed rate rises, disappointing numbers from the big tech companies or weaker market breadth.
What is the S&P 500 index?
The S&P 500 (Standard & Poor’s 500) is a stock index of 500 leading US companies, selected by S&P Dow Jones Indices according to set criteria and weighted by float-adjusted market capitalization.
The index covers about 80 percent of the available US stock market capitalization. It was launched in 1957 and serves as the central benchmark for the US stock market. All eleven sectors of the US economy are represented, from technology and health care to energy and financials.
An S&P 500 forecast is an assessment of the likely price performance of the US benchmark index for a defined period, based on technical and/or fundamental analysis.
For traders the S&P 500 matters because it works as a mood gauge for the whole world economy. Moves in the SPX often affect other indices such as the DAX and the Nasdaq 100. What is traded are products on the index, such as ETFs, futures and options. Trading hours, liquidity and costs depend on the product you choose; the SPX analyzed here is the calculated index level.
Key drivers for the S&P 500 forecast
Besides chart analysis, several other factors act on the S&P 500. They are fundamental and macroeconomic, and they often trigger the moves at the levels above.
- Federal Reserve rate policy: the Fed’s rate decisions directly affect how stocks are valued. On 16 September 2026 the Fed raised its key rate to 3.75 to 4.00 percent. Rate rises tend to increase the pressure for a correction, rate cuts tend to support the stock market. Where rates go from here is covered in our Fed interest rate decision post.
- Company earnings and earnings season: the quarterly reports of the companies in the index give fundamental impulses. According to FactSet, as of 25 September, 86 percent of companies beat earnings estimates in the second quarter of 2026.
- Geopolitics: conflicts, trade disputes and regulatory changes can change risk appetite abruptly and raise volatility. In such phases safe havens such as gold can be in demand, while stock indices can come under pressure.
- Inflation and economic data: labor market reports, consumer prices and GDP data shape rate expectations and with them the valuation of the stock market.
- AI and the technology sector: the price performance of the big tech stocks, above all the so-called “Magnificent Seven”, has an outsized influence on the whole index because of their high weighting.
The next big quarterly expiration day is on 18 December 2026. Around such dates, repositioning can raise trading volume. Bigger price swings are not guaranteed by it, and the exact settlement times depend on the product.
How this forecast is made
The forecast comes almost entirely from technical analysis, read from the top down. I start with the yearly and half-year chart, move through the monthly and weekly chart to the daily chart and check the details on the hourly chart. The larger time frames give the levels, the smaller ones the timing. How we find those levels is explained in our guide on support and resistance.
The levels come from real highs and lows. A monthly, half-year or yearly high sends a signal to many market participants. Where several factors meet, such as an old high and a trend line, a level gets stronger. On top come gaps and round numbers such as 8,000.
How to read the charts:
- Yellow dashed lines: support and resistance from earlier highs and lows, with the value at the right edge.
- Green line: long-term uptrend line, from the April 2025 low to the March 2026 low.
- Blue line: medium-term uptrend line, from the March 2026 low through the July low.
- White line: short-term uptrend line, from the July low to the September low.
- Red line: falling line from the all-time high, the upper side of the triangle.
- Orange line: the half-year high at 7,621 on the half-year and yearly chart.
Economic dates are part of the picture. The forecast for the coming days takes into account the dates where higher volatility can be expected. This page follows our editorial policy. More forecasts from our team are in the forecast overview.
Conclusion: where is the S&P 500 heading?
In my assessment, the S&P 500 is neutral in the short term and remains in a longer-term uptrend. The all-time high at 7,817 and the June high at 7,621 define the main decision levels. The charts show consolidation, with brief dips below the June high rather than a consistently unbroken support level.
For me the June high at 7,621 is the level where everything is decided. As long as it holds, I expect a new run at the all-time high and at 8,000. If it is lost again and not reclaimed quickly, the August breakout has failed, and then the longer-term chart picture gets worse as well.
The scenarios are my personal assessment, not investment advice. Always trade with a position size that fits your risk management.
Frequently asked questions about the S&P 500 forecast
What is the current S&P 500 forecast?
The current S&P 500 forecast is neutral in the short term. The index has been moving sideways around the June high at 7,621, with brief dips below it. A daily close above 7,817 would support a move toward 8,000. A renewed loss of 7,621 that is not quickly reclaimed would weaken the breakout picture.
Will the S&P 500 keep rising?
The long-term uptrend is intact on the weekly, monthly and yearly chart. In the short term there is no direction: the index swings between the all-time high at 7,817 and the June high at 7,621. As long as the June high holds, I expect a new run at the all-time high.
Why is the S&P 500 falling today?
This forecast does not identify a news cause for a single day. Single down days say little about the trend. What matters is whether the index loses an important support along the way. Right now those are the June high at 7,621, the short-term trend line near 7,565 and the September low at 7,508. In the background are the Fed rate rise of 16 September and the question of how broadly single stocks carry the rise.
How will the S&P 500 develop in 2026?
Since the start of the year the index is up about 12 percent. The published year-end targets range from 7,400 points (Bank of America) to 8,100 points (Citigroup, HSBC), about minus 3.5 to plus 5.6 percent against the close of 29 September. In chart terms the year stays positive as long as the half-year high at 7,621 holds. Above it a test of 8,000 is possible.
Where will the S&P 500 be in 10 years?
At the annualized price growth since the end of 1995, 8.55 percent a year without dividends, the index would reach about 17,400 points in autumn 2036. At 6 percent it would be about 13,700, at 10 percent about 19,900 points. These are calculation examples, not price targets: a crisis like 2008 can shift such numbers by years.
Which factors influence the S&P 500 forecast?
The most important factors are Federal Reserve rate policy, company earnings in the earnings season, geopolitics and economic data. On top comes the high weight of the big technology stocks, which move the whole index more than their number suggests. Interest rates and earnings matter most over the coming months.
Please note
The scenarios are a personal assessment based on experience and are not a certainty. This is market analysis, not investment advice. Trade only with a position size that fits your own risk management.
This forecast is translated from the German edition on kagels-trading.de.
How our forecasts are made and reviewed: How we work.