
Silver Price Forecast: This Week, Next Week and 2026
Silver forecast in 30 seconds
Where the price stands
$61.56 at 15:33 CEST, just above the March low at $61.21. Since September 28 silver has been swinging around this level.
Short term
Little movement, but a breakout is coming and could have force. The odds currently lean to the upside.
The level above
The resistance at $62.45, reached twice. Above it lies $65.505, where the downtrend line currently runs as well.
The levels below
A daily close below $61.21 opens $56.705 and the 2026 low at $55. Next review: Monday, earlier if silver breaks out.
On this page
- Silver forecast in 30 seconds
- Silver today: little movement at the March low
- Silver this week: swinging around the March low
- Will the silver price explode? Three paths for the next days
- Silver next week: a break out of the sideways range
- The monthly chart: the picture is clouding over
- Silver forecast to 2030: the next big supports
- What banks expect for silver in 2026 and 2027
- Silver future or XAG/USD: which price counts here
- Conclusion: little movement, a breakout is coming
- Frequently asked questions about the silver price forecast
- Please note
Silver today: little movement at the March low
For Tuesday, 6 October 2026
 Click to enlarge
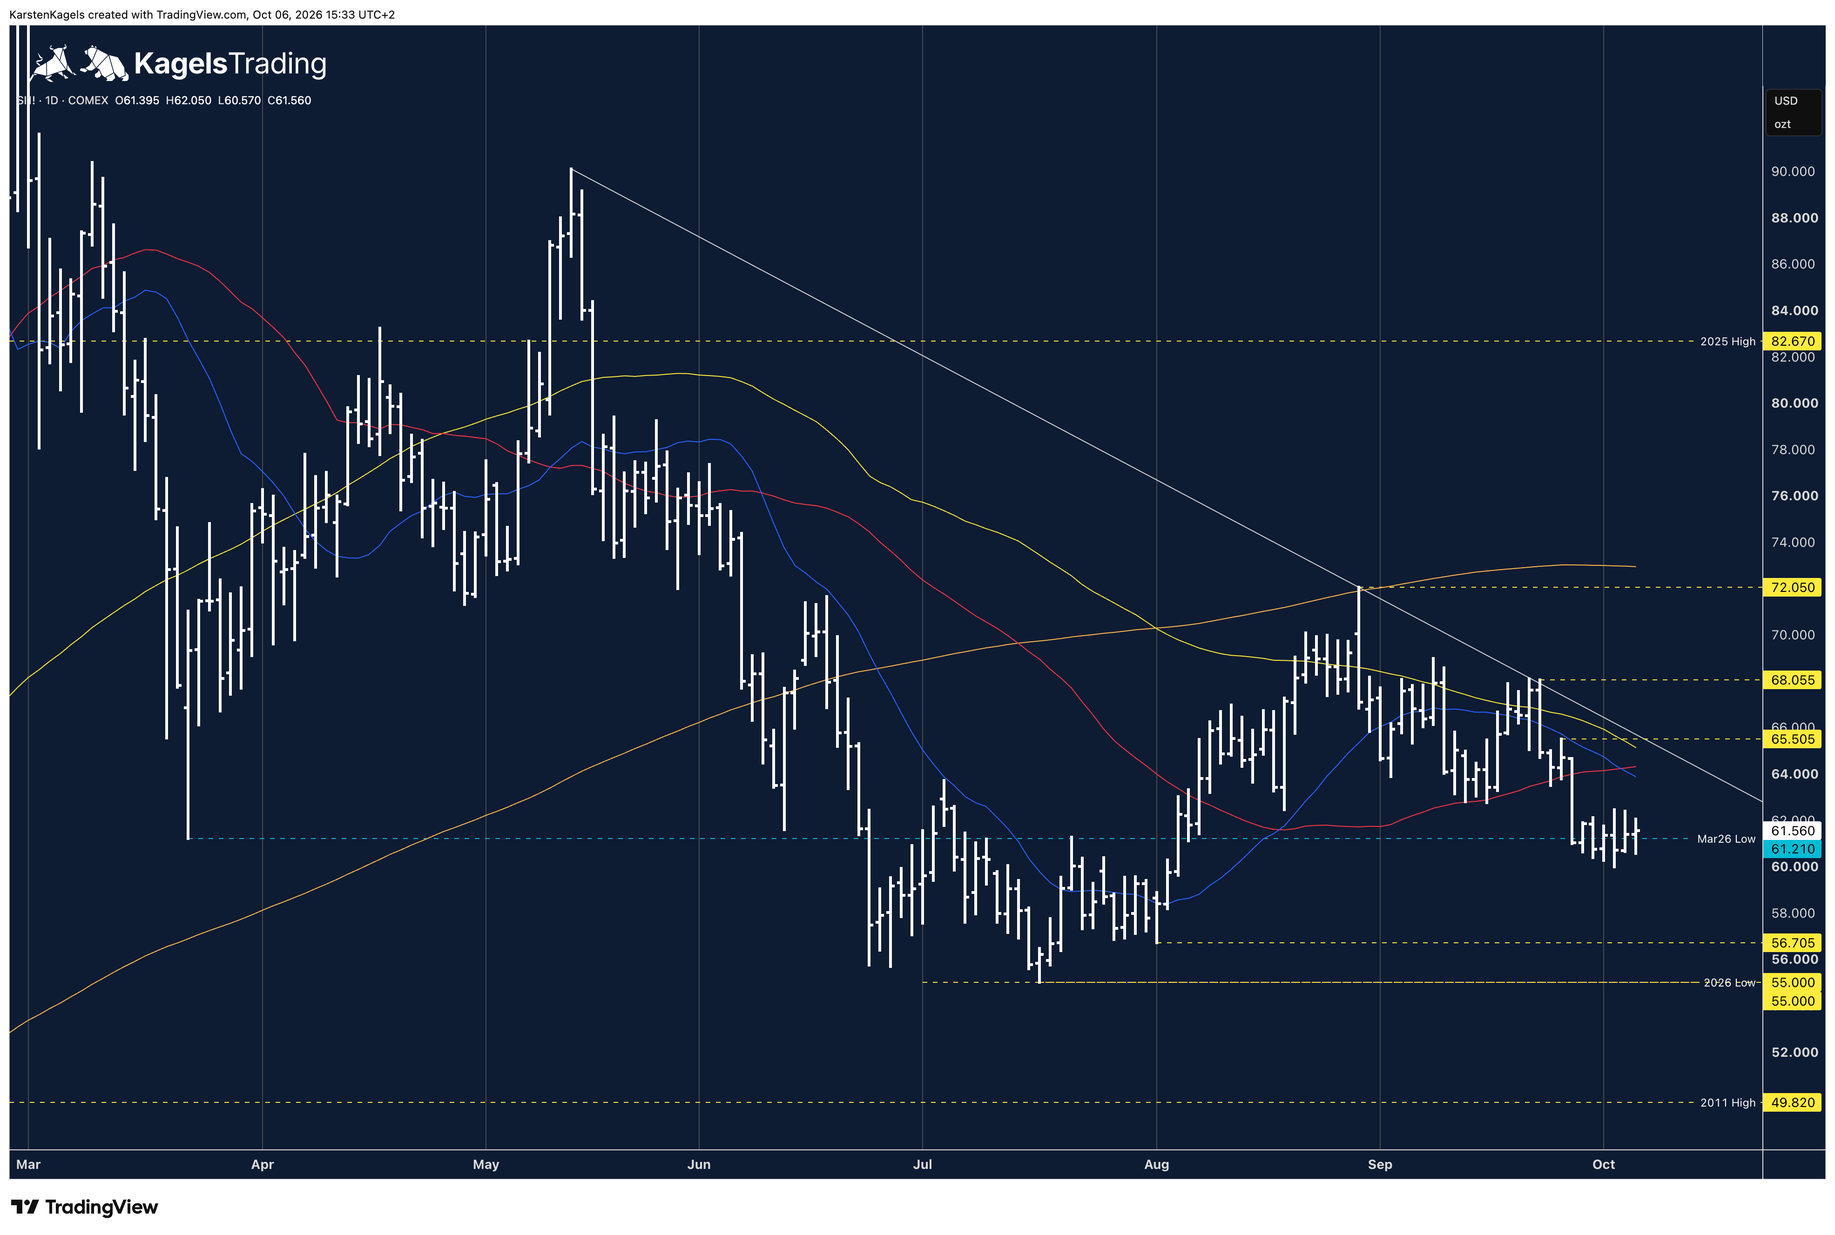
In the daily chart silver has barely moved since September 28. The daily bars sit in a narrow sideways phase between about $60 and $62.45. Today silver opened at $61.395, rose to $62.05 and fell to $60.57; at 15:33 CEST it trades at $61.56.
The daily close keeps crossing the March low. On Friday, October 2, silver closed below the level of $61.21, and on Monday back above it. That is not a confirmed break to the downside; under the rules below, the state is currently wait.
The medium-term downtrend line still caps the market. It is drawn in white, starts at the May high and runs at about $65.5 today; silver failed at it in August and September. Important support and resistance levels sit above and below the market, among them the 2025 high at $82.67 and the 2011 high at $49.82.
Resistance
- $72.05
- $68.055
- $65.505
Price at analysis$61.56
Support
- $61.21
- $56.705
- $55
Silver this week: swinging around the March low
For Tuesday, 6 October 2026
 Click to enlarge
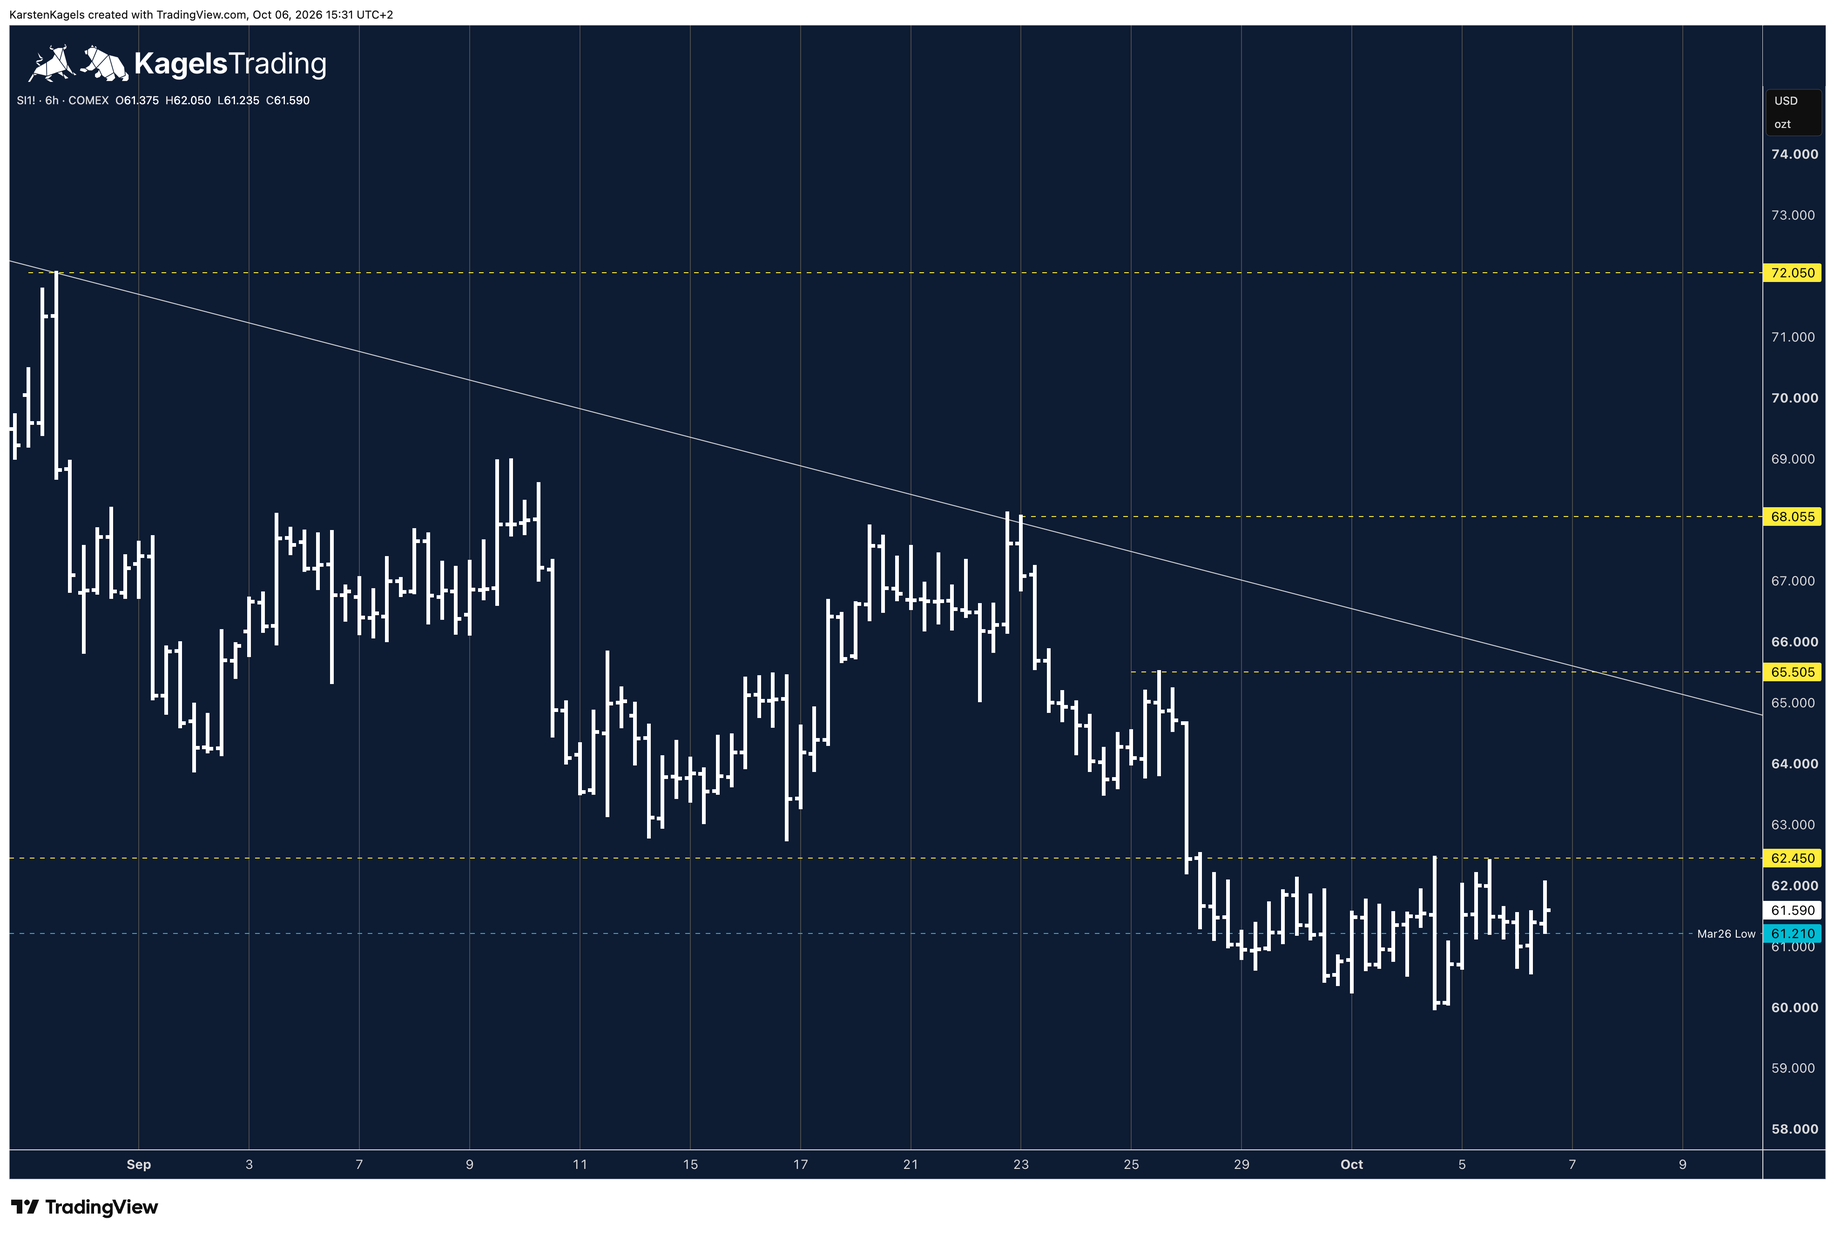
In the six-hour chart silver keeps swinging around the March 2026 low. The level at $61.21 sits in the middle of the range of recent days. On October 2 and October 5 the price rose to the resistance at $62.45 and did not get above it; the low of October 2 at $59.985 has not been reached again since.
There is little movement in the market overall, but a breakout will come. It could also have force. The odds currently lean to the upside; that is only confirmed by a daily close above $62.45. Above it, $65.505 and the downtrend line sit close together.
Resistance
- $68.055
- $65.505
- $62.45
Support
- $61.21
- $56.705
- $55
Will the silver price explode? Three paths for the next days
For Tuesday, 6 October 2026
An explosion cannot be read from the chart, but a strong breakout is possible. Three conditions describe which way it leads. Each names what has to happen and what ends it; they are orientation levels, not order rules. The odds currently lean to the upside.
What counts is the daily close in the SI1! chart shown above. That means the day's settlement price, which TradingView shows as the close for futures by default. A close exactly on a level does not count as confirmed. The weekly close comes on top as extra confirmation.
The current state is wait. The daily close on October 2 was below $61.21 and confirmed the bearish path; the close on October 5 was back above it and ended that path.
No scenario is a guaranteed price target. They are conditional chart readings, and trading can lead to losses.
Bearish: below the March low
Condition: a daily close below the March low at $61.21. The level at $56.705 and the 2026 low at $55 are then the next targets. The path ends on a following daily close back above $61.21. Last confirmed on October 2 and ended on October 5.
Wait: neither bearish nor bullish confirmed
Condition: every daily close that meets neither the bearish nor the bullish condition. That means between $61.21 and $62.45. There is no target then. This has been the state since the daily close on October 5. It ends with a daily close below $61.21 (bearish) or above $62.45 (bullish). No setup is a result too.
Bullish: above $62.45
Condition: a daily close above $62.45. That opens the way to $65.505, where the white downtrend line from the May high currently runs as well. The odds currently lean toward this path. The picture only turns positive above the September high at $68.98. The path ends on a daily close back below $62.45.
Resistance
- $68.98
- $65.505
- $62.45
Support
- $61.21
- $56.705
- $55
Silver next week: a break out of the sideways range
Week of 28 September 2026
 Click to enlarge
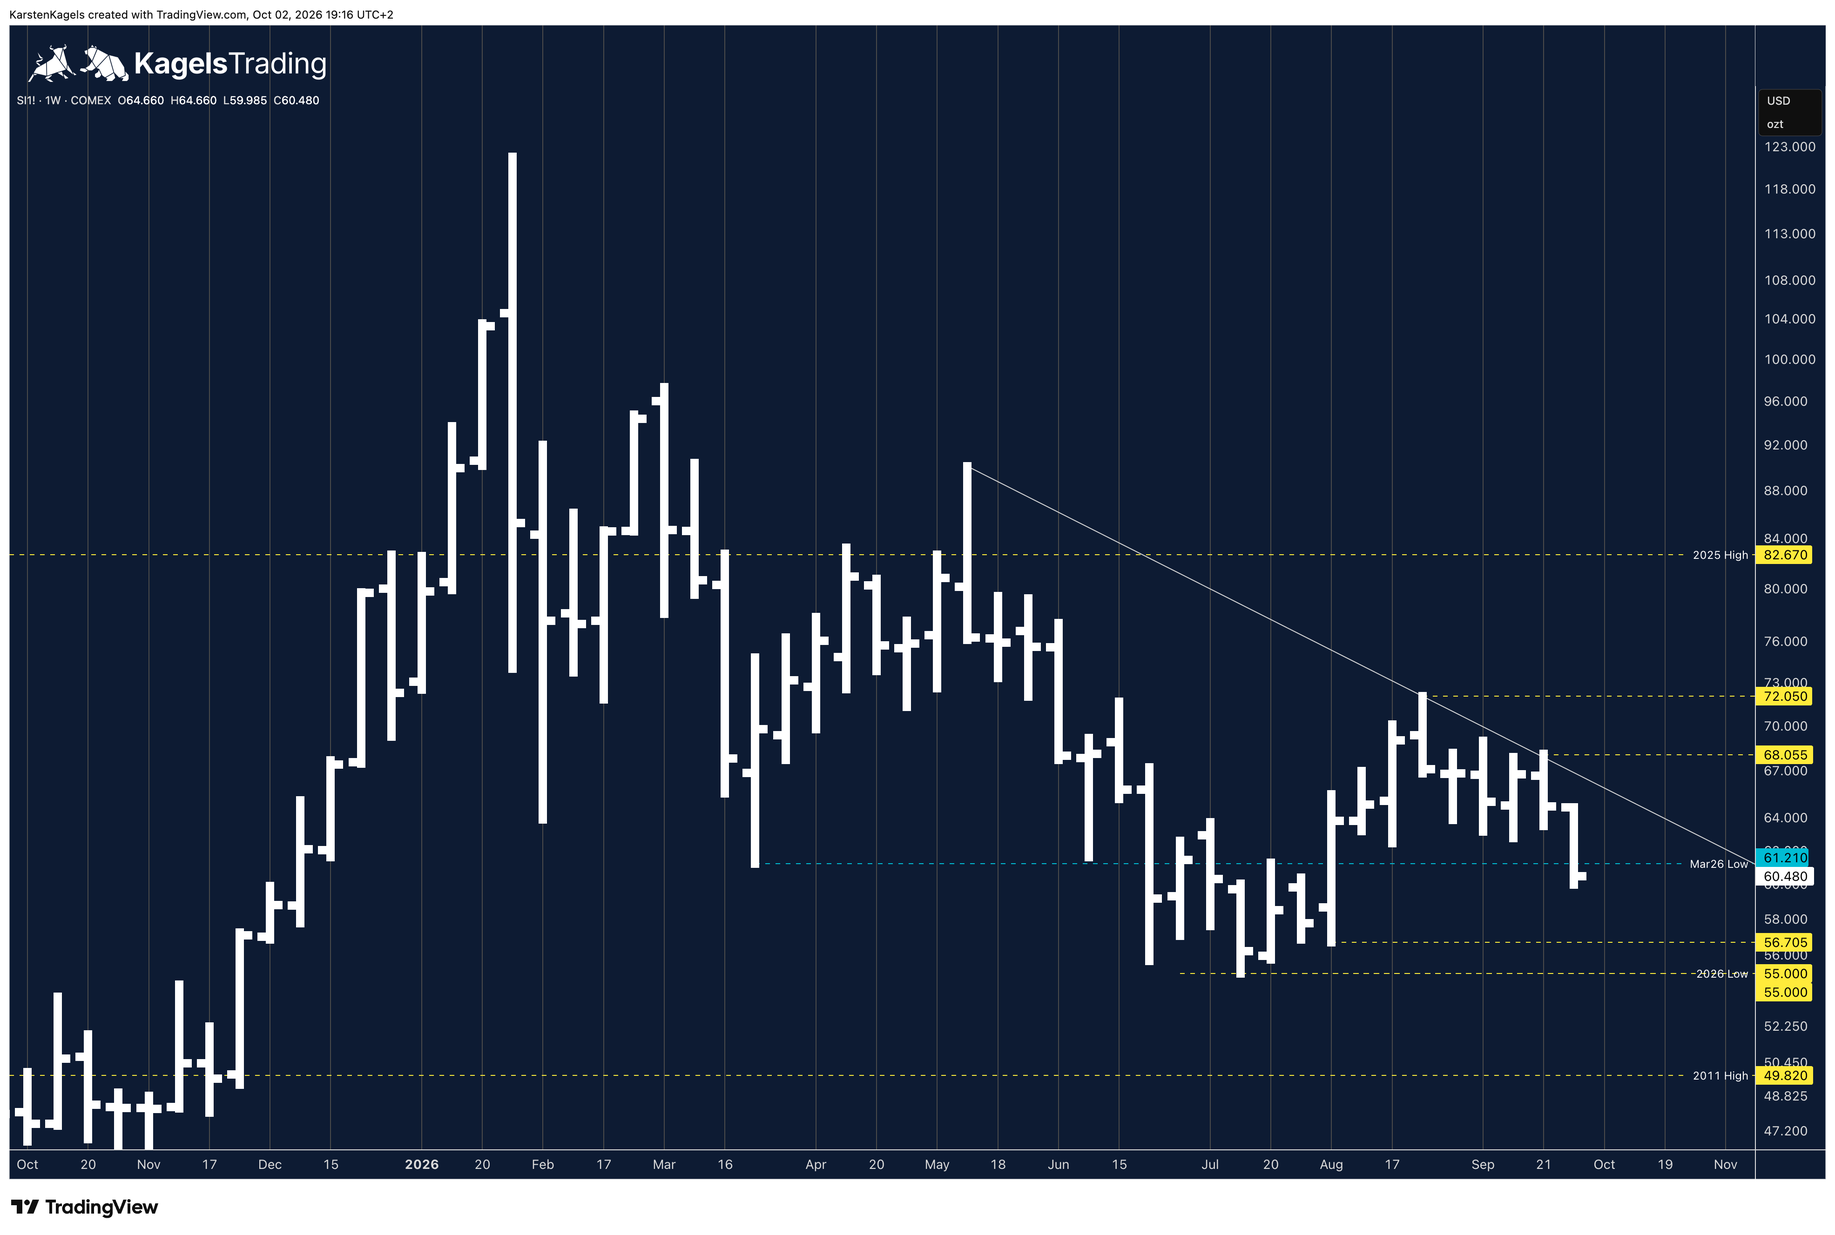
In the weekly chart silver has broken out of a sideways range of several weeks to the downside. This is the chart of October 2; the week closed below the March low. The price target to the downside remains the 2026 low at $55, with $56.705 on the way. It only becomes valid again with a daily close below $61.21, because silver has traded above it since Monday.
Only a rather unlikely rise above the September high would turn the chart picture positive. The September high is $68.98 (header of the monthly chart of 28 September; the week from 28 September only reached $64.66), with the resistance levels at $65.505 and $68.055 below it.
On October 2 the US jobs report moved the price. According to the Bureau of Labor Statistics, September added only 29,000 jobs; according to FXStreet about 90,000 were expected. Kitco linked the rise in silver afterwards to a lower probability of a rate hike in October. According to BullionVault silver gave the gain back during the day.
The next important dates: the minutes of the Fed meeting of 15 and 16 September on Wednesday, 7 October, at 2 pm New York time (20:00 CEST), according to the Federal Reserve calendar; US consumer prices for September on 14 October at 8:30 am New York time (BLS schedule); and the next Fed meeting on 27 and 28 October, covered in our Fed rate decision guide.
The monthly chart: the picture is clouding over
 Click to enlarge
This part is written for readers who look beyond the week. It is reviewed at the start of the month, not daily.
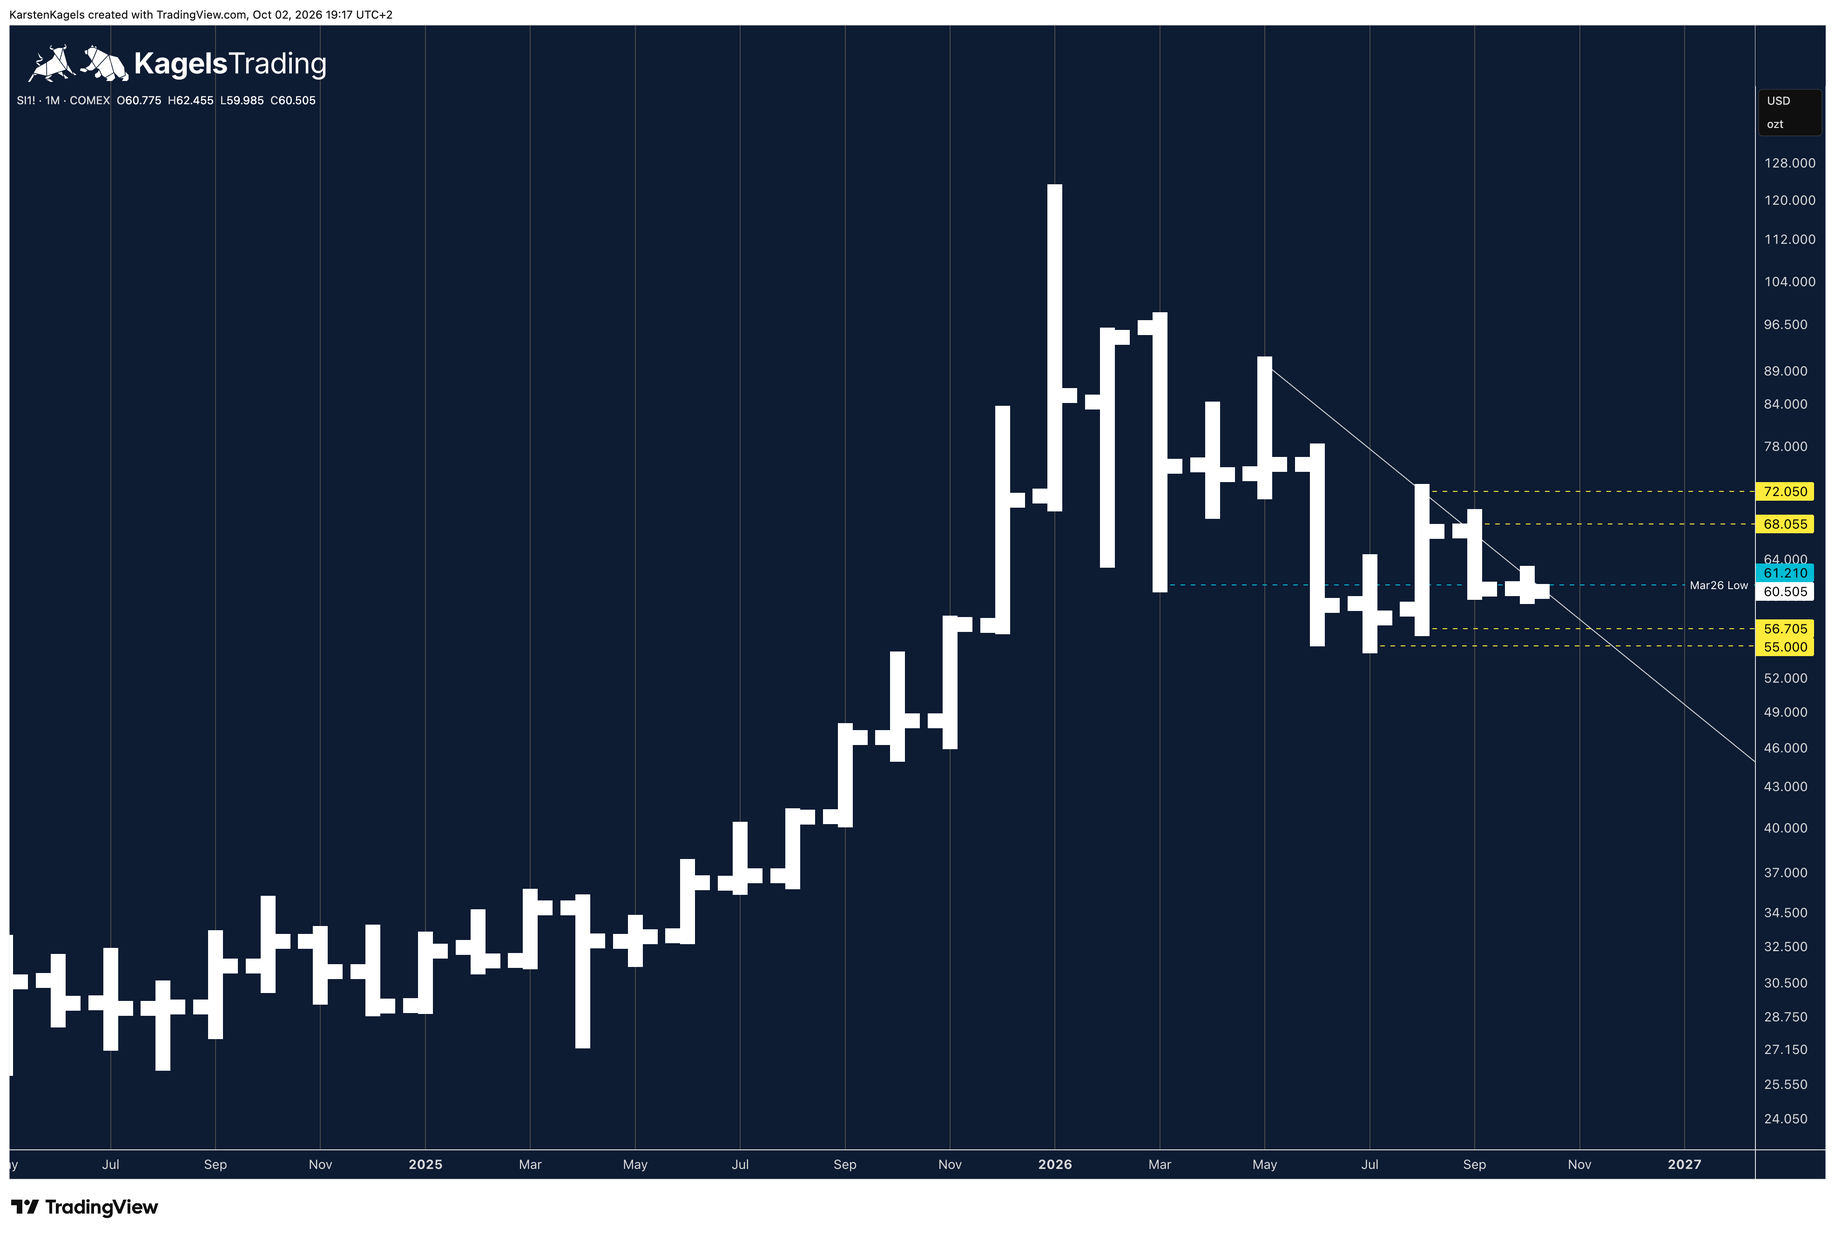
The long-term picture in the monthly chart is clouding over. The consolidation in the form of a large sideways range in 2026 is clearly visible, with lower highs: most recently at $72.05 in August and at $68.98 in September. Below, the March low and the 2026 low at $55 limit the range.
Resistance
- $72.05
- $68.055
Support
- $61.21
- $56.705
- $55
Silver forecast to 2030: the next big supports
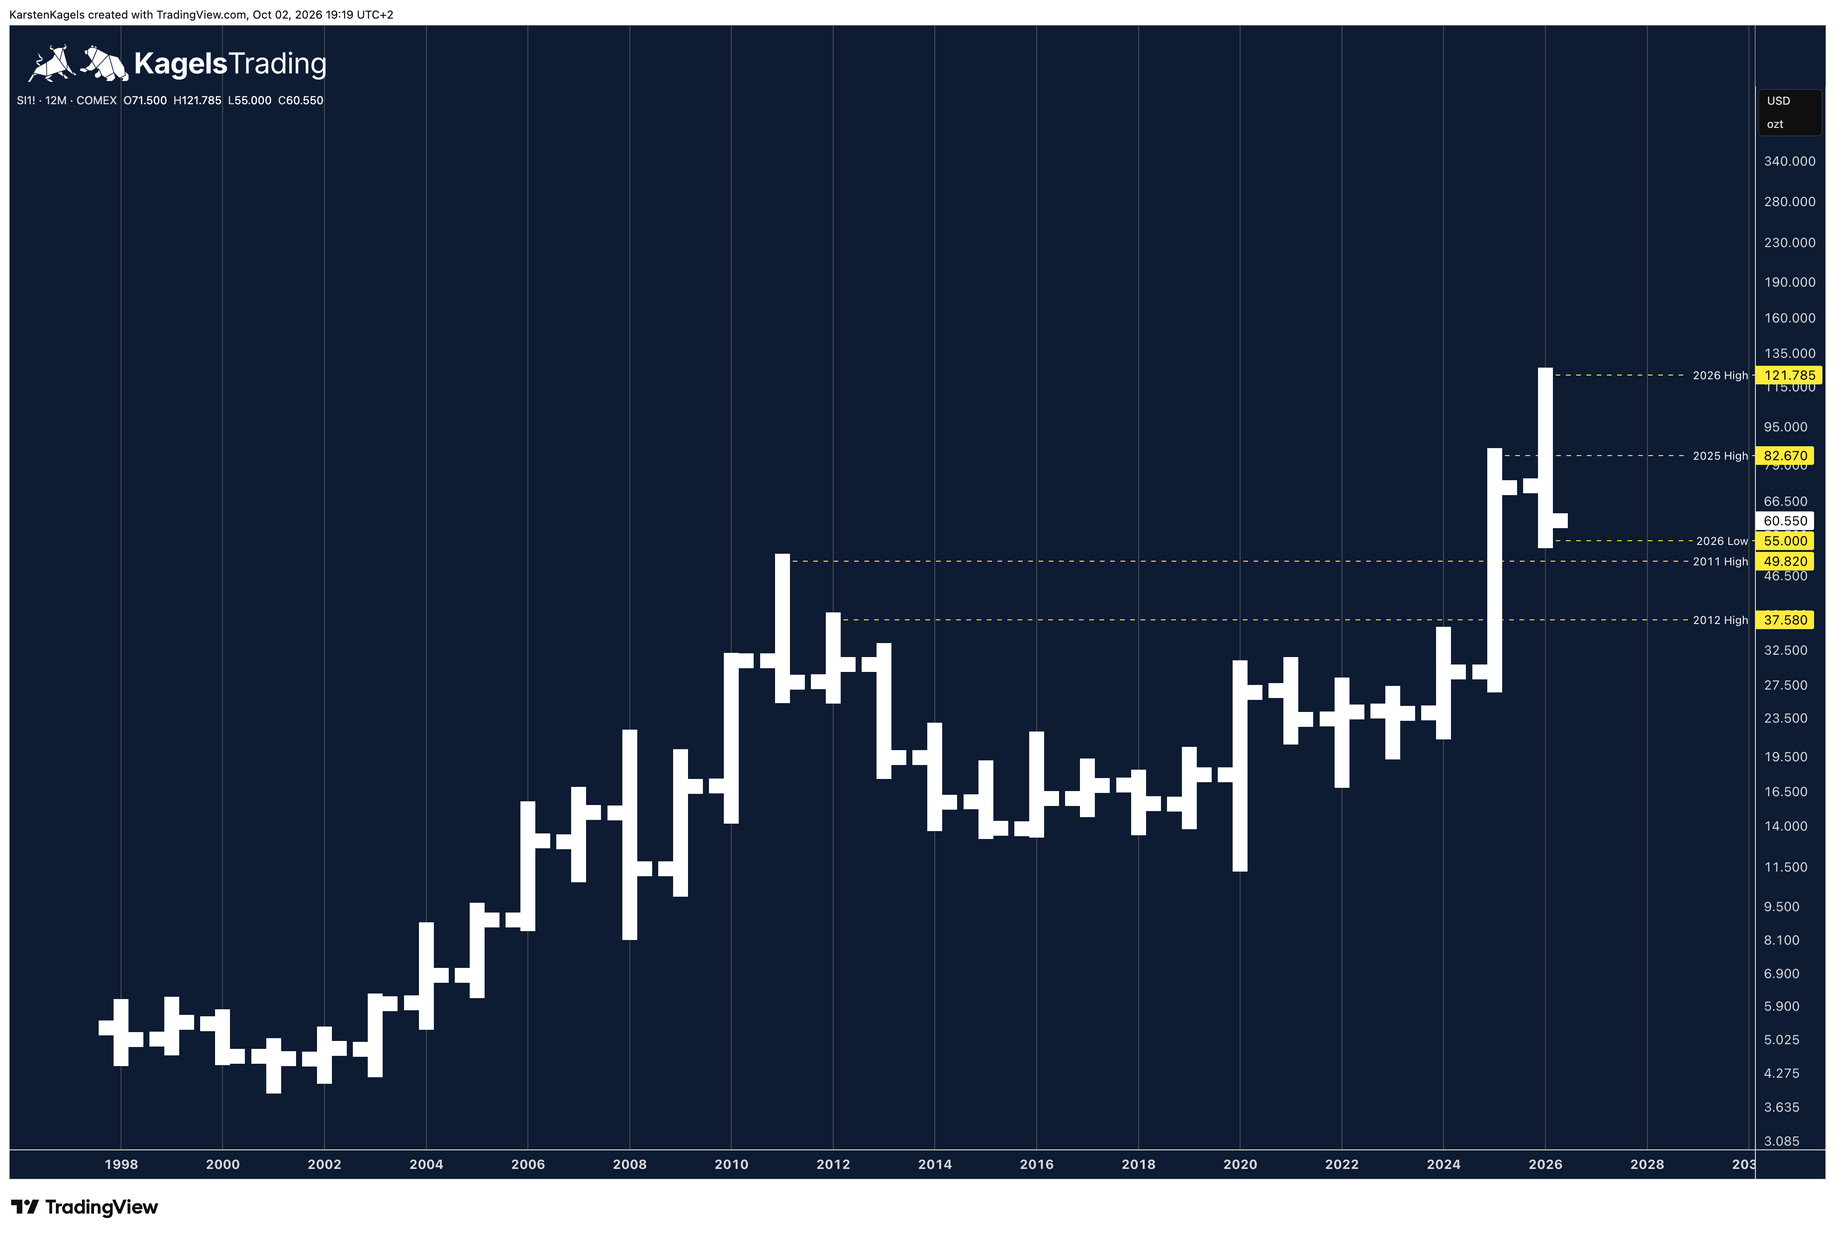 Click to enlarge
The yearly chart shows the next two important supports. They are the 2011 high at $49.82 and the 2012 high at $37.58. The year 2026 opened at $71.50, ran to the all-time high at $121.785 and fell to $55.
For 2028 what matters is whether these supports hold. A price target for 2028 cannot be derived from the chart in a serious way. As long as silver stays above the 2011 high, the long-term uptrend is not at risk; below it the 2012 high at $37.58 comes into view.
I do not give a fixed price target for 2030. Four years are a long time in the silver market, and in 2026 alone the distance between high and low was more than half the price. What counts for me is whether the big supports hold. On the fundamental side, according to the Silver Institute, the market was in a supply deficit every year from 2021 to 2025.
Resistance
- $121.785
- $82.67
Support
- $55
- $49.82
- $37.58
What banks expect for silver in 2026 and 2027
J.P. Morgan and Commerzbank cut their silver forecasts over the summer. The table shows selected forecasts with their date, not a complete overview. Bank forecasts refer to the spot price; I use them as a sentiment gauge, not as trading levels.
| Bank | Forecast | As of |
|---|---|---|
| J.P. Morgan | Q4 2026 average: $63; 2027 average: $63.90 | 13 Aug 2026 |
| UBS | Dec 2026: $70; Sep 2027: $80 | 8 Sep 2026 |
| Commerzbank | End 2026: $67; end 2027: $80 | 29 Jul 2026 |
| Citi | to mid-Nov 2026: $75; to Aug 2027: $90 | 14 Aug 2026 |
The other metals have their own pages. The gold price forecast, the platinum price forecast, the palladium price forecast and the copper price forecast use the same method.
Silver future or XAG/USD: which price counts here
XAG/USD is the spot price for one troy ounce of silver in US dollars; the silver future on COMEX is a futures contract on 5,000 troy ounces with a fixed delivery date.
All levels on this page come from the silver future. Karsten analyses the SI1! continuous series, which always shows the front contract, in TradingView; a trade is always placed in a contract with a fixed delivery month. The gap to the spot price is not fixed: it depends on time to expiry, interest rates and the contract roll.
If you trade XAG/USD or a CFD, match the levels to your own instrument. The best way is to put your broker’s chart next to these charts and carry the levels over to its prices, rather than assuming a fixed gap.
Conclusion: little movement, a breakout is coming
Silver is swinging around the March low, and a breakout is coming. Since September 28 the price has barely moved; the daily close has crossed the March low at $61.21 several times, and the resistance at $62.45 has held twice. The odds currently lean to the upside, which is only confirmed by a daily close above $62.45.
The longer view is clouding over. The monthly chart shows lower highs, and the yearly chart names the 2011 high at $49.82 and the 2012 high at $37.58 as the next big supports. Only above the September high at $68.98 would the picture turn positive.
Frequently asked questions about the silver price forecast
How will the silver price develop next week?
Silver is swinging around the March low at $61.21, and a breakout is coming (6 October 2026). The odds lean to the upside: a daily close above $62.45 opens the way to $65.505. A daily close below $61.21 would instead put $56.705 and the 2026 low at $55 in focus.
Will the silver price keep falling?
That is open (6 October 2026). Since September 28 silver has been swinging around the March low at $61.21; the daily close on October 2 was below it, the one on October 5 back above it. Only a new daily close below $61.21 puts $56.705 and the 2026 low at $55 in focus. Below that follow the 2011 high at $49.82 and the 2012 high at $37.58.
When will silver go up again?
A first signal would be a daily close above $62.45 (6 October 2026). Then $65.505 is the next target, where the downtrend line from the May high currently runs as well. The chart picture only turns positive above the September high at $68.98.
Will the silver price explode?
An explosion cannot be read from the chart (6 October 2026). In my view a breakout will come that could have force, and the odds lean to the upside. Since the all-time high at $121.785 in January 2026, silver has been in a large sideways range with lower highs. A new rally first needs a rise above the September high at $68.98, and even then it is not a guaranteed target.
What will silver cost in 2030?
There is no serious point forecast for 2030. What matters is whether the big supports in the yearly chart hold: the 2026 low at $55, the 2011 high at $49.82 and the 2012 high at $37.58. Bank forecasts so far only reach 2027.
What is the difference between the silver future and XAG/USD?
XAG/USD is the spot price for one troy ounce of silver in US dollars. The silver future on COMEX is a futures contract on 5,000 troy ounces with a fixed delivery date. The gap between the two is not fixed. The levels on this page come from the SI1! continuous futures series.
Please note
The scenarios are a personal assessment based on experience, not a certainty. This is market analysis, not investment advice. Keep your position sizes in line with your own risk management.
This forecast is translated from the German edition on kagels-trading.de.
How our forecasts are made and reviewed: How we work.