
EUR/JPY Forecast: Levels and the Yen Trend


This analysis is from 20 September 2026. Prices have moved since, so the levels below may no longer apply until the next update.
EUR/JPY forecast in 30 seconds
Where it stands
180.19 yen at the weekly close on 18 September 2026, about eight yen below the yearly high of 187.95.
Short term
Below all four daily moving averages; the pullback to the February low at 180.80 has failed. Downtrend on the weekly chart.
Next targets
The area around 175 yen, then 169.47.
Key resistance
A close above 181.78 would take the force out of the downward move.
On this page
- EUR/JPY forecast in 30 seconds
- EUR/JPY forecast, short term
- EUR/JPY forecast, medium term
- EUR/JPY forecast, long term
- The monthly chart and the view toward 2030
- What is the EUR/JPY currency pair?
- What moves the EUR/JPY rate
- Technical ratings
- Conclusion: EUR/JPY fails below 188.22 and corrects
- Frequently asked questions
EUR/JPY forecast, short term
 Click to enlarge
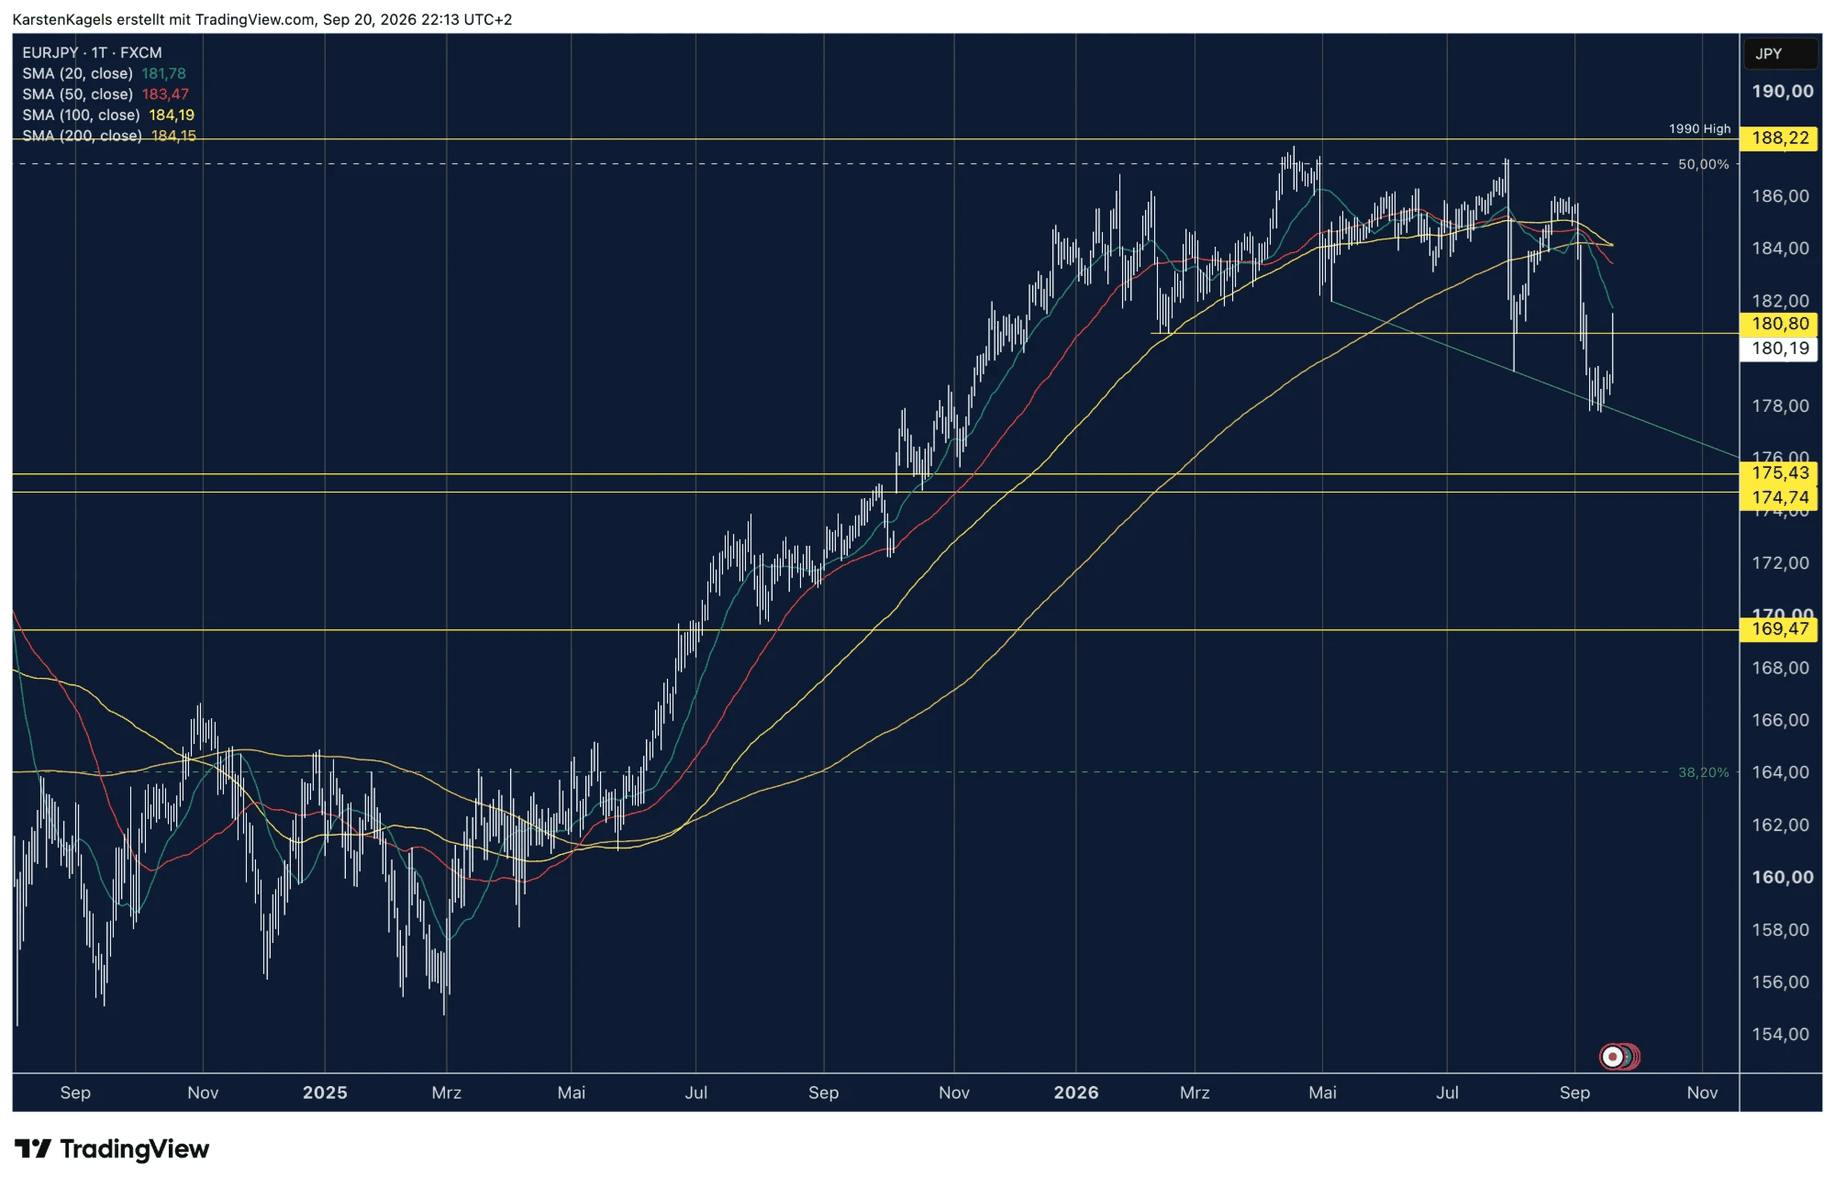
Looking back: on the daily chart, EUR/JPY trades below all four of the important moving averages. Above the price sit the 20-day line at 181.78, the 50-day line at 183.47, the 100-day line at 184.19 and the 200-day line at 184.15. When every average runs above the price, each rise is first of all a run against resistance.
Last week the price tried exactly that and did not manage it. There was a pullback toward the 20-day line and the February low at 180.80. A pullback is the counter move after a push down, with which a market tests the level it has left from below. On a weekly closing basis, however, EUR/JPY could not get above that level. The close was 180.19.
Outlook: as long as this recapture does not succeed, the short-term direction points down. The decisive area lies between 180.80 and 181.78. Only a close above it would ease the picture. If that does not happen, the area around 175 yen stays the next target, where the levels at 175.43 and 174.74 are waiting.
Resistance
- 184.15
- 183.47
- 181.78
- 180.80
Price at analysis180.19
Support
- 175.43
- 174.74
EUR/JPY forecast, medium term
 Click to enlarge
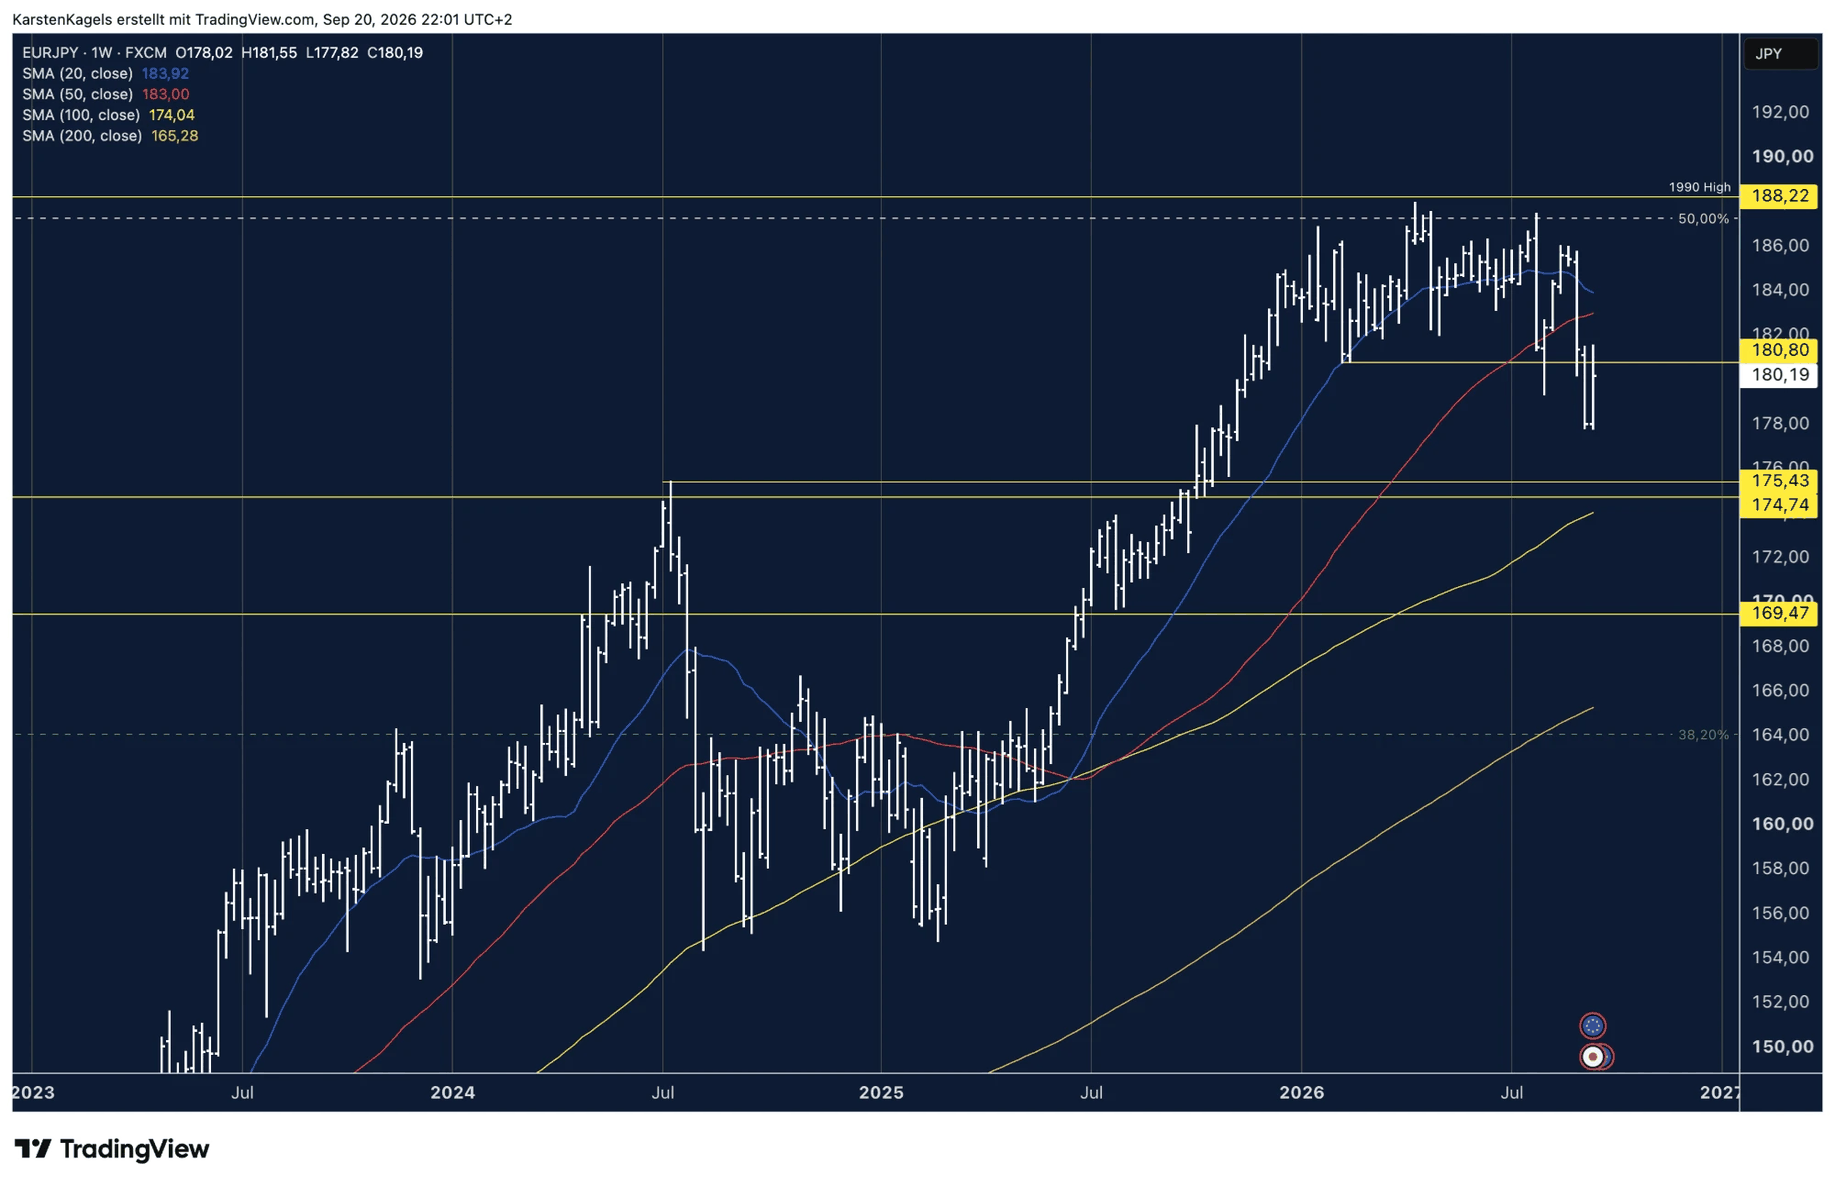
Looking back: the weekly chart shows how the price lost its strength below the resistance. After the run at the resistance zone below 188.22, EUR/JPY moved sideways for several weeks without reaching a higher level again. The pair has now broken out of that range to the downside. By definition, that means the weekly chart shows a downtrend.
The moving averages confirm the change. EUR/JPY has fallen below the 20-week line at 183.92 and the 50-week line at 183.00. Both now run above the price. The 20-week line has also started to turn down. A moving average is the mean of the last closing prices, and when it tips over, the direction of the recent move has already changed.
Outlook: what used to support now brakes from above. The next resistance is the February low at 180.80. Levels like this change their role: a level that carried the price for a long time becomes a hurdle once it breaks. At 180.19, EUR/JPY trades just below it, and that is where it will be decided whether the breakout holds.
My next target is the area around 175 yen. The horizontal levels at 175.43 and 174.74 lie there. A little below them, the 100-week line currently runs at 174.04. Together they mark a possible support area. Whether the price turns there remains to be seen. Below it, the next horizontal level is 169.47.
For 2027, the chart as it stands allows a conditional scenario, not a reliable year-end target. If EUR/JPY stabilises in the area around 175 yen, a recovery inside the long-term trading range stays possible, because the larger uptrend on the monthly chart is untouched. Below that area, the level at 169.47 comes into view first. On the upside, 188.22 remains the decisive resistance. This assessment has to be checked again against new price data.
Resistance
- 188.22
- 183.92
- 183.00
- 180.80
Support
- 175.43
- 174.74
- 169.47
EUR/JPY forecast, long term
 Click to enlarge
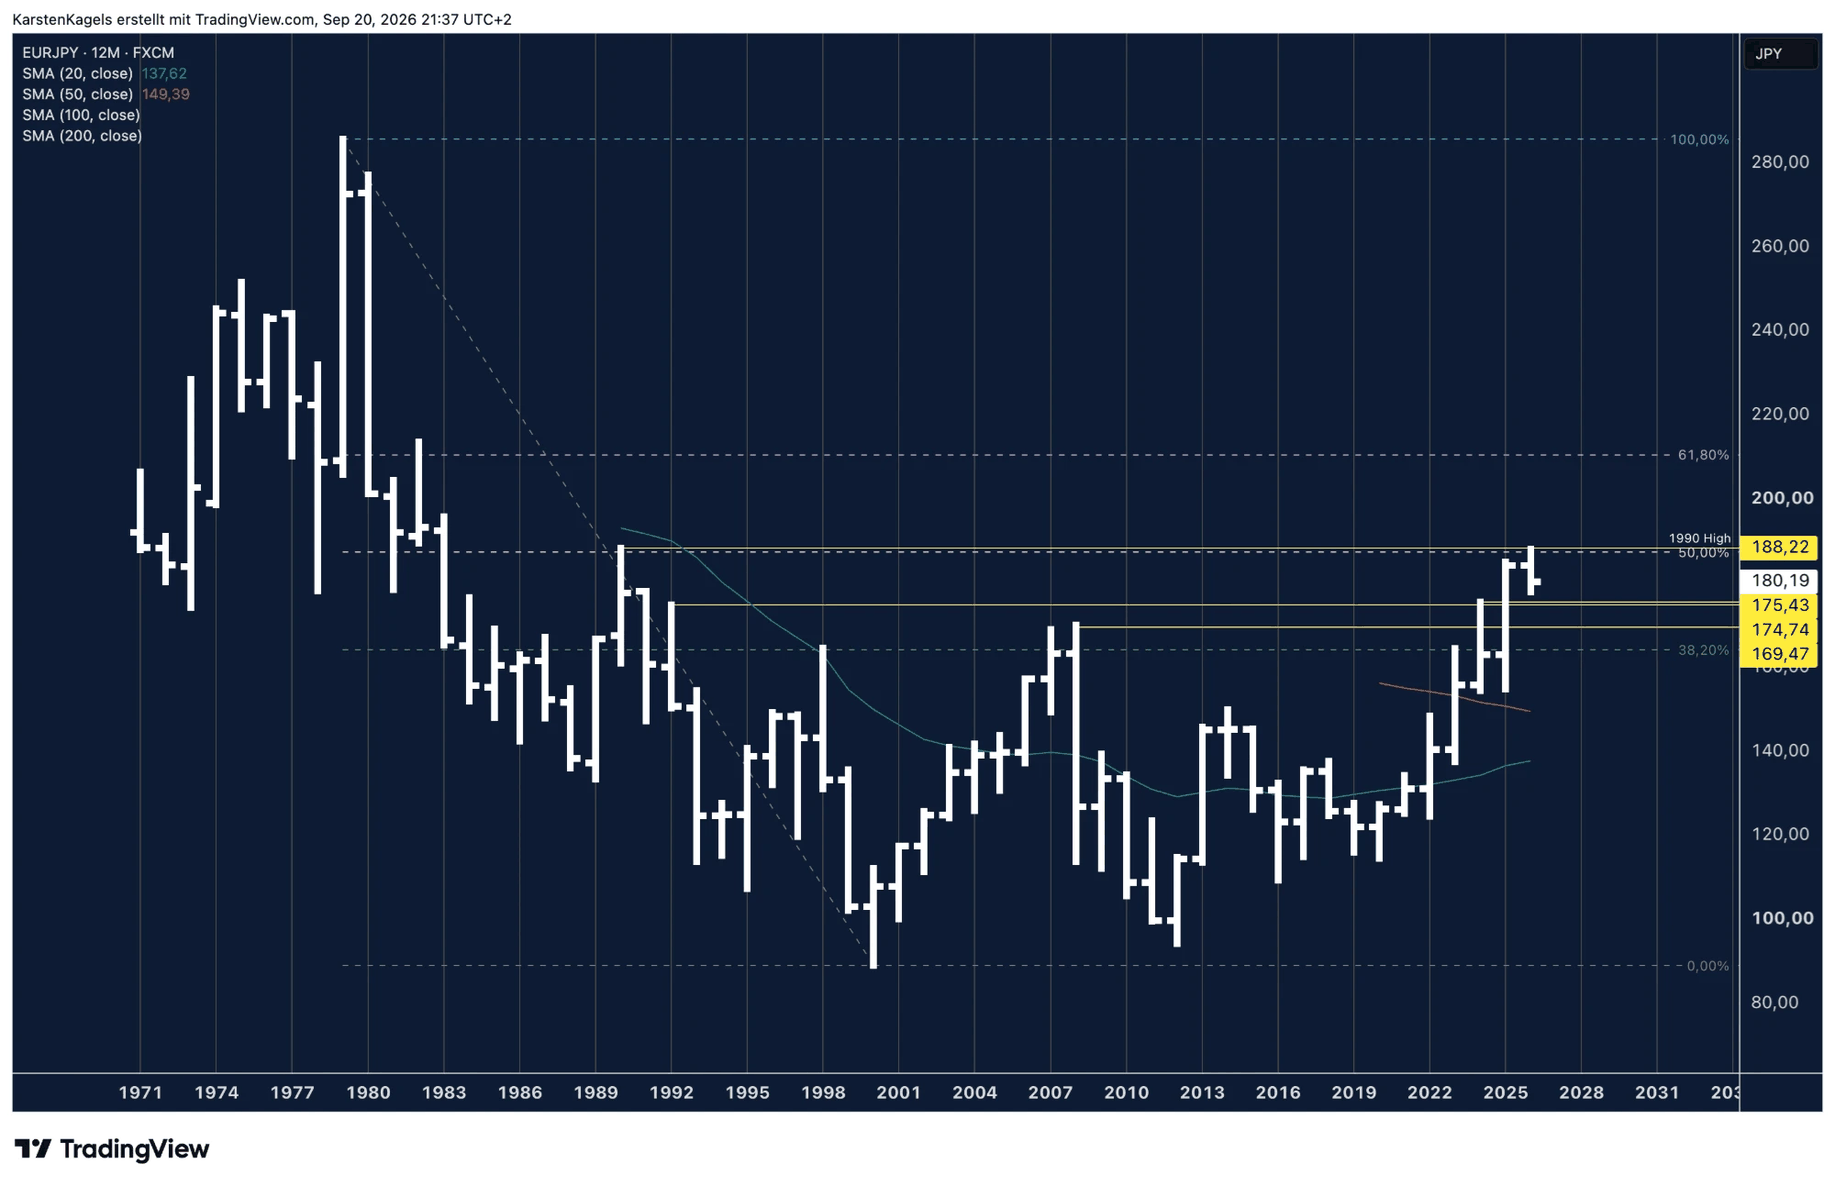
Looking back: the very long view splits into two phases, and both lasted decades. The historical price series used in the chart shows its high in 1979 at 285.56 and its low in 2000 at 88.97. More than twenty years of decline lie between them. Since then the counter move has been running upward, and in 2026 it reached two levels that are marked in the chart.
One note belongs with these old values. The euro has only existed since 1999. Prices before that are not EUR/JPY quotes that were traded at the time, they are the back-calculated pre-history of the series shown. As orientation for the large turning points they work, as tradable history they do not.
The two levels lie close together and form a resistance zone. The upper one is the high from 1990 at 188.22. Just below it runs the 50 percent retracement of the preceding downward move. Both are drawn separately in the chart. They lie less than one yen apart and therefore act as one connected area, not as a single line.
Outlook: the price ran into this zone in 2026 and failed there. The yearly high for 2026 is 187.95. EUR/JPY therefore got past the 50 percent retracement but stayed 0.27 yen below the 1990 high. For me that is the most important finding of the year: the uptrend of recent years met a resistance exactly there that has stood since 1990.
Resistance
- 188.22
Support
- 175.43
- 174.74
- 169.47
The monthly chart and the view toward 2030
 Click to enlarge
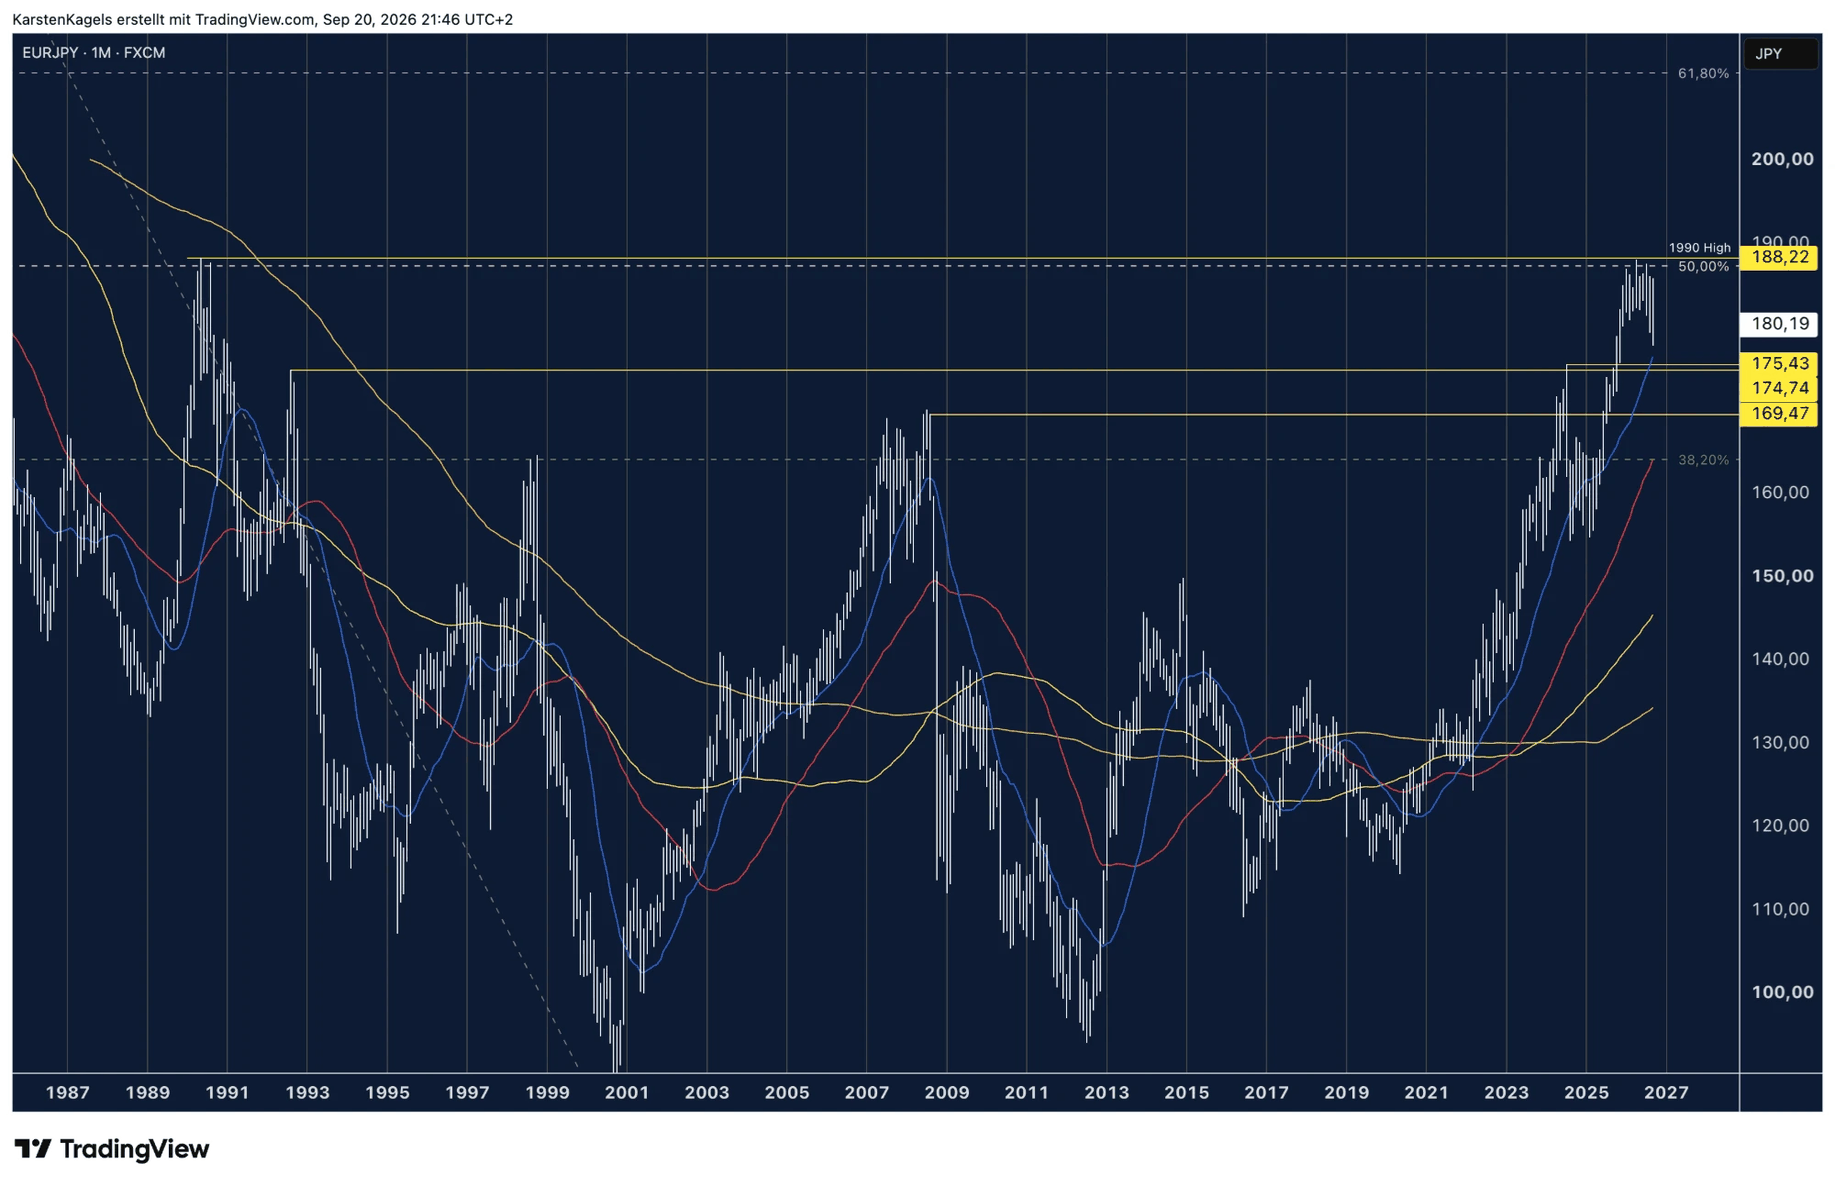
Looking back: the monthly chart shows the same situation one step finer. Since the high of 1990, EUR/JPY has been moving in a large sideways range. The advance from the low of 2000 up to the 2026 high can be seen here in detail. And the 50 percent retracement has proved itself as resistance several times this year, not just once.
Outlook: the uptrend is not broken in chart terms, it is interrupted. On the monthly chart EUR/JPY still trades above the 20-month moving average, and as long as that holds, the larger direction upward is not disproved. Below the current price there are several supports: first 175.43 and 174.74, and below them 169.47.
For the coming months I do not expect new highs. A further rise is unlikely in the short and medium term. If the euro weakness of recent months continues, a stronger correction of the preceding uptrend is the obvious path.
A reliable price forecast for 2030 cannot be derived from this chart. What matters for the long-term outlook is whether EUR/JPY gets above the resistance at 188.22 or stays below it. A monthly close above it would be a new technical signal, but no guarantee of lasting price gains. The supports that apply today serve as orientation and need to be assessed again regularly.
Resistance
- 188.22
Support
- 175.43
- 174.74
- 169.47
What is the EUR/JPY currency pair?
The EUR/JPY pair says how many Japanese yen one euro costs.
EUR/JPY is one of the most traded cross pairs without the US dollar, and it reacts especially strongly to the rate gap between the ECB and the Bank of Japan.
A cross pair is a currency pair without the US dollar. EUR/JPY connects two of the world’s most important reserve currencies. When the price rises, the euro gets stronger against the yen. When it falls, the yen gains value. For traders the pair is interesting because it often forms clear trends and reacts strongly to rate decisions.
The other side of the yen shows in USD/JPY. Anyone trading EUR/JPY keeps an eye on that pair, because moves in dollar-yen often carry over into euro-yen. That way, yen-specific impulses can be separated from pure euro moves.
What moves the EUR/JPY rate
The exchange rate depends on a few strong drivers. These are the ones to watch:
- The rate gap between the ECB and the Bank of Japan: the ECB deposit rate has been 2.50% since 16 September 2026. The Bank of Japan decided on 18 September to raise its policy rate to 1.25%, effective on 24 September. Once both decisions are in force, the gap is back at 1.25 percentage points, exactly as much as before the September moves. The yield advantage therefore stays with the euro, but it is no longer growing.
- Japan’s turn in monetary policy: the Bank of Japan is raising rates more clearly than at any time since the 1990s. That tends to support the yen and slows its long weakness.
- The carry trade: many investors borrow cheaply in yen and invest the money in higher-yielding currencies. This carry trade weighs on the yen as long as the rate gap stays wide.
- Currency intervention: Japan’s authorities watch a weak yen closely and have intervened in the currency market in the past. That is the biggest short-term risk for falling EUR/JPY prices.
- Risk appetite: in a crisis the yen counts as a safe currency. When uncertainty rises, the yen can appreciate quickly and weigh on EUR/JPY.
- Growth and inflation: data from the euro area and Japan shift rate expectations and with them the price.
For a fuller view of the euro’s strength, the EUR/USD forecast is worth reading alongside this page, because that pair is the leading indicator for the euro.
Technical ratings
A compact overview of the technical situation is available on TradingView. The summary there bundles the most popular indicators, such as moving averages, oscillators and pivots. For the long-term view, choose the “1 month” time frame.
Technical ratings are a tool, not an autopilot. They combine many single indicators into one signal and make a quick overview easier. A trading decision on that basis alone does not replace your own analysis. The ratings only show that certain conditions of a set of indicators are met, conditions that may or may not fit your strategy.
Conclusion: EUR/JPY fails below 188.22 and corrects
The three time frames no longer point in the same direction. In the long run the uptrend is intact, as long as EUR/JPY trades above the 20-month line. In the short and medium term the picture has turned: the price failed in the resistance zone below 188.22, trades below all four moving averages shown on the daily chart, and has broken out of its range to the downside.
The September decisions do not change the rate gap once they are fully in force. The euro keeps its yield advantage, but no additional upward impulse follows from the gap alone. For my assessment the chart levels therefore come first, while I keep a close eye on the central bank dates. My next target is the area around 175 yen.
A forecast stays a statement of probability, not a guarantee. In currencies especially, single news items can turn the price quickly. Anyone trading EUR/JPY uses the levels named here as orientation and limits the risk with clear stops.
Frequently asked questions
Will the yen rise again?
A rising yen is possible, but not guaranteed. The yen appreciates mainly when the Bank of Japan raises rates further or when risk aversion in the markets increases. Both shrink the euro’s advantage. In the chart the picture has now turned: the weekly chart shows a downtrend, and in the short term that speaks for a firmer yen.
Will the yen keep falling?
The structural pressure on the yen is easing, but it has not disappeared. The yield advantage stays with the euro. Once the increases decided in September 2026 are in force, the ECB stands at 2.50% against 1.25% at the Bank of Japan. The gap is then back at 1.25 percentage points, the same as before. From that alone, though, the next price move cannot be derived.
Why is the yen falling so hard?
The main reason is Japan’s years of low interest rates. While other central banks raised rates, the Bank of Japan kept them extremely low. Investors pulled capital out of the yen and used it as a cheap funding currency in the carry trade. That weakened the yen over years.
How is the yen developing against the euro?
The yen is historically weak against the euro. At the weekly close on 18 September 2026, EUR/JPY stood at 180.19 yen. The yearly high was 187.95, and since then the yen has gained ground again. Whether that continues depends above all on the pace of the turn in rates in Japan.
Will the EUR/JPY rate rise or fall?
In chart terms the arguments currently favour falling prices. The uptrend is only intact in the long run. In the short and medium term a correction is under way with a target of 175 yen. Fundamentally, the Bank of Japan’s turn in rates increases the risk of setbacks. There is never a clear direction, only probabilities.
How do ECB and BoJ decisions influence the rate?
The rate gap is the most important driver. Higher rates in the euro area make the euro more attractive and support EUR/JPY. If the Bank of Japan raises instead, the yen gains ground. Exactly this interplay sets the medium-term direction.
Why is the yen seen as a safe currency?
Japan is a large net creditor to the rest of the world. In times of crisis, Japanese investors bring capital home and international investors look to the yen as a refuge. These flows often make the yen appreciate exactly when risk aversion rises.
This forecast is translated from the German edition on kagels-trading.de.
How our forecasts are made and reviewed: How we work.