
Copper Price Forecast: 2026, 2030 and 2050


This analysis is from 20 September 2026. Prices have moved since, so the levels below may no longer apply until the next update.
Copper forecast in 30 seconds
Current price
$6.72 per pound on COMEX (20 September 2026). All-time high $6.89; highest LME cash settlement $14,737 per tonne (8 September 2026).
Short term
Sideways for several weeks. Above last month's low at $6.37 the upward push stays intact.
Key support
$6.37, then last year's high at $5.96.
Long-term model range
Uptrend channel since 2008, per pound: $2.87 to $9.67 (2030), $4.19 to $14.07 (2040), $6.09 to $20.53 (2050).
On this page
- Copper forecast in 30 seconds
- Copper price forecast 2026 (short term)
- Copper price forecast to 2028 (medium term)
- Long-term copper price forecast: 2030, 2035, 2040 and 2050
- What moves the copper price
- What is copper?
- Where the copper price is quoted
- Industrial uses
- Copper and the energy transition
- Copper futures
- Conclusion on the copper price forecast
- How this forecast is made
- Frequently asked questions about the copper price forecast
- Please note
Copper price forecast 2026 (short term)
 Click to enlarge
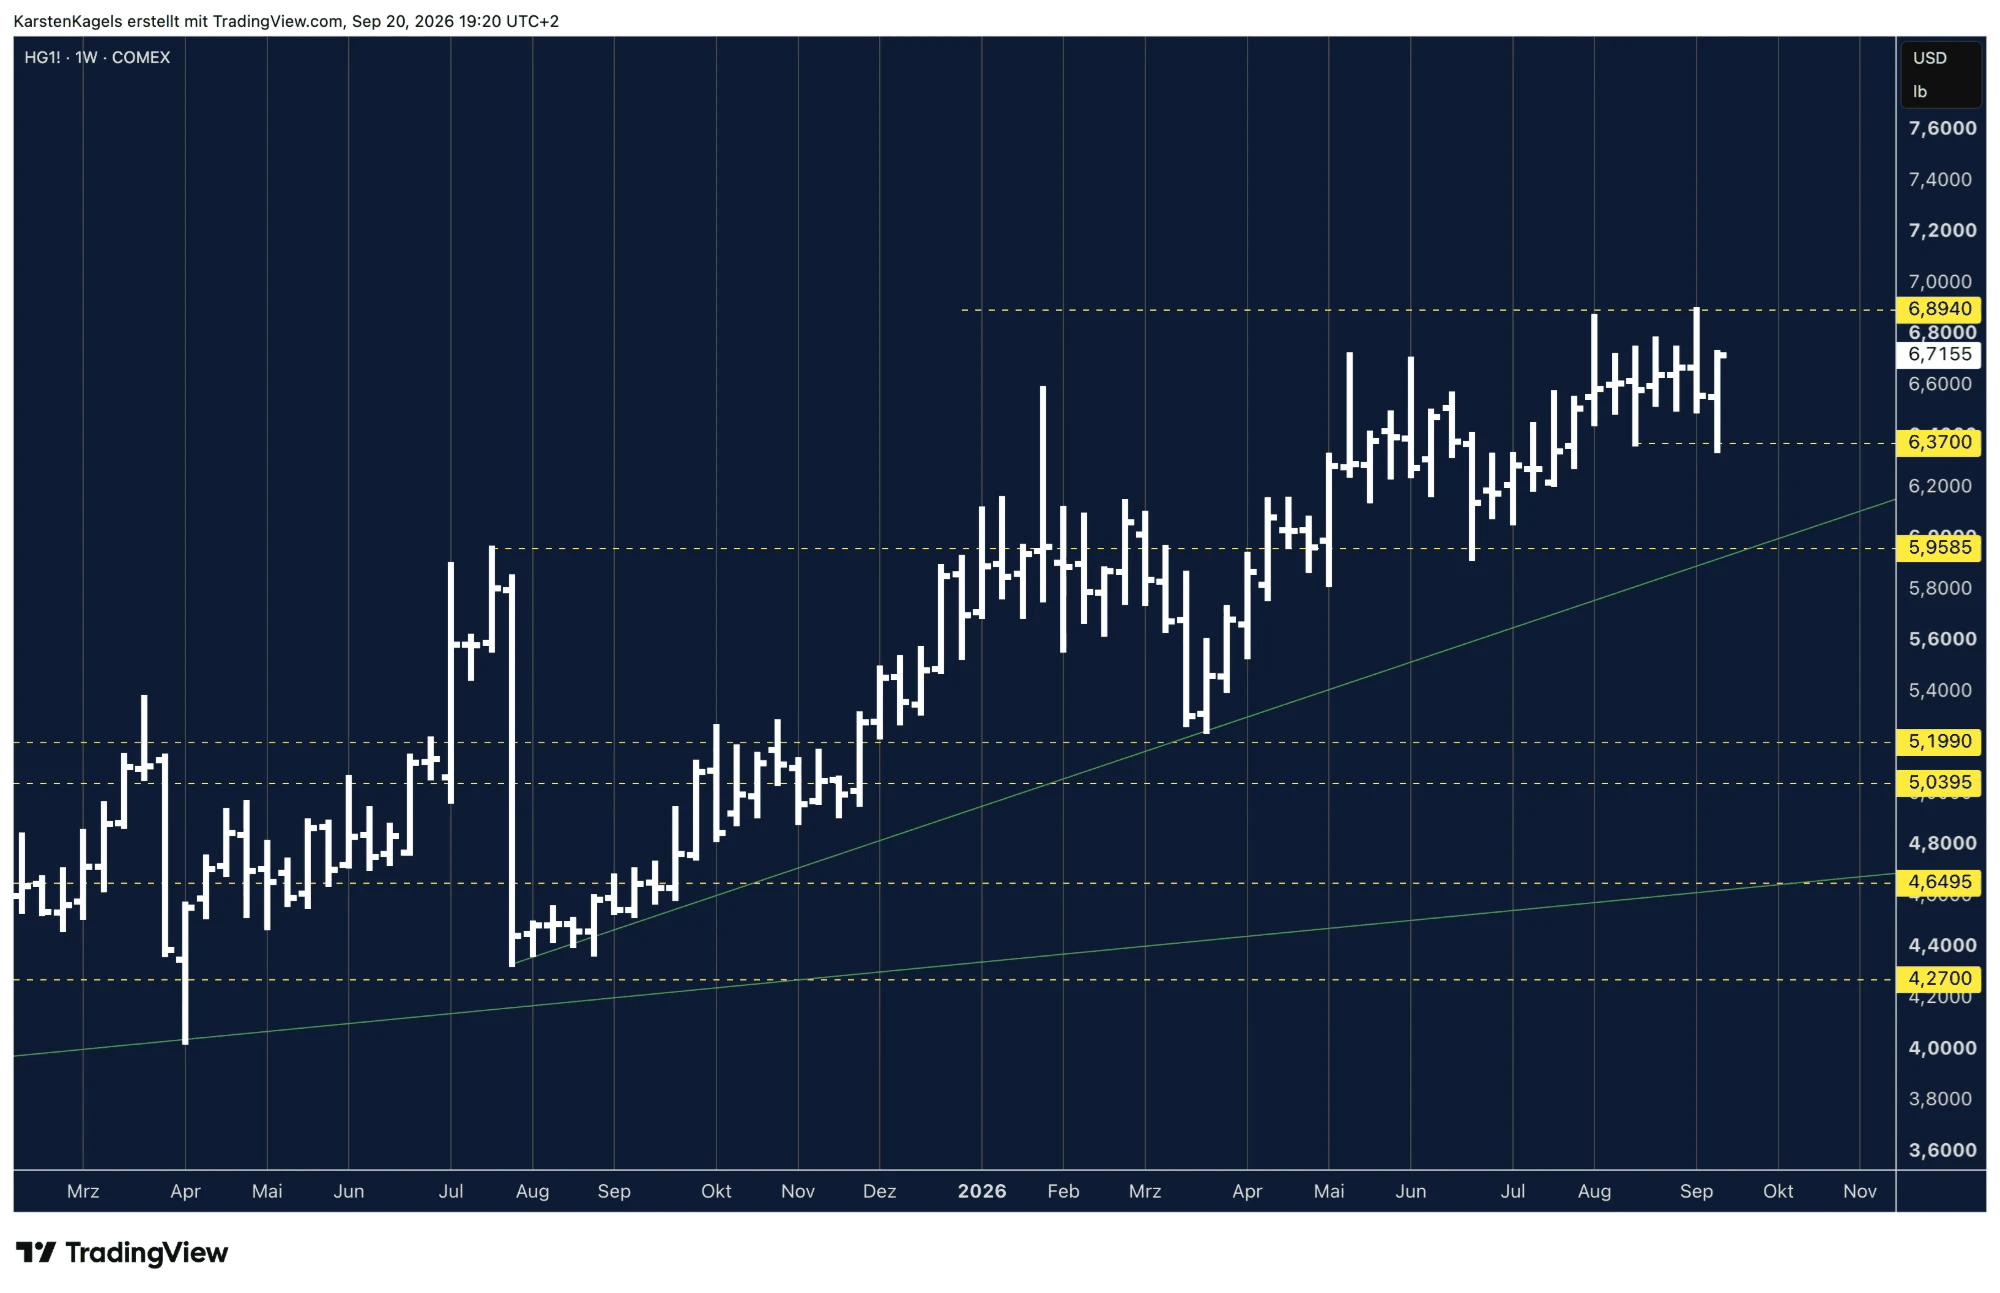
Copper has been moving sideways for several weeks. The market has digested the strong advance of the summer without giving back much ground. Last week the previous month's low at $6.37 was briefly undercut, but the price recovered immediately and closed back above the level.
That is a detail worth noting. When a market undercuts an important level and pulls straight back above it, that points to demand below the current price. Both the short-term and the long-term uptrend lines still run below the market price.
Bullish scenario: breakout above the all-time high
As long as copper holds above the previous month's low at $6.37, the upward push stays intact. A breakout above the all-time high at $6.89 takes the market into open territory, where no historical resistance is left. The upper boundary of the long-term channel then serves as orientation, running at around $8.34 for 2026.
One point argues for caution
LME inventories rose from 234,475 to 255,100 tonnes between 11 and 18 September, a gain of 8.8% in one week. Rising inventories do not fit the scarcity story and deserve attention.
Bearish scenario: a drop below the previous month's low
A sustained break of the previous month's low at $6.37 would be the first real warning sign. Below it, the next support is last year's high at $5.96, which is the most important level on the monthly chart. Only below that would the zone around $5.20 and $5.04 come into focus.
Resistance
- $6.89
Price at analysis$6.72
Support
- $6.37
- $5.96
- $5.20
- $5.04
- $4.65
- $4.27
Copper price forecast to 2028 (medium term)
 Click to enlarge
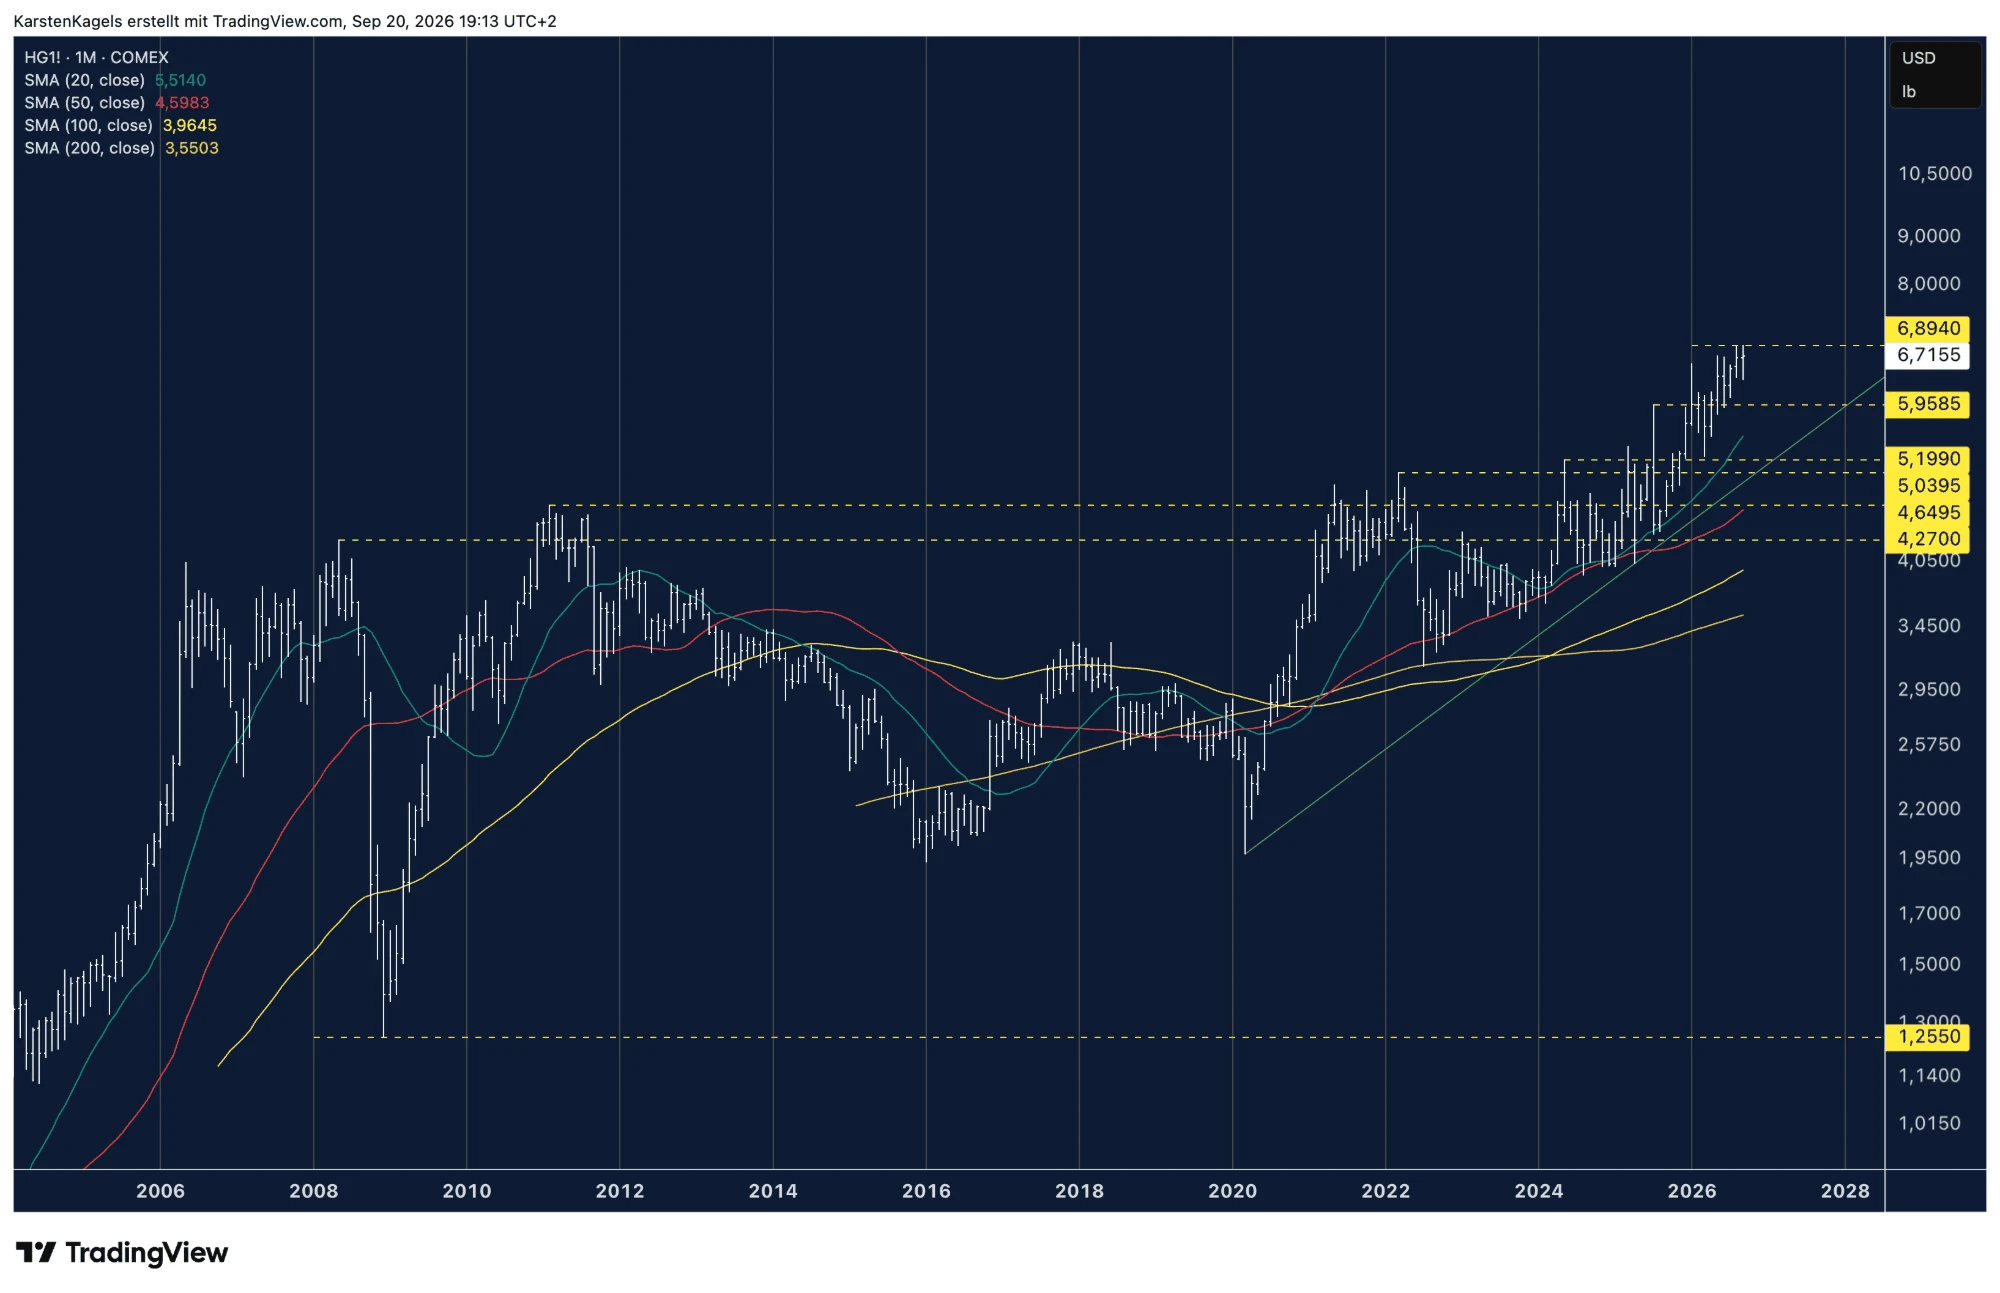
On the monthly chart, copper trades in the area of its all-time high. All four moving averages sit below the market price: the 20-month average at $5.51, the 50-month at $4.60, the 100-month at $3.96 and the 200-month at $3.55. Both uptrend lines also run below the price.
This setup is technically clear. When all the longer-term averages are below the price and point in the same direction, the market is in an established uptrend. The next important support is last year's high at $5.96.
Bullish scenario: the trend stays intact
As long as copper defends last year's high at $5.96, the medium-term structure stays bullish. The bank targets do not give a uniform picture, though: Goldman Sachs named $13,735 per tonne for the end of 2026, while Citigroup saw up to $15,000 in June 2026 on a six to twelve month view. The LME cash settlement of $14,529 on 18 September is already above the Goldman target.
What could trigger it
The most likely trigger would be a faster return of Grasberg. Freeport reported on 23 July 2026 that the restart was under way and targeted around 65% of capacity in the second half of 2026 and close to full capacity by the end of 2027. Those are planning figures.
Bearish scenario: a break of last year's high
If copper falls below $5.96, the medium-term uptrend loses its most important support. The path to the zone around $5.20 and $5.04 would be open, with $4.65 and $4.27 below that. Only a monthly close below the 20-month average at $5.51 would seriously damage the structure.
Long-term copper price forecast: 2030, 2035, 2040 and 2050
 Click to enlarge
A forecast running over decades carries considerable uncertainty. Too many macroeconomic developments can move the price, and nobody can see them twenty years ahead. Still, the yearly chart over several decades is worth a look, because it shows the order of magnitude the market moves in.
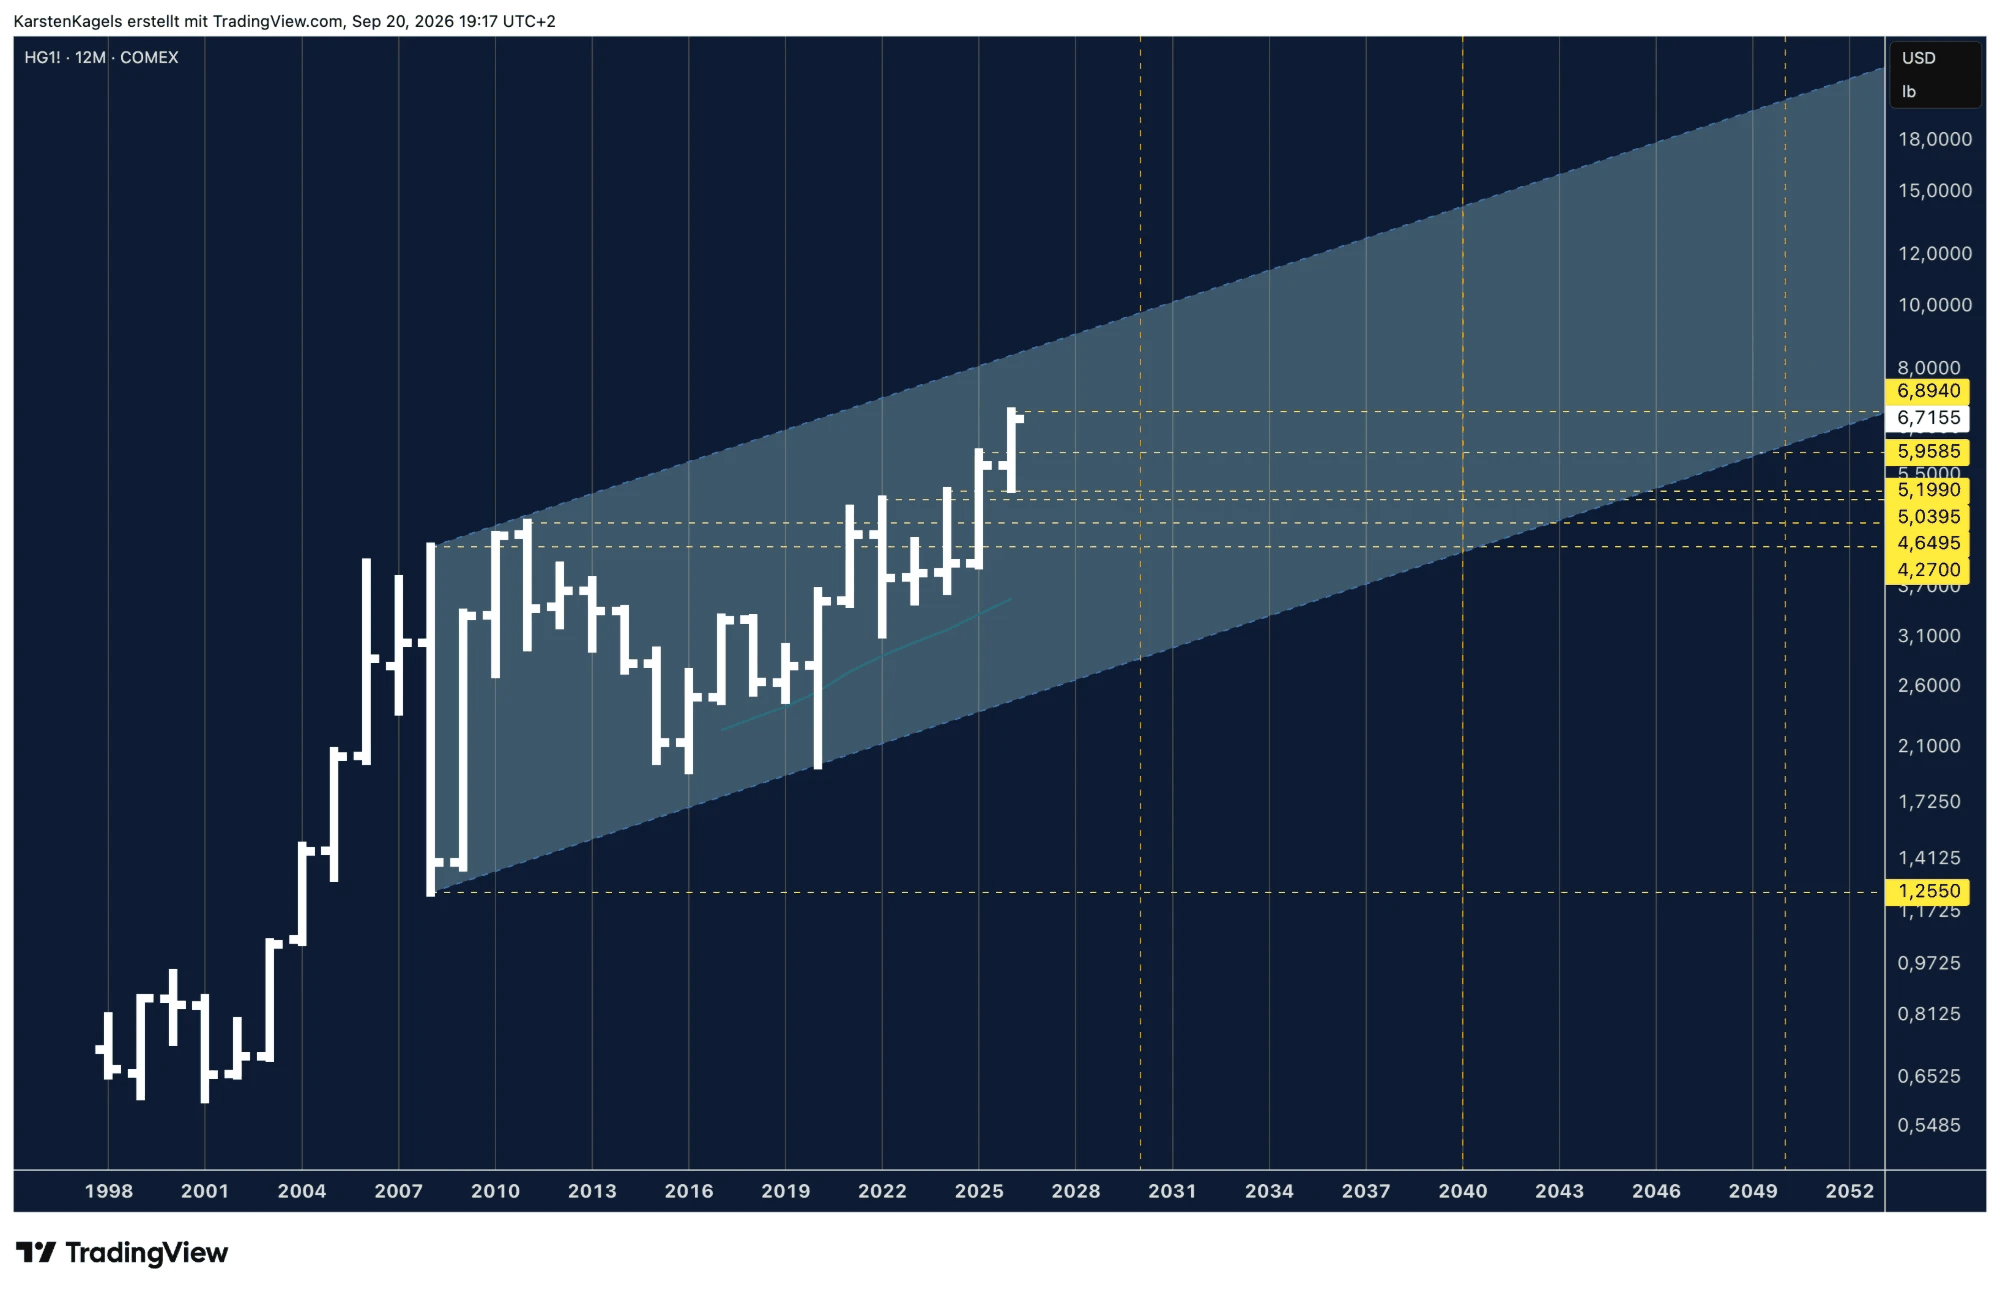
The chart uses a logarithmic scale. Over such periods that is essential, because a linear scale distorts moves that are equal in percentage terms. In this view, copper has been moving inside an uptrend channel since 2008, and the market is now heading towards its upper area.
The decisive move was the advance in 2025. It took copper out of the sideways range that had held since 2008 and created a long-term buy signal. On that basis, further price gains can be expected.
The values below come from a purely geometric extension of the drawn channel. They are not point forecasts. All figures are nominal US dollars per pound. The channel is not a statistical forecast band, so no probability can be derived from it. The channel rises by around 3.8% a year.
On the logarithmic scale, the price currently sits at around 82% of the distance between the lower and the upper channel boundary, so in the upper fifth. If that relative position stays unchanged, the model gives roughly $7.80 for 2030, $9.40 for 2035, $11.35 for 2040 and $16.55 for 2050. That is a projection under one assumption, nothing more.
For context: the International Energy Agency puts the possible copper supply gap for 2035 at around 25% in its Global Critical Minerals Outlook 2026 of 16 July 2026, measured as the distance between expected mine supply from existing and announced projects and primary supply requirements in the STEPS scenario. A year earlier the figure was around 30%. Such supply models describe possible physical shortages. They do not confirm the boundaries of this chart channel or any particular position of the price within it.
What moves the copper price
The copper price hangs on a manageable number of drivers, and one of them currently dominates everything else. They are ordered here by their current weight for the market, not by textbook logic.
The most important single factor is an accident. On 8 September 2025, 800,000 tonnes of mud entered the Grasberg block cave mine in Indonesia. Seven workers lost their lives. The operator Freeport declared force majeure. Benchmark Minerals estimated the production shortfall at 278,000 tonnes for 2025 and 313,000 tonnes for 2026, 591,000 tonnes in total. Those figures date from October 2025 and describe the gap against the earlier production plan, not a finally measured shortfall.
What makes this event so effective is the concentration of supply. The world market depends on a small number of very large mines. If one of them fails, the volume cannot be produced elsewhere at short notice, because developing new deposits takes ten to fifteen years.
Goldman Sachs cut its estimate for global mine supply by around 350,000 tonnes each for 2026 and 2027. Besides Grasberg, the slower recovery of Kamoa-Kakula in the Democratic Republic of the Congo plays a part. That leaves a deficit of around 640,000 tonnes outside the US for 2026 and a further 170,000 tonnes for 2027.
US trade policy is the second large factor. Section 232 tariffs have applied to copper since August 2025, with 50% on semi-finished products such as tubes, wires, rods and sheets. The rules were rebuilt in April 2026 and adjusted again in June 2026. What matters is what is not covered: copper ores, concentrates, cathodes, anodes and scrap are excluded, and refined copper is still exempt from these tariffs. A staged duty of 15% from January 2027 and 30% from January 2028 has been recommended but not put into force. Should it come, the price difference between COMEX and the LME would shift again.
China is the world's largest copper consumer. Its stimulus programmes, grid expansion and electric mobility determine a large share of global demand. At the same time, Chinese smelters have cut output because of a shortage of concentrate.
Structural demand from electrification and grid expansion remains the long-term driver. Demand from data centres and AI infrastructure has been added as a further impulse, because every large data centre needs substantial amounts of copper for power supply and cooling.
Because copper is traded internationally in US dollars, the exchange rate works directly on the price. A strong dollar makes the metal more expensive for buyers outside the US and dampens demand. A weak dollar works the other way round.
Finally, inventories at the LME and COMEX show physical tightness immediately. Falling inventories point to excess demand, rising ones to easing. At the moment this indicator sends a warning signal, as described in the short-term section.
What is copper?
Copper (Cu) is a chemical element and one of the oldest metals used by humans. Because of its excellent electrical and thermal conductivity, it is essential in electronics, construction and the energy transition.
The metal has a reddish-brown colour and is one of the few metals that occur in pure form in nature. It is easy to work with and can be recycled almost completely, which cuts the energy use of production considerably.
Where the copper price is quoted
The copper price is quoted in US dollars on the international commodity exchanges. The two main reference markets are the London Metal Exchange (LME), quoting in US dollars per tonne, and the COMEX division of the CME Group, quoting in US dollars per pound.
For traders, that difference matters. Anyone reading a copper quote needs to know which unit is meant. One pound equals 0.4536 kilograms, so one tonne is about 2,205 pounds. The COMEX price of $6.72 per pound therefore equals roughly $14,805 per tonne.
Why COMEX and the LME can drift apart
Since the US tariffs were introduced, the two venues no longer move in step. As expectations about tariffs redirected trade flows, a price difference opened up between COMEX and the LME that was substantial at times.
At the moment that gap has largely closed. Converted, the COMEX price sits only around 1.9% above the LME cash settlement of $14,529 per tonne. The comparison is only a rough orientation, though: different delivery dates, trading hours and market conditions influence the gap as well.
Industrial uses
Copper is irreplaceable in many areas. In electronics it is used for cables and wiring, in construction for pipes, roofs and facade cladding. Particularly relevant for traders: in the car industry copper use is rising, because electric vehicles contain clearly more copper than comparable combustion cars. The International Copper Association put the figure at around 62.5 to 75 kilograms per electric vehicle against 25 to 30 kilograms for a combustion car in 2023. The amount depends on vehicle size and drivetrain. Platinum and palladium depend even more on the car industry, through catalytic converters, as the platinum price forecast and the palladium price forecast show.
Copper and the energy transition
The energy transition drives copper demand structurally, because wind turbines, solar parks, power grids and electric vehicles all need substantial amounts of the metal.
The move to greener energy is hard to imagine without copper. Solar cells, wind turbines and the cables that carry the electricity to consumers all depend on it. That makes copper one of the key raw materials of the coming decades. Silver depends on the same trend through solar demand, as the silver price forecast shows.
Copper futures
Copper futures are standardised forward contracts. Buyer and seller agree a price for settlement at a later date. For the standard HG contract on COMEX, physical delivery is intended unless the position is closed beforehand.
Trading futures on COMEX gives active traders the most direct access. For smaller accounts, micro contracts need less capital. Exchange traded commodities offer listed access for investors with a longer horizon; with futures-based products the structure handles the rolling, but the roll yield still influences performance and can make it differ from the spot price.
Conclusion on the copper price forecast
Copper is currently one of the most interesting commodity markets. It is rare for such a clear technical picture to meet a fundamental situation that can be supported with concrete figures rather than assumptions. The Grasberg accident is not a forecast but an event that has happened. How large the shortfall turns out in the end depends on the restart.
Technically the picture is clear. All moving averages and both uptrend lines are below the market price, and the breakout from the sideways range that had held since 2008 created a long-term buy signal. As long as the previous month’s low at $6.37 and, below it, last year’s high at $5.96 hold, there is no reason to doubt that picture.
Two things are worth watching anyway. First the LME inventories, which have risen again. Second the decision on tariffs for refined copper, which has been recommended but is not in force and can move the market in either direction.
Anyone trading copper should know the levels rather than the opinions. On the upside, the all-time high at $6.89 is the threshold into open territory. On the downside, $6.37 and $5.96 are the levels that decide whether the trend holds.
How this forecast is made
The forecasts are based on a combination of technical analysis and fundamental context. The levels come from my own charts: the all-time high, last year’s high, the previous month’s low, moving averages and the long-term uptrend channel since 2008. Added to that are documented supply and demand data as well as current trade and monetary policy. The charts show the copper future on COMEX (HG1! on TradingView). This page follows our editorial policy.
Frequently asked questions about the copper price forecast
Will the copper price rise further?
The technical picture argues for it. All moving averages on the monthly chart are below the price, and the breakout from the sideways range that had held since 2008 created a long-term buy signal. On the fundamental side, the Grasberg shortfall is missing from the market. Against that stand rising LME inventories and the high sensitivity of copper to the global economy.
How will the copper price develop to 2030?
The long-term uptrend channel gives a range of $2.87 to $9.67 per pound for 2030. If copper keeps its current position in the upper fifth of the channel, that works out at around $7.80. This is a projection under that assumption and not a promise.
What is the copper price projection for 2035?
For 2035 the channel spans a range of $3.46 to $11.68 per pound. With the relative position unchanged, that would be around $9.40. The International Energy Agency puts the possible supply gap for 2035 at around 25% in the STEPS scenario.
How much does a kilogram of copper cost in 2026?
The LME cash settlement on 18 September 2026 was $14,529 per tonne, which works out at about $14.53 per kilogram. That is an arithmetic conversion of the exchange price, not a binding price for scrap or small quantities. Those depend on quality, product form, volume and supplier.
Please note
The scenarios are a personal assessment based on experience and are not a certainty. This is market analysis, not investment advice. Keep your position sizes in line with your own risk management.
This forecast is translated from the German edition on kagels-trading.de.
How our forecasts are made and reviewed: How we work.