
Best Silver Stocks 2026: 10 Companies Compared


Contents
- Silver stocks in 30 seconds
- What are silver stocks?
- Who is the largest silver producer?
- The best silver stocks: ten companies compared
- The XAU and HUI indices
- Silver ETFs as an alternative
- Why silver attracts investors
- A short history of the silver price
- Conclusion: big leverage, big differences
- Frequently asked questions about silver stocks
- About the author
When the silver price rises, mining stocks often rise several times as much. The reason: a mine’s production costs change little in the short run, while the revenue per ounce climbs. A large part of the extra revenue can therefore reach the profit line, depending on output, costs and taxes. This leverage works in both directions, and that is exactly why silver stocks are no substitute for physical silver.
Choosing a silver stock is harder than most lists suggest. In 2025 three well-known names were taken over by larger companies, others now earn most of their money with gold, and one of the largest names does not run a single mine of its own. This guide shows you ten selected silver stocks with output, costs and chart levels, and explains the difference between producers, streaming companies and explorers.
Silver stocks in 30 seconds
- Fresnillo is the largest silver producer in the world with 48.7 million ounces in 2025. Pan American Silver and the streaming company Wheaton Precious Metals follow. All ten companies are in the comparison table.
- Not every silver stock is a pure silver investment. Producers mine the metal, streamers finance other companies’ mines, explorers have no revenue yet. Several companies now earn most of their money with gold.
- Production costs differ widely and are only partly comparable. Hecla reports $11.28 per ounce of silver for 2025, without its Keno Hill mine, which is still ramping up. Endeavour reports $31.52, including the costly start of its new Terronera mine.
- Silver stocks swing harder than silver itself. From the start of 2025 to October 2026, silver rose 95 percent and the XAU miners index 146 percent. On 20 October 2026 the four stocks in our monthly charts stood 25 to 50 percent below their record highs from January to March 2026.
What are silver stocks?
Silver stocks are shares of companies that make money with silver: producers mine it themselves, streaming companies buy a share of other companies’ output, and explorers search for and develop new deposits.
Most silver producers are based in North and South America. The largest deposits today are in North and South America, plus China, Poland, Russia and Australia. Through takeovers, many mining companies still operate around the world.
Pure silver companies hardly exist. Silver often comes out of the ground together with gold, lead, zinc or copper. Depending on its mix of metals, a company depends more or less on the silver price. That is why this guide looks at actual silver output first and at the company’s name second.
Who is the largest silver producer?
By output, Fresnillo plc is the world’s leading silver producer. In 2025 the Mexican company produced 48.7 million ounces of silver, 13.5 percent less than in 2024 (full-year results 2025). Alongside silver it produced 600,287 ounces of gold.
The often quoted 2 billion ounces are resources, not reserves. At the end of 2025 Fresnillo reported about 2.06 billion ounces of silver resources, 8.5 percent less than a year earlier. Of those, 362.6 million ounces count as reserves, up 9.4 percent. For 2026 the company plans to produce 42 to 46.5 million ounces of silver.
Reserves are the part of the resources that a feasibility study shows can be mined profitably at today’s prices and costs.
The best silver stocks: ten companies compared
We selected the stocks by silver share, output, size and listing. Most of them trade in London, New York or Toronto. Some are also quoted on European exchanges in euros, but liquidity there is usually thin and the spread between bid and ask is wider. Buying the same share in euros does not remove its currency risk: the euro quote simply follows the dollar or pound price. On top of that, the companies sell their silver in US dollars but pay many of their costs in local currencies, which affects their earnings.
The table below lists ten selected silver stocks, sorted by output. What matters is not only size but also the business model. Some companies mine silver only as a by-product, others run no mines at all. The type column therefore separates producers, streaming companies and explorers. The details for each company follow in the profiles below.
| Company | Type | Silver output 2025 (million oz) |
|---|---|---|
| Fresnillo | Producer | 48.7 |
| Pan American Silver | Producer | 22.8 |
| Wheaton Precious Metals | Streamer | 22.4 (stream share) |
| Coeur Mining | Producer | 17.9 |
| Hecla Mining | Producer | 17.0 |
| First Majestic Silver | Producer | 15.4 |
| Silvercorp Metals | Producer | 6.8 (FY to Mar 2026) |
| Endeavour Silver | Producer | 6.49 |
| Fortuna Mining | Producer | 0.97 |
| Vizsla Silver | Explorer | none yet |
Figures come from the companies’ reports for 2025. For Silvercorp they cover the fiscal year to March 2026, for Wheaton the attributable stream share. Fortuna now mines mostly gold.
A stock screener helps you find more candidates. In TradingView’s screener we chose the sector non-energy minerals and the industry precious metals. The screener lists 79 companies. Among the 17 largest by market cap, only Pan American, Coeur and Hecla have a meaningful silver business, plus the streamer Wheaton. The rest are gold miners.
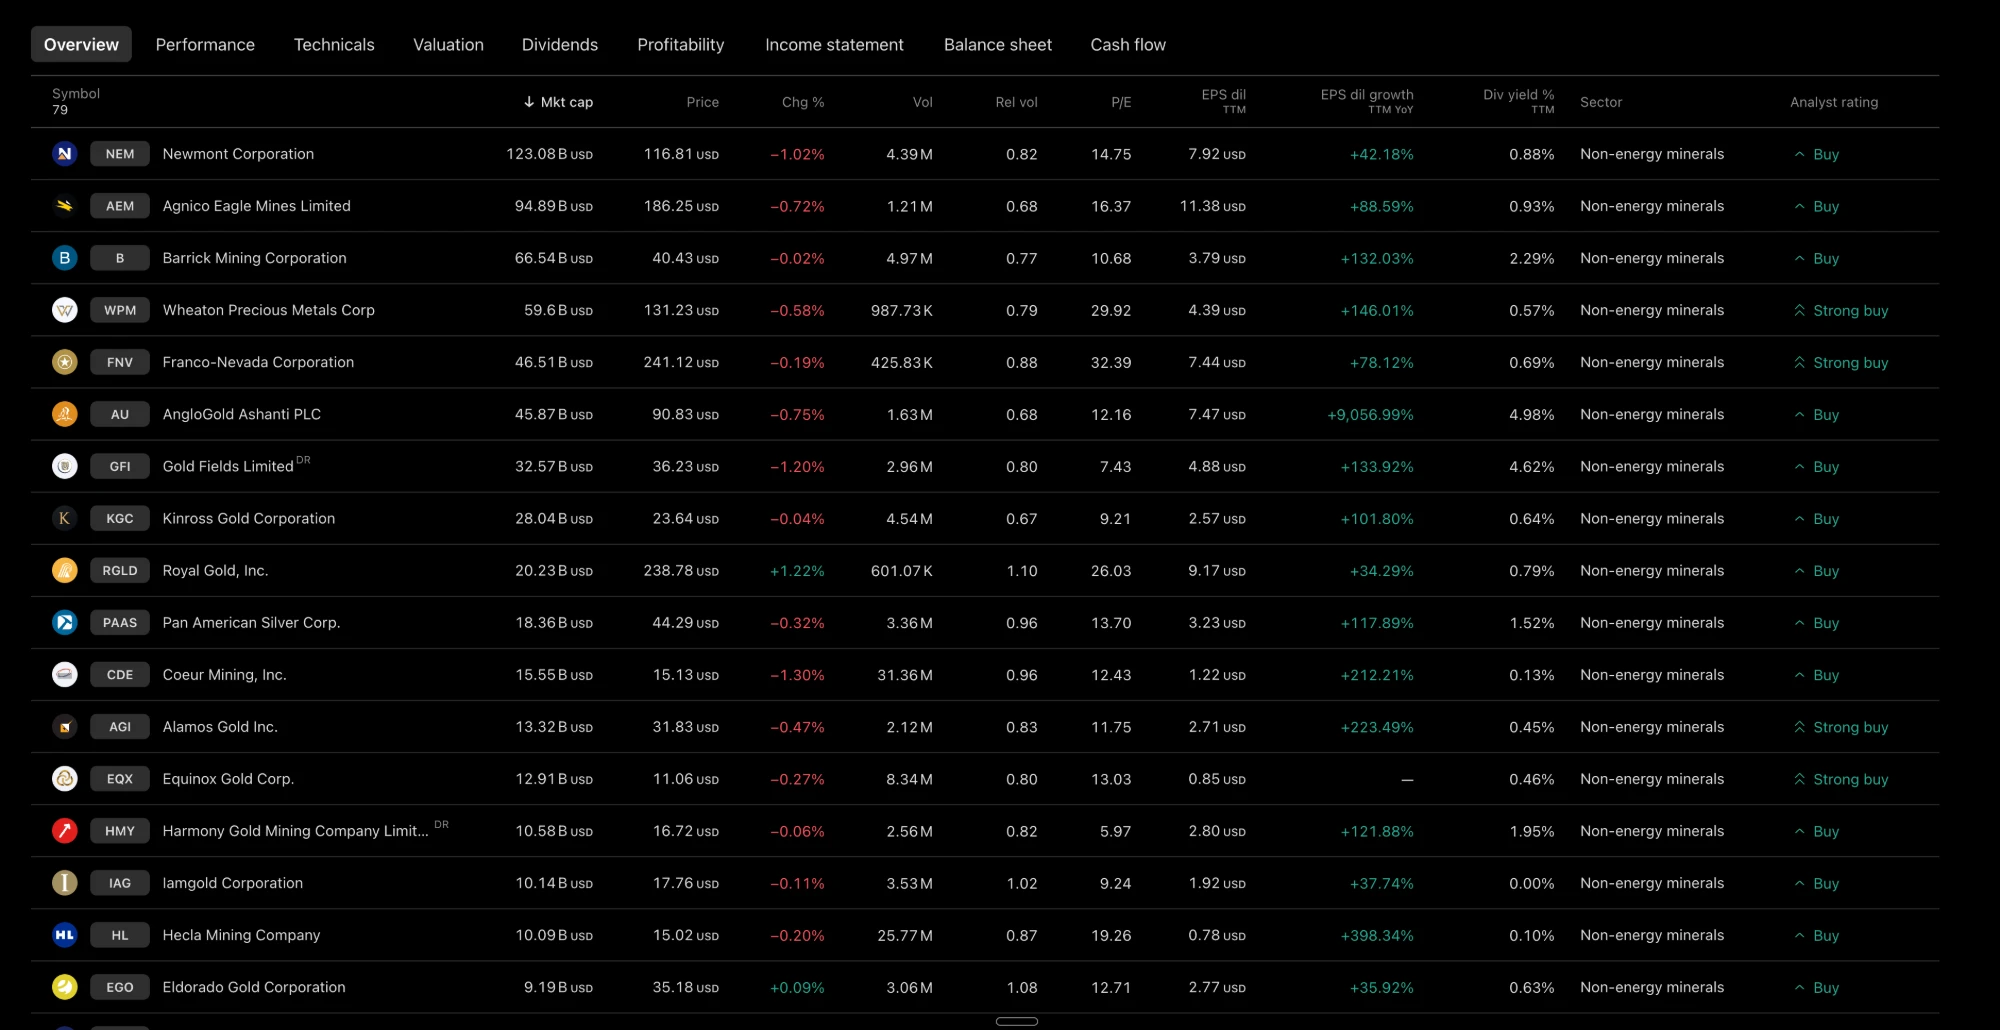 Click to enlarge
Source: TradingView stock screener.
For a deeper look at the numbers, a research platform saves time. Tools like InvestingPro show fair value estimates, financial health scores and dividend histories side by side. What the platform can and cannot do is in our InvestingPro review.
Fresnillo plc
Fresnillo has to be on any list of silver stocks. The company is based in Mexico, where its flagship mine has been worked since 1554. The shares trade on the London Stock Exchange and the Mexican stock exchange, ISIN GB00B2QPKJ12.
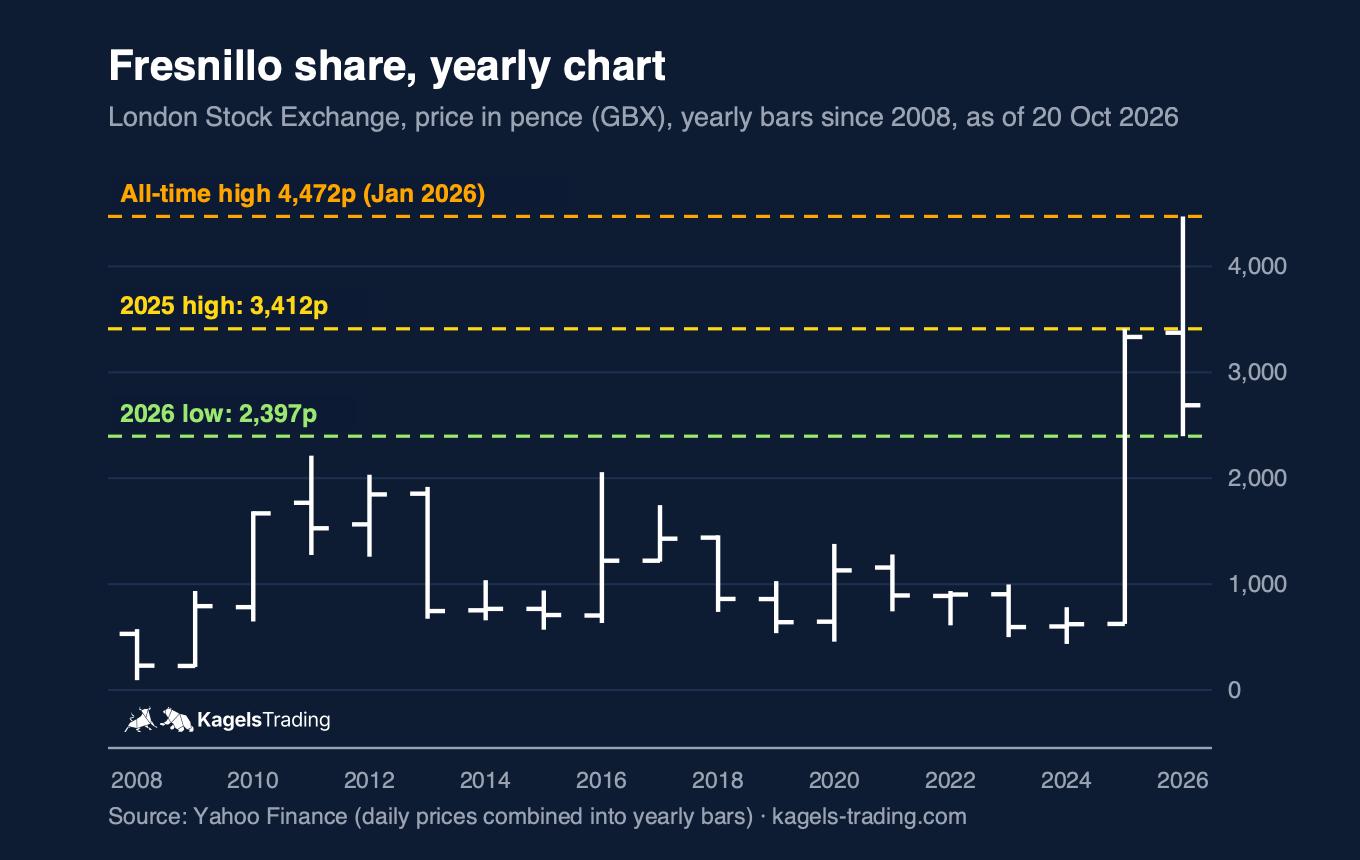
The yearly chart shows the London share price in pence (GBX). One hundred pence make one pound sterling. Each bar shows one year with open, high, low and close.
 Click to enlarge
Source: Yahoo Finance.
2025 was the strongest year in the stock’s history. The share price rose from 621.5 to 3,334 pence and more than quintupled. In January 2026 it reached its all-time high of 4,472 pence. Since then the stock has fallen back, down to 2,397 pence on 17 July.
The key level now is last year’s high at 3,412 pence. As long as the price stays below it, 2026 remains a correction year after a strong overshoot. A move back above it would confirm the uptrend. The 2026 low at 2,397 pence acts as support. Below that, the next zone lies between 2,050 and 2,200 pence, where the stock topped in 2011 and 2016.
Fresnillo pays out 33 to 50 percent of its profit after tax. One third comes as an interim dividend, two thirds as a final dividend. For 2025 the company went further: with a final dividend above its usual policy, it paid shareholders a total of $950 million, or 128.92 US cents per share.
Pan American Silver Corp.
By output, Pan American Silver is number two among the producers in this comparison. The shares of Pan American Silver Corp. (PAAS) trade on the New York Stock Exchange and the Toronto Stock Exchange.
In 2025 Pan American produced 22.8 million ounces of silver and 742,200 ounces of gold. Since September 2025, through its takeover of MAG Silver, it also owns 44 percent of the Juanicipio mine in Mexico. For 2026 the company plans 25 to 27 million ounces of silver. All-in sustaining costs in the silver segment were $13.88 per ounce in 2025, after by-product credits (full-year results 2025).
All-in sustaining costs (AISC) show what a mining company spends per ounce to sustain its existing production, including administration, exploration and sustaining capital, but not the cost of building new mines or expansions and not income tax, and depending on the company the figure refers to mined, sold or payable ounces.
 Click to enlarge
Source: Twelve Data.
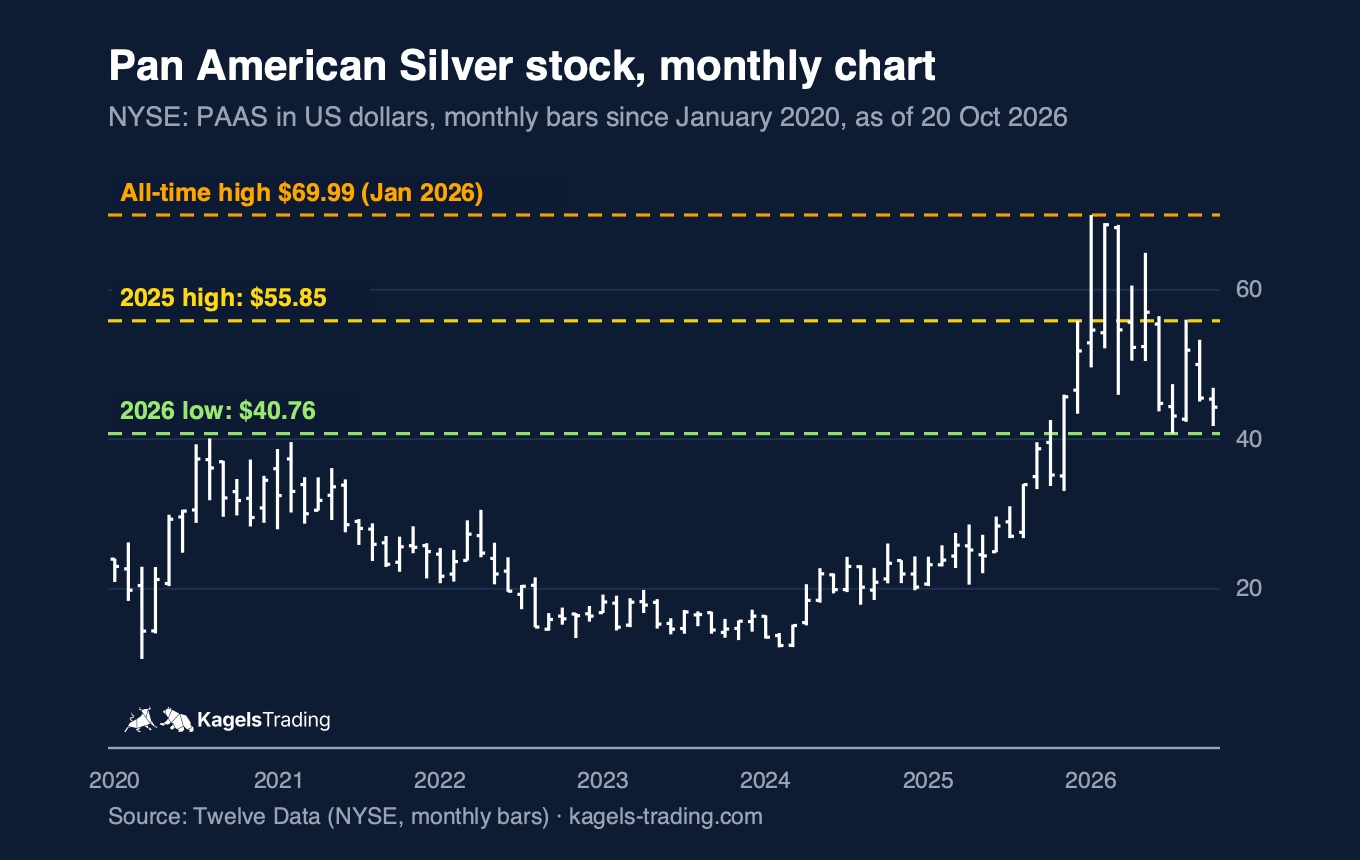
The monthly chart shows a breakout from a range that lasted years. From 2021 to 2024 the stock moved between about $12 and $40. In 2025 it broke above the highs of 2020 and 2021 and reached an all-time high of $69.99 in January 2026. Since then it has corrected. The 2026 low of $40.76 sits right at the old highs around $40, which now act as support.
For the next direction, the 2025 high at $55.85 matters most. A monthly close above it would resume the uptrend. A break below $40 would put the move of 2025 into serious doubt. If you plan a trade, check the risk-reward ratio between these two levels.
Pan American pays a quarterly dividend. The latest was $0.184 per share for the second quarter of 2026, paid in early September. Together with share buybacks, the company returned $300 million to shareholders in that quarter.
More than half of the silver reserves sit in a mine that is not operating. As of 30 June 2026, Pan American reports 511.1 million ounces of silver reserves (reserves update 2026). Of those, 264.5 million ounces belong to Escobal in Guatemala. The company owns the mine outright, but it is idle and there is no restart date.
Wheaton Precious Metals Corp.
Wheaton Precious Metals does not own a single mine. It finances other companies’ mining projects and in return secures the right to buy a fixed share of their later output at an agreed price. For you as an investor this means rising wages or energy costs do not hit the result directly, because Wheaton does not run the mining operations itself.
A streaming company finances the construction of mines and receives the right to buy a fixed share of the metals produced on contractual terms, usually at a fixed price or a small share of the market price.
In 2025 Wheaton reached about 692,000 gold equivalent ounces and beat its own guidance. Silver accounted for 22.4 million ounces, Wheaton’s attributable share of output from other companies’ mines (production release). For 2026 the company expects 27 to 29 million ounces of silver, and by 2030 it targets about 1.2 million gold equivalent ounces in total.
Buying Wheaton is not a pure silver investment. In 2025, 62 percent of revenue of $2.3 billion came from gold and 36 percent from silver. That softens the leverage on the upside but also cushions weak phases of silver. So for Wheaton it also matters whether the gold price rises.
Coeur Mining Inc.
Coeur Mining made the biggest jump of all companies in this comparison in 2025. Its silver output rose 57 percent to 17.9 million ounces. The main reason was the takeover of SilverCrest Metals in February 2025, which brought the Mexican Las Chispas mine into the portfolio.
Coeur is no longer a pure silver company. Its gold output rose 23 percent to 419,046 ounces in 2025. Revenue reached $2.07 billion and operating cash flow $886.9 million. In March 2026 Coeur also completed its takeover of the gold producer New Gold, which shifts the weight further towards gold (Coeur, 20 March 2026).
The production focus is clearly in North America. Besides Las Chispas in Mexico, the expanded Rochester mine in Nevada drives growth. Most of the output therefore comes from politically stable regions.
Hecla Mining Company
Hecla Mining reports very low costs per ounce of silver. All-in sustaining costs were $11.28 per ounce in 2025, excluding the Keno Hill mine, which is not yet in commercial production. Pure cash costs were even negative at minus $1.75, because revenue from gold, lead and zinc covered the cost of the silver (Hecla presentation, April 2026).
Output rose to 17.0 million ounces of silver in 2025. The biggest contributor was Greens Creek in Alaska with more than 8.7 million ounces. Lucky Friday set a record with 5.3 million ounces, and Keno Hill in Canada’s Yukon passed three million ounces for the first time.
Low reported costs give Hecla a larger operating cushion when the silver price falls. Compared with higher-cost producers on similar assumptions, more of the revenue is left after running the mines. That says nothing yet about valuation or debt, and the price for it is less leverage on the upside.
First Majestic Silver Corp.
First Majestic almost doubled its silver output in 2025. The shares of First Majestic Silver Corp. (AG) trade on the New York Stock Exchange and in Toronto, both under the ticker AG. The ISIN is CA32076V1031.
In 2025 First Majestic produced 15.4 million ounces of silver, 84 percent more than a year earlier. The reason is the takeover of Gatos Silver in January 2025, which added 70 percent of the Los Gatos mine. In silver equivalent, output was 31.1 million ounces. AISC were $21.17 per silver equivalent ounce and therefore cannot be compared directly with Hecla or Pan American (full-year results 2025).
A silver equivalent ounce converts by-product metals such as gold into silver at a fixed price ratio, so that total output can be shown as one number.
 Click to enlarge
Source: Twelve Data.
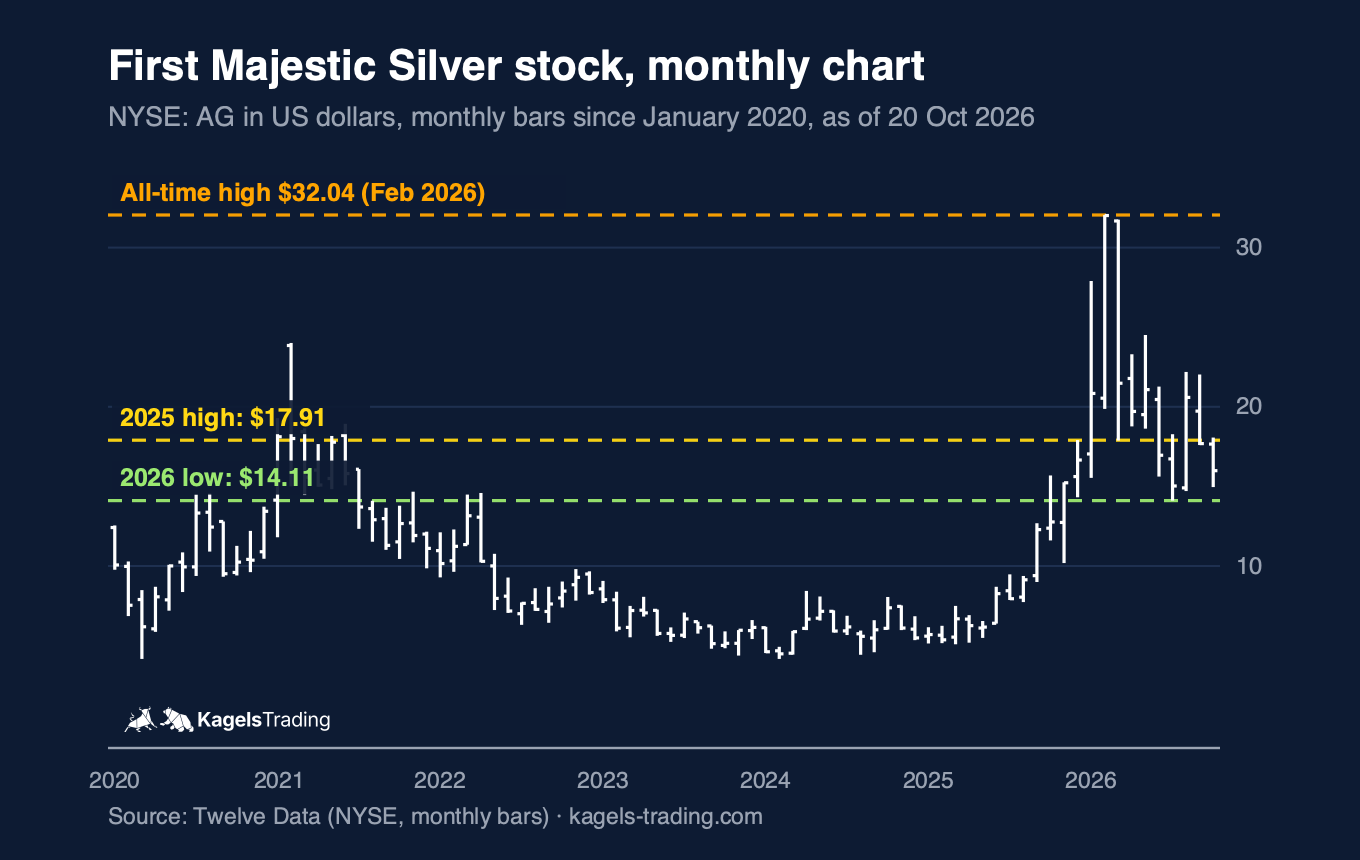
The stock has the strongest overshoot of the four monthly charts behind it. In February 2026 it hit an all-time high of $32.04, finally beating the old record of $26.88 from 2011. By October the price had roughly halved and was back below the 2025 high of $17.91.
The most important support is the 2026 low at $14.11. If it holds, the correction remains part of the large uptrend that began in 2024. A monthly close below it would open the way towards the 2025 breakout zone around $10. Only a close above $17.91 would end the weakness.
The dividend is small but linked to revenue. Since 2026 First Majestic has paid out about 2 percent of quarterly revenue. For the second quarter of 2026 that was $0.0152 per share. A higher silver price can, all else equal, raise revenue and with it the payout, but the board decides on it every quarter.
First Majestic runs four underground mines in Mexico. They are Santa Elena, San Dimas, La Encantada and Los Gatos at 70 percent. The Jerritt Canyon gold mine in Nevada is due to restart in the second half of 2027. In July the company raised its 2026 guidance to 14.6 to 15.5 million ounces of silver.
In the third quarter of 2026 a labour dispute slowed production. A twelve-day dispute at San Dimas cut silver output to 3.44 million ounces (Q3 2026 production report). Reserves at the end of 2025 were 101.7 million ounces of silver, or 184.8 million silver equivalent ounces including gold and other metals.
Fortuna Mining Corp.
Fortuna is on silver stock lists mainly because of its history. Until June 2024 the company was called Fortuna Silver Mines, and since then it has been Fortuna Mining Corp. The shares trade on the New York Stock Exchange as FSM and in Toronto as FVI. With the name change came a new ISIN, CA3499421020.
In 2025 Fortuna produced 317,001 gold equivalent ounces and only 966,108 ounces of silver. The silver comes only from the Caylloma mine in Peru. Fortuna sold its Mexican silver mine San Jose in April 2025 and the Yaramoko gold mine in Burkina Faso in May 2025. Today it earns most of its money with gold from Séguéla in Côte d’Ivoire and Lindero in Argentina (MD&A 2025).
 Click to enlarge
Source: Twelve Data.
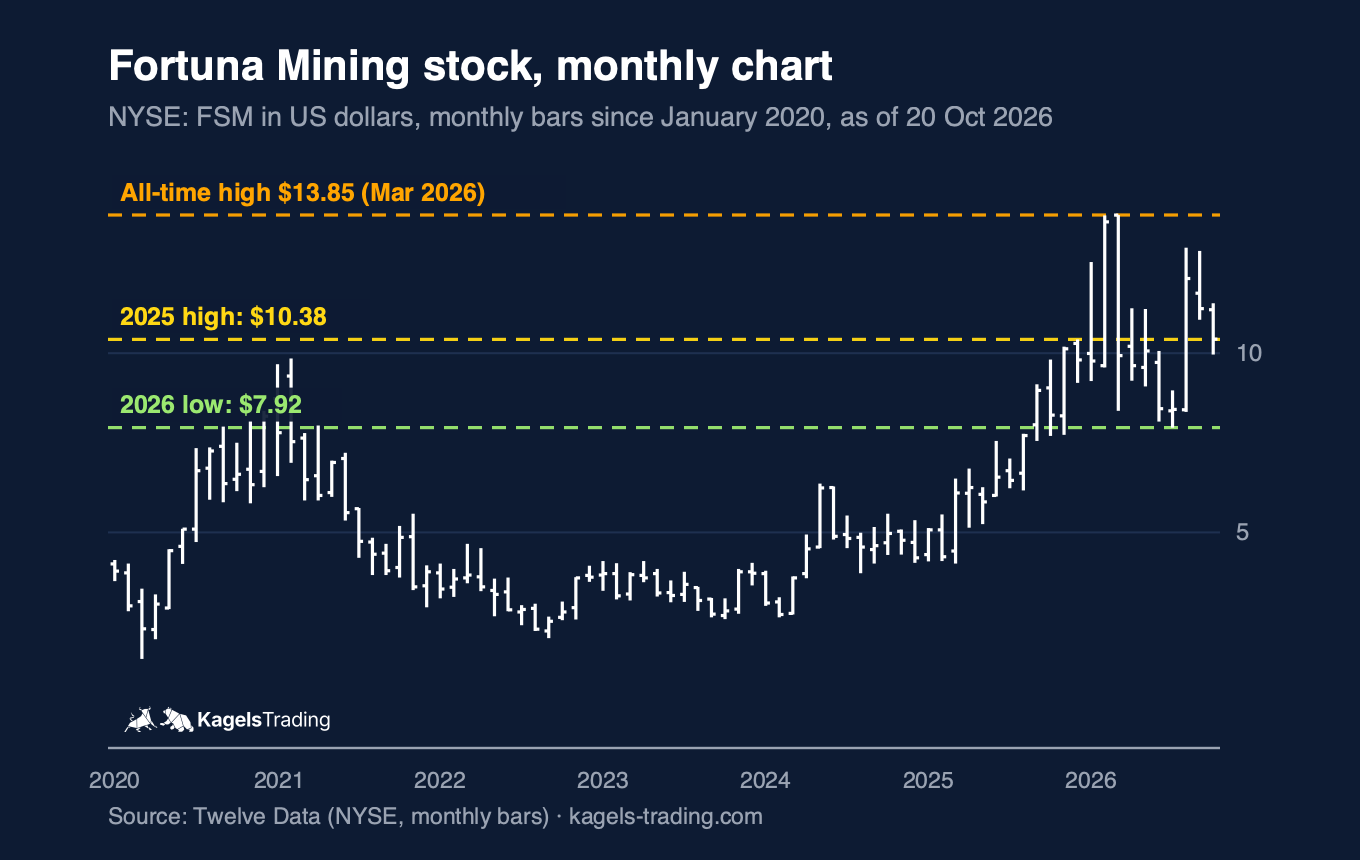
In the monthly chart, Fortuna holds up better than the pure silver stocks. Its all-time high came only in March 2026, at $13.85. The fall since then, about 25 percent, has been much smaller than at First Majestic or Endeavour. One reason is the high gold share, because gold fell less than silver after the January peak.
Technically, the stock sits right at its 2025 high of $10.38. A monthly close above it keeps the uptrend intact. Below it, the 2026 low at $7.92 would be the next support. Fortuna pays no dividend and buys back its own shares instead.
Fortuna is based in Vancouver and keeps expanding its gold business. Besides Séguéla, Lindero and Caylloma, it is developing the Diamba Sud gold project in Senegal. In October 2026 the board approved $109 million to expand the Séguéla plant. For 2026 Fortuna expects 281,000 to 305,000 gold equivalent ounces.
Silvercorp Metals Inc.
Silvercorp is the only company in this comparison that mines mainly in Asia. It runs its mines in China and produced 6.8 million ounces of silver and 8,723 ounces of gold in the fiscal year to March 2026.
Costs have risen noticeably. AISC climbed to $14.25 per ounce, from $12.12 a year earlier, an increase of 18 percent. Adjusted net income was $151 million, operating cash flow $310.6 million (Silvercorp fiscal 2026 results).
Here you knowingly take on country risk. If you buy Silvercorp, you bet not only on the silver price but also on stable regulation in China. That sets the stock clearly apart from the North American producers.
Endeavour Silver Corp.
Endeavour Silver reports high costs per ounce of silver for 2025, partly because of a new mine starting up. The shares of Endeavour Silver Corp. (EXK) trade on the New York Stock Exchange and in Toronto under EDR. The ISIN is CA29258Y1034.
In 2025 Endeavour produced 6.49 million ounces of silver, 45 percent more than in 2024. The takeover of the Kolpa mine in Peru in May 2025 and the start of production at the new Terronera mine in Mexico in October 2025 contributed. AISC were $31.52 per ounce of silver, after by-product credits. Terronera alone came to $65.70 in its first quarter of production (MD&A 2025).
 Click to enlarge
Source: Twelve Data.
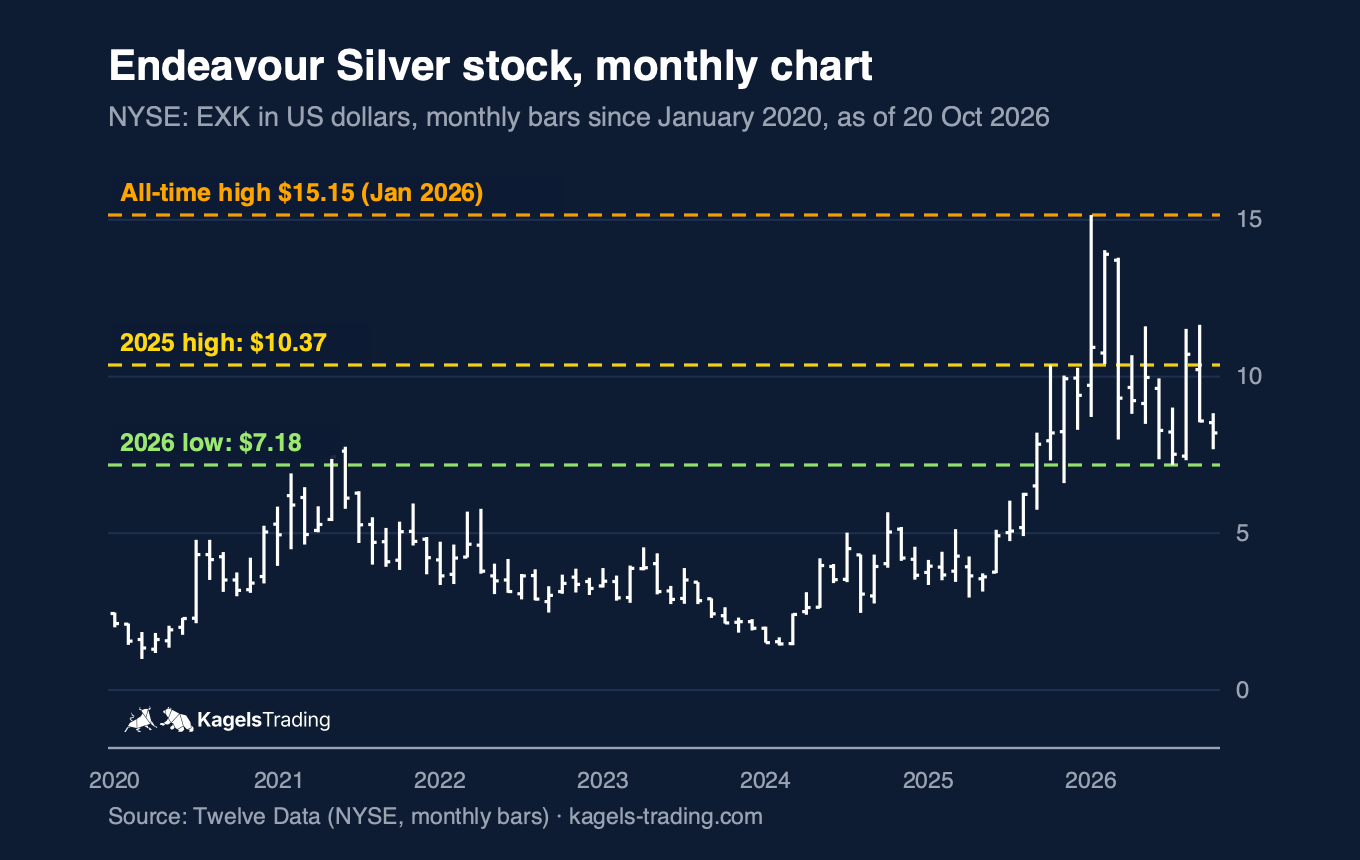
Endeavour also set a new all-time high in 2026. In January the stock rose to $15.15, beating the old record high of $13.10 from 2011. Since then the price has fallen by almost half and is back below the 2025 high of $10.37.
Now everything depends on the 2026 low at $7.18. Below it, the next support would only come at $5.70 to $5.80, the highs of 2022 and 2024. Endeavour pays no dividend.
Endeavour is based in Vancouver and mines in Mexico and Peru. The Guanaceví and Terronera mines are in Mexico, Kolpa is in Peru. The older Bolañitos mine was sold in January 2026.
2026 is running weaker than planned. A blockade stopped Terronera for twelve days in August, and the Guanaceví mill was down for repairs from 21 September. Endeavour therefore expects silver output at or slightly below the low end of its guidance of 8.3 to 8.9 million ounces (Q3 2026 production report).
Vizsla Silver Corp.
Vizsla Silver has not produced a single ounce of silver yet. The company is developing the Panuco project in the Mexican state of Sinaloa and is therefore in a different risk class from every other company here.
An explorer is a mining company that searches for and develops deposits but does not yet earn revenue from production.
The feasibility study of November 2025 shows an average of 20.1 million silver equivalent ounces a year for the first five years. Over the planned 9.4-year life of mine it is 17.4 million ounces a year. The study calculates an after-tax net present value of $1.8 billion and an internal rate of return of 111 percent, based on $35.50 per ounce of silver and $3,100 per ounce of gold (feasibility study).
These figures are plans, not results. In its outlook of 20 January 2026, Vizsla named a construction decision in the second half of 2026, once permits are received, and first production in the second half of 2027 (2026 outlook). If the timetable slips or the silver price falls below the study’s assumptions, it hits you much harder here than with a producing miner.
Shortly after that outlook, the project was hit by a grave security incident. On 28 January 2026 Vizsla reported that ten people had been taken from its site near Concordia in Sinaloa (company update). In February it suspended site operations and continued the engineering work remotely. On 6 April 2026 the company confirmed that nine colleagues had been found dead and one was still missing (update of 6 April). In June it stated that no production decision had been made yet, so whether the original timetable still holds is open.
Silver stocks vs. silver: who led since 2025?
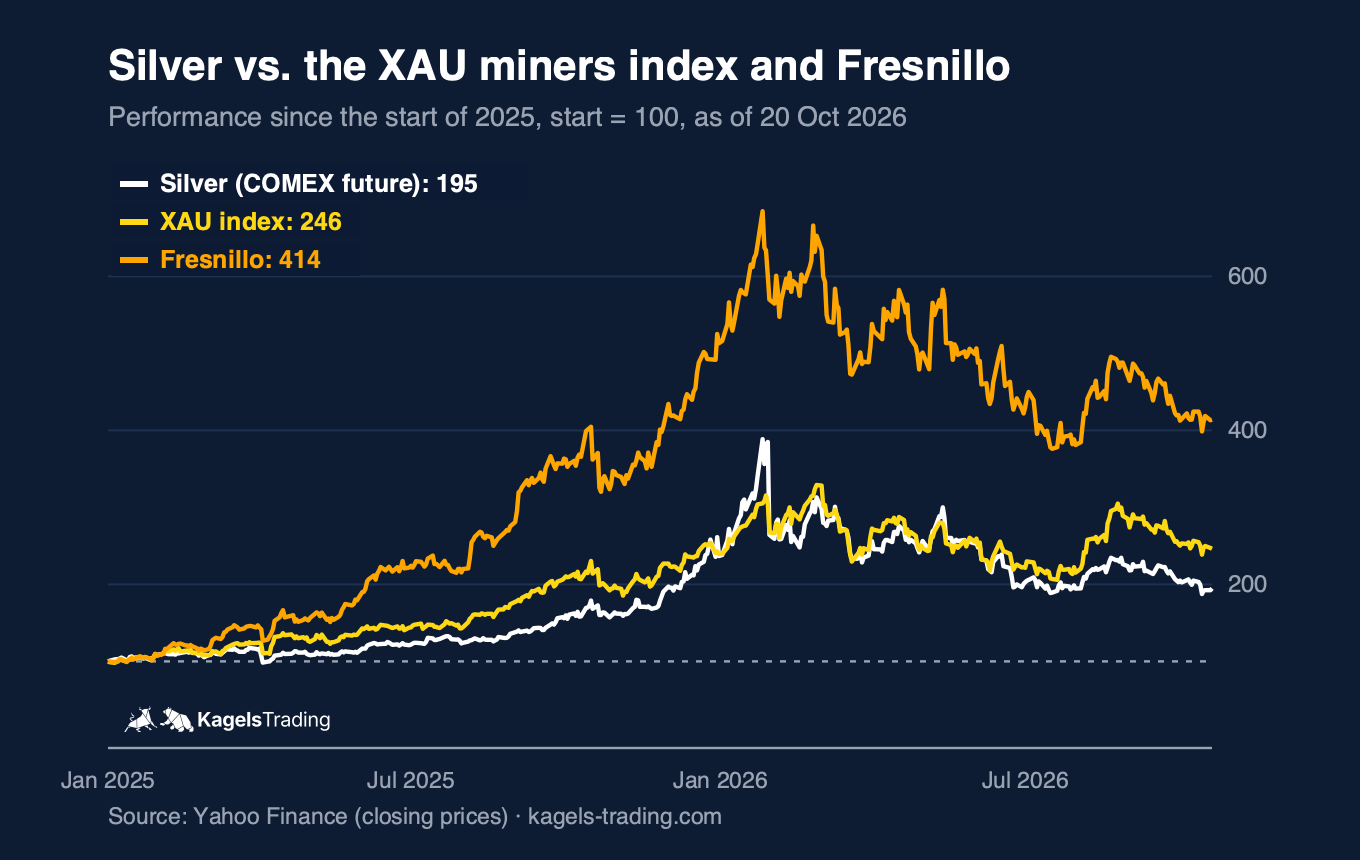
The expected catch-up of the mining stocks did happen, and it was bigger than the rise of the metal. From the start of 2025 to 20 October 2026, silver rose 95 percent. The XAU miners index gained 146 percent over the same period, Fresnillo even 314 percent. The comparison uses prices in each instrument’s own currency without dividends, with silver as the continuous COMEX futures series.
 Click to enlarge
Source: Yahoo Finance.
The leverage works on the way down too. From its record high in January 2026, silver fell by more than half by October. The miners index lost only about 25 percent, because it consists mostly of gold miners and gold corrected less. For the coming quarterly reports, it helps that silver has cost about $72 on average in 2026 so far, after about $40 in 2025. Whether this higher average price reaches the miners’ profits also depends on output, costs and hedging.
The XAU and HUI indices
The XAU and the HUI are the two best-known indices of listed precious metals miners. Both bundle many companies, so a single stock’s surprise matters less. That makes them useful for reading the trend of the whole sector.
The Philadelphia Gold and Silver Index (XAU)
The XAU contains 30 gold and silver miners and is calculated by Nasdaq. It started on 19 January 1979 with a base value of 100 points. No single stock may weigh more than 8 percent, so the index dampens the effect of outliers.
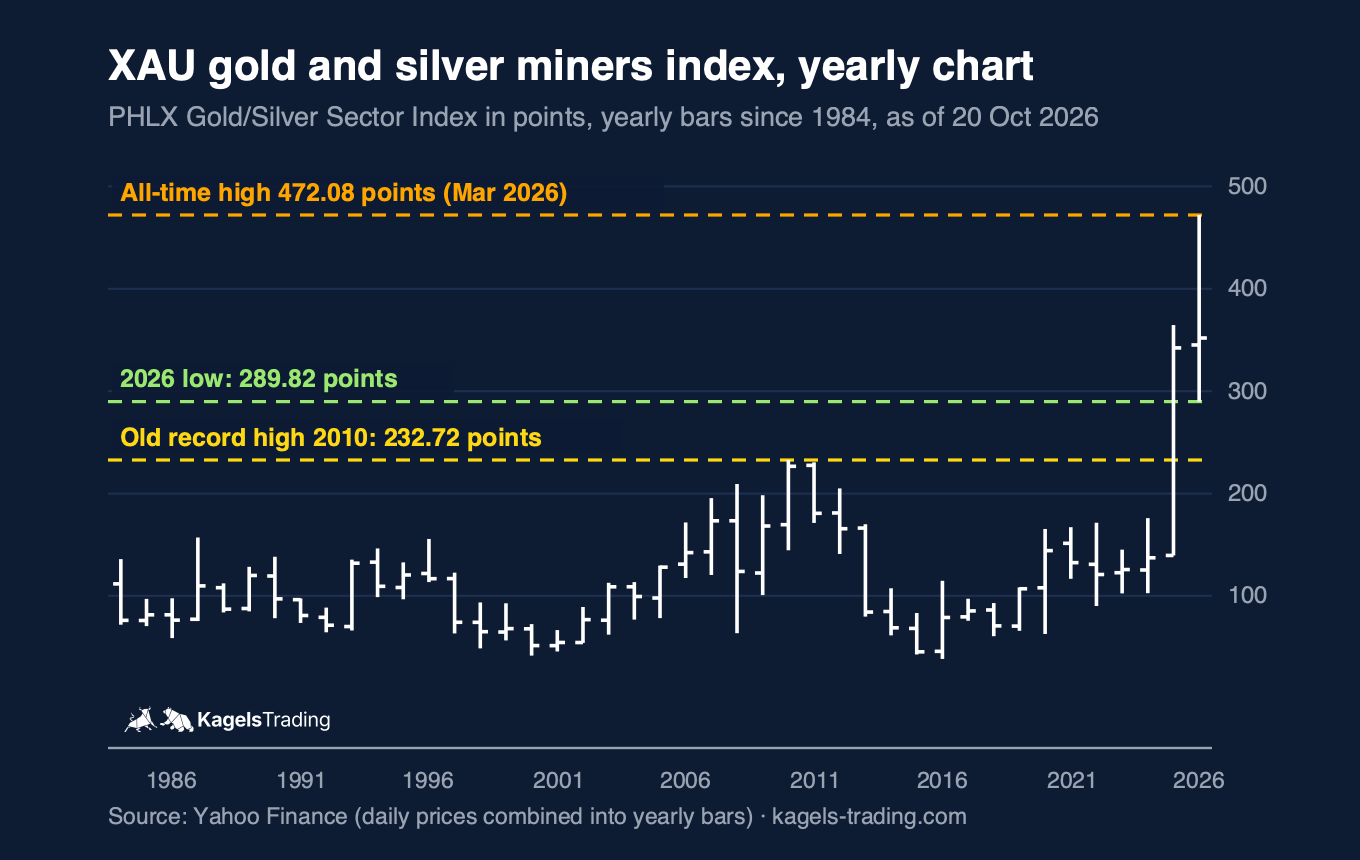
In 2025 the XAU broke its record high from 2010. The old high was 232.72 points in December 2010. The index then fell as low as 38.36 points in January 2016. From 2021 to 2024 it moved between about 90 and 175 points, before rising from 137.18 to 342.28 points in 2025. On 2 March 2026 it set a new all-time high of 472.08 points.
 Click to enlarge
Source: Yahoo Finance.
The old record high at 232.72 points is now the long-term support. Above it lies the 2026 low of 289.82 points from 17 July. As long as the index stays above that, 2026 remains a consolidation below the all-time high. A yearly close above 342.28 points, the 2025 close, would make 2026 a positive year. In late October the index stands just above that mark.
The long-term trend is still up, but short-term momentum is missing. Only a break below 289.82 points would signal a deeper correction towards the old record high. A new run at 472 points needs firmer silver and gold prices.
The NYSE Arca Gold BUGS Index (HUI)
The HUI only contains gold miners that hedge little of their output. BUGS stands for Basket of Unhedged Gold Stocks. Only miners that do not hedge their production more than one and a half years ahead are included. When the gold price rises, their revenue therefore reacts more strongly than at miners that sold their output in advance at fixed prices.
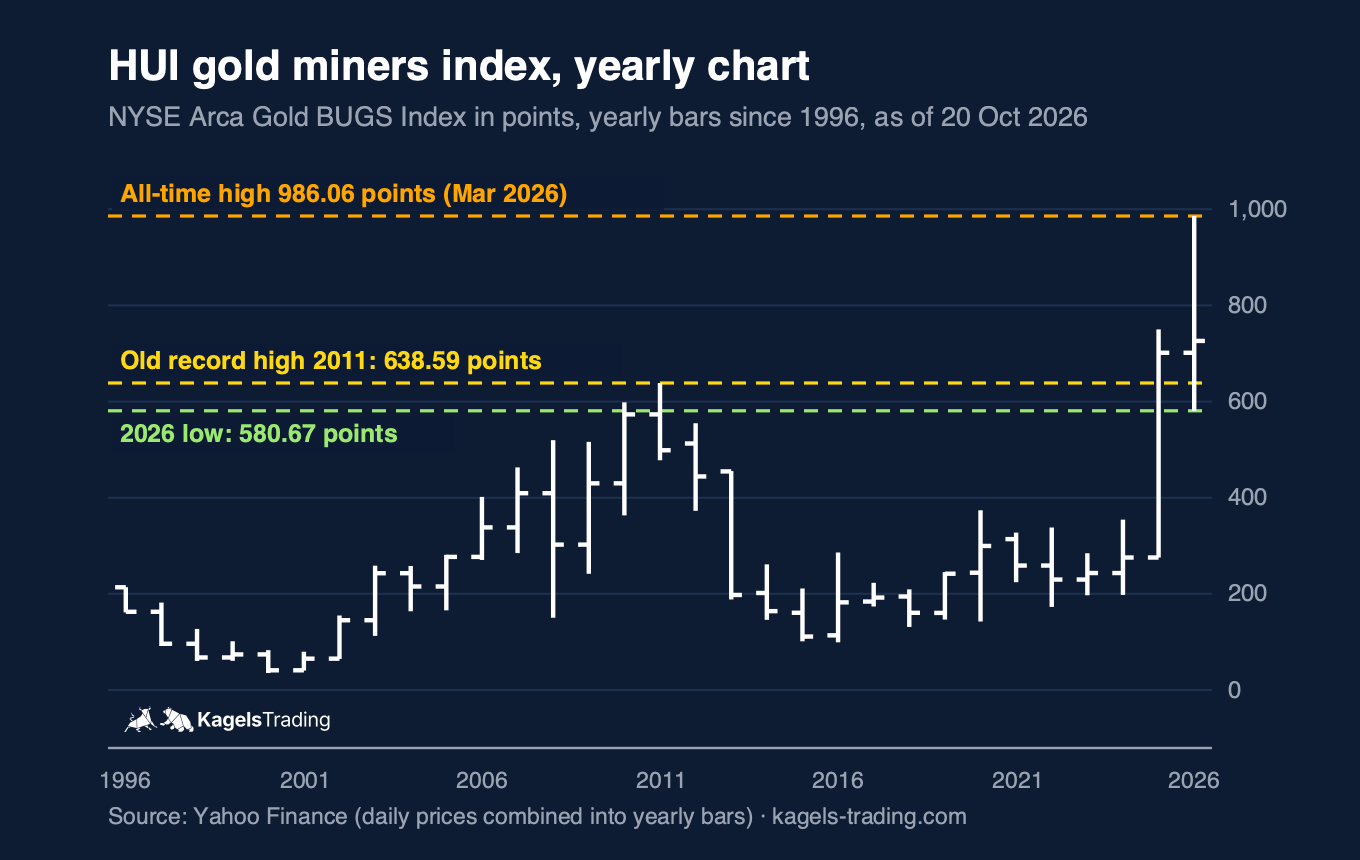
The HUI has also left its old record high behind. The previous high was 638.59 points in September 2011. After the low of 99.19 points in January 2016, the index moved for years between about 130 and 375 points. In 2025 it rose from 275.58 to 701.49 points, and on 2 March 2026 it reached a new all-time high of 986.06 points.
 Click to enlarge
Source: Yahoo Finance.
The key HUI levels are closer together than those of the XAU. The 2026 low of 580.67 points on 17 July was already below the old record high of 2011. So the index has tested this zone once and recovered from it. A yearly close above 701.49 points, the 2025 close, would turn the year positive.
The area between 580 and 640 points is the decisive support zone. If it holds, the larger uptrend stays intact. A break below it would question the breakout of 2025 and make a longer correction likely.
Silver ETFs as an alternative
If you want silver without the risks of a single company, an exchange-traded product is the simpler route. The iShares Silver Trust (SLV) is a physically backed trust, not a conventional investment fund, and tracks the metal price. Miners can be bought as a basket: the Global X Silver Miners ETF (SIL) and the Amplify Junior Silver Miners ETF (SILJ) hold silver-related companies, streamers such as Wheaton included. SILJ focuses on smaller companies by its mandate, but also holds large names.
Silver is not a reliable hedge against falling stock markets. In the 2008 financial crisis the silver price first fell sharply as well and only recovered afterwards. As an addition to a portfolio, silver can still spread risk, because it reacts to other factors than stocks. With exchange-traded commodities (ETCs) you also carry the risk of the issuer, even though most silver ETCs are backed by physical metal.
Private investors in the EU usually cannot buy US-listed ETFs. Retail clients in the European Economic Area may only buy such products if a key information document exists, and most US funds do not provide one (European Commission on PRIIPs). For the metal, European investors use exchange-traded commodities (ETCs) on silver. For the companies, there are UCITS funds on silver miners, such as the Global X Silver Miners UCITS ETF. Check the costs and the type of backing before you buy.
Why silver attracts investors
Silver is not only a store of value like gold. More than half of global demand comes from industry. The metal conducts electricity better than any other and is therefore used in electronics, electrical contacts and solar cells. For you this means the silver price depends not only on inflation fears but also on the economy.
The gold to silver ratio shows how many ounces of silver you need to buy one ounce of gold.
Many investors use the ratio as a rough guide. A historically high value is seen as a sign that silver is cheap relative to gold. But there is no automatic mechanism. The ratio can stay at an extreme for years without a return to the mean.
The silver market has been in a supply deficit for years. In the Silver Institute’s World Silver Survey 2026 of April 2026, 2025 was the fifth deficit year in a row. For 2026 the analysts expect a gap of 46.3 million ounces. Industrial demand already fell by three percent in 2025 to 657.4 million ounces and is expected to fall by another three percent in 2026.
Solar demand deserves a closer look. The popular story says the expansion of photovoltaics will push silver demand ever higher. In fact, manufacturers have long been working to replace silver in their cells with cheaper materials or to use less of it. The Silver Institute already named this in February as one reason for weaker industrial demand. The deficit remains because mine supply is not growing in 2026.
Silver producers like to market a long list of arguments. First Majestic’s company presentation, for example, says silver is a real asset, cheap compared with gold and outperforms in bull markets. Statements about rising demand and falling supply are added. Such arguments are marketing by a company that lives off the silver price, and part of it does not match the latest market data: total demand fell slightly in 2025, and mine supply rose three percent to 846.6 million ounces.
A short history of the silver price
Like almost any commodity, silver is priced by supply and demand. Because silver cannot be made artificially, supply depends on natural deposits. Prices also react strongly to speculation, as one of the most famous episodes in market history shows.
The Hunt brothers drove the silver price to a legendary peak at the end of the 1970s. With large loans they bought huge amounts of silver on the futures markets. In January 1980 the price came close to $50 an ounce. Exchanges then intervened and only allowed existing positions to be closed. Many private people also sold their silverware and coins at the top, which added supply. By 1982 the price had fallen below $5.
Precious metals are weighed in troy ounces. One troy ounce weighs 31.1034768 grams, more than the common ounce of about 28.35 grams. The name goes back to the medieval trading town of Troyes in France. Gold, platinum and palladium are weighed the same way.
For the silver price itself, see our regular forecast. The silver price forecast reads XAG/USD, silver in US dollars, on several time frames with charts and levels. Silver is not the only precious metal with a large industrial share: in palladium it is around 80 percent, as the palladium forecast explains.
Conclusion: big leverage, big differences
In 2025 and early 2026 silver stocks showed how strong their leverage on the silver price is. The XAU miners index and Fresnillo rose much more than the metal itself. After the record highs of early 2026, the single stocks in our charts lost between 25 and 50 percent. If you buy silver stocks, you have to be able to sit through such swings.
The differences between the companies are bigger than the shared name suggests. Hecla and Pan American report low costs per ounce of silver, Endeavour much higher ones. Wheaton and Fortuna depend more on the gold price, and Vizsla does not produce yet. So check the business model, costs and country before you buy.
Silver stocks can be an addition to a portfolio, but they are no substitute for physical silver. Given the swings shown above, position size and planned exit levels belong to sound risk management. The chart levels in this guide show where the market has turned before. This is market analysis, not investment advice.
Frequently asked questions about silver stocks
What are silver stocks?
Silver stocks are shares of companies that earn money with silver. These are producers with their own mines, streaming companies that buy part of other companies’ output, and explorers that are still developing deposits. Many of them also mine gold, copper or zinc.
Which other silver stocks are there?
Beyond the ten companies in this guide, several other listed companies have a meaningful silver business. A selection as of October 2026: Industrias Peñoles (PE&OLES, Mexican stock exchange), Hochschild Mining (HOC, London), Aya Gold & Silver (AYA, Toronto), Avino Silver & Gold Mines (ASM, NYSE American), Americas Gold and Silver (USAS, NYSE American), Santacruz Silver (SCZM, Nasdaq), Andean Precious Metals (APM, Toronto), Buenaventura (BVN, NYSE), SSR Mining (SSRM, Nasdaq) and GoGold Resources (GGD, Toronto). Many names from older lists no longer exist: MAG Silver, SilverCrest and Gatos Silver were taken over in 2025, Yamana, Goldcorp and Tahoe even earlier.
How much do silver stocks cost?
Silver stock prices vary widely. On 20 October 2026 the four stocks in our monthly charts cost between $8.20 (Endeavour Silver) and $44.29 (Pan American Silver), while Fresnillo stood at 26.89 pounds in London. More important than the share price are your broker’s commissions and the exchange you trade on.
Why invest in silver stocks?
Silver stocks offer leverage on the silver price. When it rises, miners’ profits can grow faster, and some companies pay dividends. But they also carry risks that physical silver does not have, such as production outages, rising costs, country risk and management mistakes. Silver stocks are therefore better suited as an addition than as a pure hedge.
What drives the silver price?
The silver price depends on industrial and investment demand. Industrial demand comes from electronics, cars and solar power, investment demand from people who want to protect themselves against inflation or spread their risk. On the supply side, mine output matters most, and a large part of it comes as a by-product of gold, lead and zinc mining.
This English edition is based on our German edition on kagels-trading.de and has been adapted for international readers.