
Wheat Futures: Chicago, Kansas City and What Moves Prices


Contents
- Wheat futures in 30 seconds
- What is a wheat futures contract?
- Wheat futures contract specs at a glance
- What moves the wheat price?
- My test: in which months does wheat move the most?
- From my trading: wheat on the yearly and daily chart
- The spread between Kansas City and Chicago
- How can you trade wheat as a private trader?
- Risks of trading wheat
- Reading the COT report for wheat
- Conclusion: two US wheat markets, two stories
- Frequently asked questions about wheat futures
- About the author
The US hard red winter wheat crop falls by 42 percent in 2026/27, according to the US Department of Agriculture. On the exchange, this wheat in Kansas City costs almost 50 cents per bushel more than the soft wheat traded in Chicago. Differences like this make wheat futures more than a single market.
This guide shows how the two US wheat contracts at the Chicago Board of Trade work. You learn what a tick is worth, when the market is open, how daily price limits work, what moves the price from the WASDE report to the Black Sea, and how the KC-Chicago spread works. It ends with my own seasonal test over 19 years and my charts. This article follows our editorial policy and is for education, not investment advice.
Wheat futures in 30 seconds
- Two US contracts: Chicago (ZW) for soft red winter wheat and Kansas City (KE) for hard red winter wheat, both on 5,000 bushels at CBOT.
- What a tick is worth: the smallest price step is a quarter cent per bushel, or $12.50. A one cent move is worth $50 per contract.
- Smaller contract: the Micro on Chicago wheat covers 500 bushels and settles in cash.
- Price drivers: crops in the US, the EU and the Black Sea, the monthly WASDE report, exports and the dollar.
- My test: from 2007 to 2025, the average daily high-to-low range of Chicago wheat was 3.26% in June and July and 2.45% in December.
What is a wheat futures contract?
A wheat futures contract is an exchange-traded contract on a fixed amount of wheat of a set quality, priced today and delivered and paid for in a later contract month.
Unlike corn, there is no single wheat. Bakers need different wheat than makers of cookies or pasta, so the exchange lists different classes in separate contracts.
The Chicago contract is based on soft red winter wheat (SRW), according to CBOT rulebook chapter 14. No. 2 hard red winter and northern spring wheat are also deliverable at the contract price; wheat with more than 13.5 percent moisture is not deliverable.
The Kansas City contract is based on hard red winter wheat (HRW) with at least 11 percent protein, according to chapter 14H. It is milled mainly into bread flour. Below 10.5 percent protein it is not deliverable.
A bushel is a US measure of volume that equals 60 pounds or about 27.2 kilograms for wheat. One contract of 5,000 bushels is therefore about 136 metric tons. As a trader, you do not want the wheat; you close or roll your position before the delivery period.
Wheat futures contract specs at a glance
Chicago and Kansas City are built the same way except for the wheat class and the delivery points. All prices are in US cents per bushel, and all times are Chicago time (CT).
| Feature | Chicago (ZW) and Kansas City (KE) |
|---|---|
| Exchange | CBOT, part of CME Group |
| Size | 5,000 bushels, about 136 metric tons |
| Quoted in | US cents per bushel |
| Tick | ¼ cent = $12.50 |
| One cent is worth | $50 |
| Contract months | Mar, May, Jul, Sep, Dec |
| Settlement | physical delivery |
| Trading hours (CT) | Sun to Fri 7:00 p.m. to 7:45 a.m., Mon to Fri 8:30 a.m. to 1:20 p.m. |
| Last trading day | business day before the 15th of the contract month |
A worked example shows what one contract moves. According to CME, the Chicago March 2027 contract settled at 592.00 cents per bushel on 20 November 2026. The settlement price is the exchange’s official daily price, used to calculate daily gains and losses. One contract therefore stood for about $29,600 worth of wheat.
The Kansas City March contract stood at 640.25 cents on the same day, a good 48 cents higher. If the price rises 10 cents, a long position in either contract gains $500; if it falls 10 cents, it loses the same amount.
The Micro wheat contract
The Micro wheat futures contract with the code MZW is based on the Chicago contract and covers 500 bushels. Its size is one tenth of the standard contract. The tick is half a cent, worth $2.50 per contract, according to chapter 14O.
The Micro is cash-settled and expires a month earlier. It settles at the settlement price of the matching Chicago contract on its own last trading day, the Friday that is at least two business days before the last business day of the month before the contract month. How to size small futures from the stop is shown in our guide to micro futures.
First notice day
First notice day is the first day on which delivery notices can be issued. For Chicago and Kansas City, it is the last business day before the contract month, and many brokers set their own, earlier deadline.
For the December 2026 contracts, first notice day is 30 November 2026 and the last trading day is 14 December. For March 2027, they are 26 February and 12 March 2027, and Kansas City follows the same calendar.
Trading hours
Both CBOT wheat contracts trade on CME Globex in two sessions. The overnight session runs from 7:00 p.m. to 7:45 a.m. CT (8:00 p.m. to 8:45 a.m. ET), the day session from 8:30 a.m. to 1:20 p.m. CT (9:30 a.m. to 2:20 p.m. ET). Our overview of futures market hours lists the same times for all grain markets.
The week starts on Sunday evening in Chicago. Outside the US, the gap between your clock and Chicago changes twice a year, because the US and Europe switch daylight saving time on different dates; in 2027, the gaps are 14 to 27 March and 31 October to 6 November.
Daily price limits
Chicago and Kansas City wheat have a daily price limit. Normally there is no trading at a price more than the limit above or below the previous day’s settlement price.
CBOT resets the limit twice a year, under rule 14102.D. The new limits take effect on the first trading day of May and of November. They are based on the average settlement price of the nearest July or December contract over 45 trading days up to the business day before 16 April or 16 October; seven percent of that average, rounded to 5 cents and at least 30 cents per bushel, gives a preliminary value.
The exchange calculates that value separately for Chicago and Kansas City, and the higher one applies to both. According to CME’s overview, the limit is currently 55 cents per bushel for both, or $2,750 per contract. The expanded limit is 85 cents.
The expansion is linked too. If one of the first five contract months after the spot month settles at the limit in either market, the expanded limit applies to all contract months the next business day, until all months of both markets settle within the normal limit again. Two consecutive days at the expanded limit make it the new normal limit. The expiring contract has no limit from the second business day before the delivery month, and if the market moves against you to the limit, you may not be able to exit that day.
A side note: milling wheat in Paris
Euronext in Paris lists a milling wheat contract (code EBM), often called Matif wheat after the former Paris futures exchange. It covers 50 metric tons of EU wheat, is quoted in euros per ton and serves as the European price benchmark. Trading ends on the 10th calendar day of the delivery month, or the next business day if that day is not a business day; the March 2027 contract settled at 233.00 euros per ton on 20 November 2026.
What moves the wheat price?
The wheat price depends on the crops of the large exporters, on exports themselves, on stocks and on the dollar. The crop and trade figures below come from the WASDE report of 10 November 2026.
The US crop by class
The USDA expects a 2026/27 US wheat crop of 1.53 billion bushels, after 1.99 billion the season before. The yield fell from 53.3 to 48.1 bushels per acre, and the harvested area from 37.3 to 31.9 million acres.
Hard red winter wheat is hit hardest. Its crop falls from 806 to 466 million bushels, while soft red winter wheat drops from 353 to 294 million. The smaller hard red winter crop is a plausible explanation for why Kansas City currently trades above Chicago.
Winter wheat is planted in Kansas mainly from mid-September to mid-October and in Illinois in October, and harvested the following June and July. That is what the USDA’s usual planting and harvesting dates show. In between lie winter and spring, when frost and drought decide the yield.
Exports: Russia, the EU and the Black Sea
The USDA expects a 2026/27 world wheat crop of 827.5 million metric tons. The EU harvests 133 million tons after 145 million the year before, China 141, India 121 and Russia 88 million tons.
Russia is the largest exporter with 39 million tons, ahead of the EU with 31, Canada with 30.5, Australia with 24.5 and the US with 20.4 million tons. Russia and Ukraine on the Black Sea together supply about a quarter of world trade of 209 million tons. Conflicts, export quotas or closed ports can therefore move the price in a single day.
The WASDE report
The WASDE report (World Agricultural Supply and Demand Estimates) is the monthly USDA estimate of supply, use and stocks for the main agricultural commodities worldwide.
It is released at 12 noon ET, during the CBOT day session. The next dates according to the USDA are 10 December 2026, 12 January 2027 and 10 February 2027. For wheat, the key figure is ending stocks: the USDA expects 743 million bushels in the US after 920 million, and 280.8 million tons worldwide.
The dollar and corn
Chicago and Kansas City are quoted in dollars. A strong dollar makes US wheat more expensive for foreign buyers and helps exporters in Europe and Russia. Our economic calendar guide shows how to track the release dates that move currencies.
Wheat is also a feed grain. If it becomes cheap relative to corn, it replaces part of the corn in feed, and the two prices move closer. Our guide to corn futures explains the corn market.
My test: in which months does wheat move the most?
I wanted to know in which months wheat is most restless. I analysed the daily bars of the continuous front-month Chicago contract (CBOT:ZW1!) from TradingView, 4,782 trading days from 2007 to 2025.
The measure is the distance between a day’s high and low as a percentage of the close, averaged by calendar month. Bars with missing values, a high equal to the low or a close outside the range were removed; that affected two days.
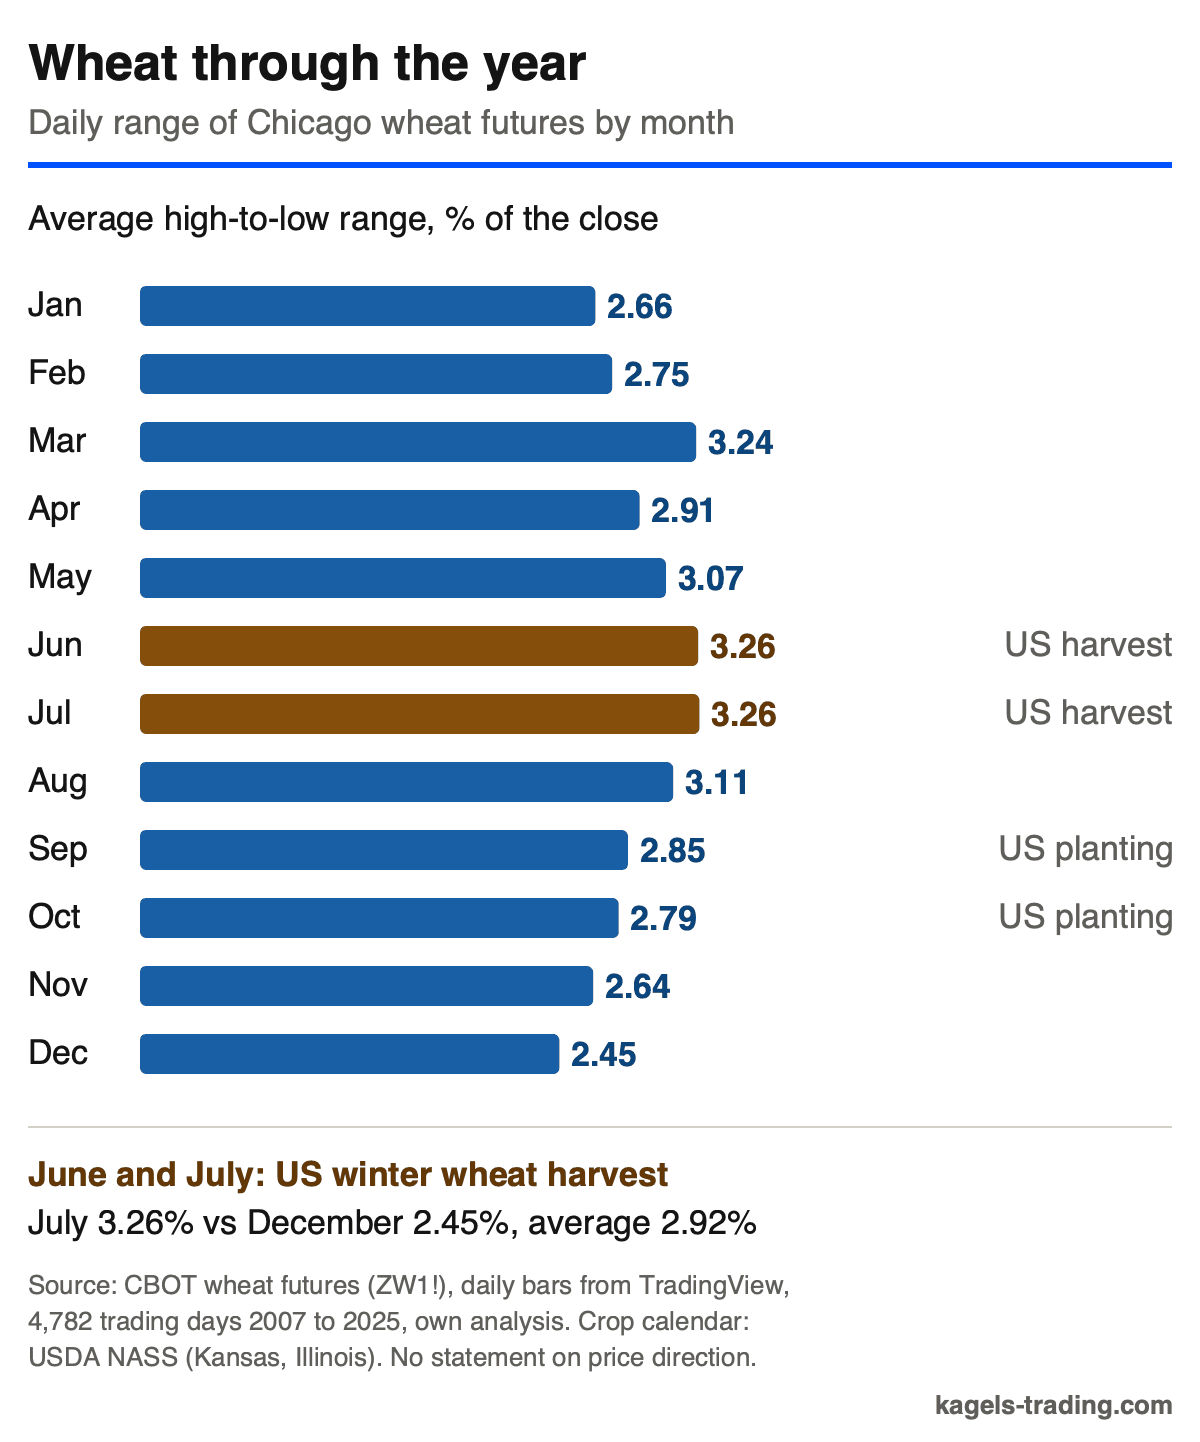
The graphic shows the result next to the crop calendar.
 Click to enlarge
In June and July, the average daily high-to-low range was 3.26% each, rounded, in December 2.45%. The average across all trading days is 2.92%, and March comes close to the summer months at 3.24%.
The gap between the most and the least restless month is about 33 percent. July was above the average of its year in 14 of 19 years, above December in 15 of 19 years, and the most restless month of the year in 4 years.
In this sample, the daily range is wider in every month from March to August than in any month from September to February. The US winter wheat harvest falls in June and July, but the test alone does not prove that this is the cause.
The test has limits. A wider range says nothing about direction, and the continuous contract mixes several contract months. So check the current volatility and adjust your stop and position size to your setup.
From my trading: wheat on the yearly and daily chart
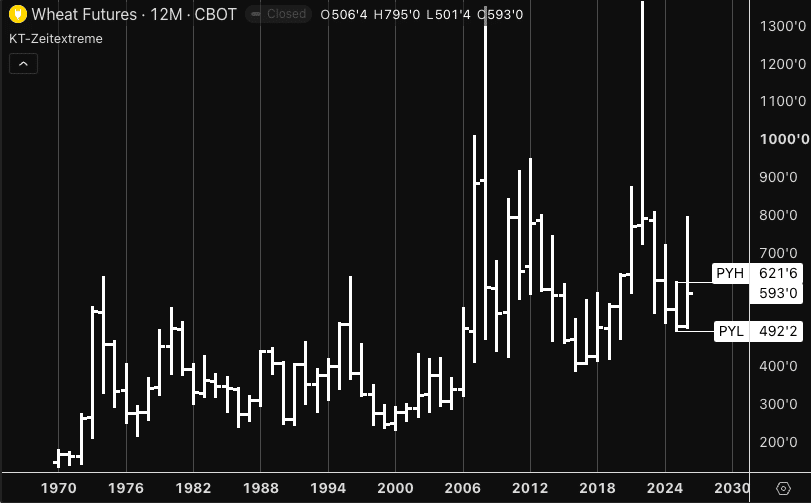
On a yearly chart, each bar is one calendar year. The open is the tick on the left, the close the tick on the right, and the bar spans the year’s high and low. The chart below shows CBOT Chicago wheat futures since 1970.
 Click to enlarge
Source: TradingView, CBOT:ZW1!.
After the correction of the previous years, this year looks relatively stable again. In principle, I expect the long-term uptrend to continue, and the correction of the last years may be over.
The chart marks the prior year high, Previous Year High (PYH), at 621.75 cents and the prior year low (PYL) at 492.25 cents. In 2026, the contract opened at 506.50 cents and traded between 501.50 and 795.00 cents up to 20 November; the chart shows a price of 593.00 cents. TradingView quotes wheat in eighths of a cent, so 593’0 means 593 cents.
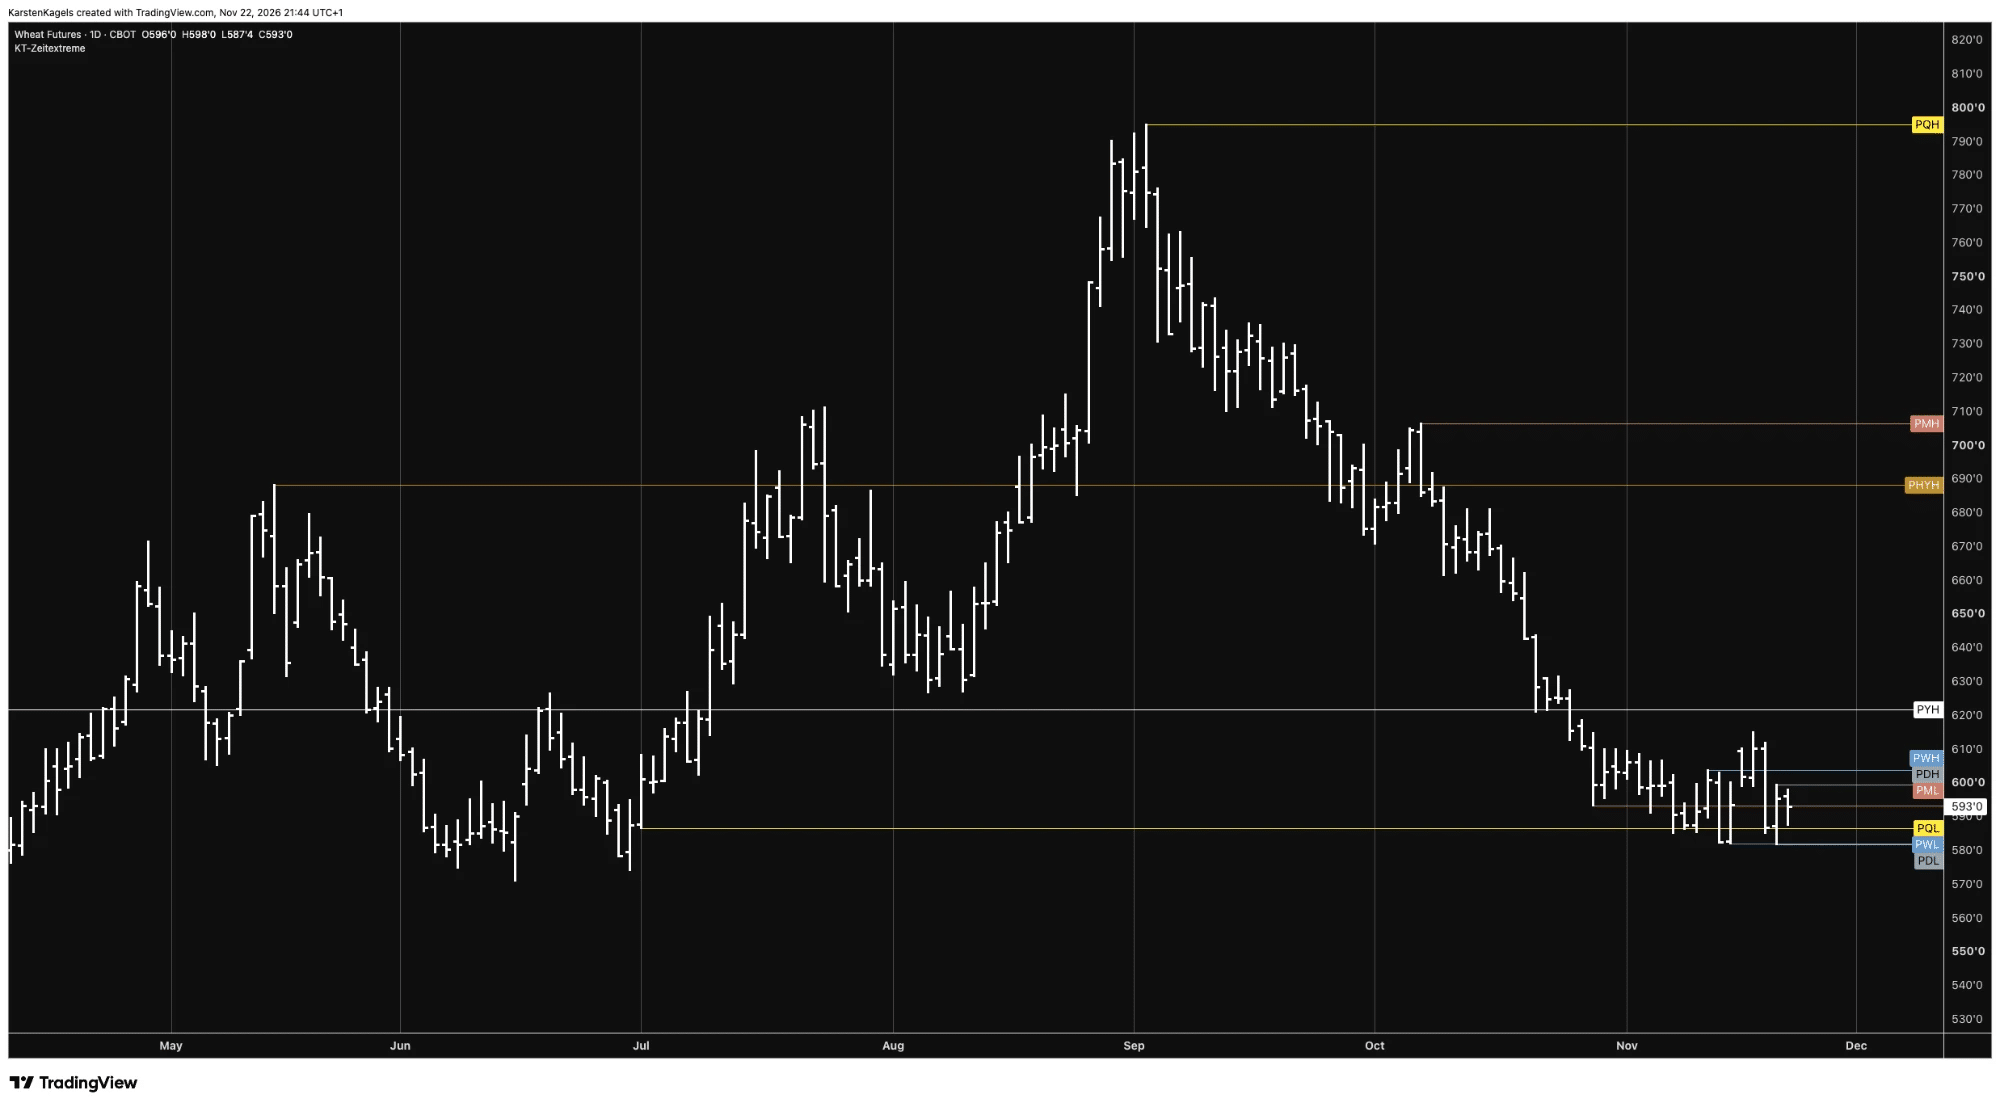
The daily chart shows the move since late April 2026. It marks, among other levels, the prior quarter high (PQH), the prior quarter low (PQL) and the prior year high (PYH).
 Click to enlarge
Source: TradingView, CBOT:ZW1!.
On the daily chart, the wheat price corrected from the September high to below the July low and also fell below the prior year high. It will now show whether the correction is over and the price turns back toward the year’s high, which the yearly chart shows at 795.00 cents. This is my assessment as of 20 November 2026, not a trading signal and not investment advice.
Futures are leveraged, and losses can exceed the margin you put up. Plan every trade with a stop and a position size before you enter.
The spread between Kansas City and Chicago
Many professionals trade not the direction of wheat, but the difference between two classes. In a spread, you buy one contract and sell the other at the same time, so your result depends only on the difference.
The KC-Chicago wheat spread is the price difference between hard red winter wheat in Kansas City and soft red winter wheat in Chicago; it shows how scarce bread wheat is compared with soft wheat.
On 20 November 2026, the Kansas City December contract stood at 624.50 cents and Chicago at 574.25 cents, a difference of 50.25 cents. The smaller hard red winter crop is a plausible explanation for this premium, but crop and price data alone cannot prove the cause.
Because both contracts have the same size, a 10 cent change in the spread equals $500. A spread can still lose money if the difference moves against you, and it often moves more calmly than a single contract but not always.
How can you trade wheat as a private trader?
You have three routes. The futures contracts themselves, the Micro, or a leveraged product from a CFD provider outside the US. Which one fits depends mainly on your account size.
The futures contracts through a futures broker
For the CBOT contracts, you need a broker with access to CME Group. One example is Interactive Brokers. You post margin, a performance bond, not the full value of the wheat.
The exchange sets the margin, and many brokers ask for more. What happens when your account falls below it is explained in our guide to the margin call. Margin is collateral. Your stop distance and position size define your planned risk, but gaps and price limits can make the actual loss larger.
CFDs outside the US
Many CFD providers outside the US offer wheat as a commodity CFD, usually on the Chicago contract. You then trade not on the exchange but with the provider as your counterparty. The differences are covered in futures vs. CFDs. In the US, retail CFDs are not allowed.
Here is what speaks for and against trading the futures contracts directly.
- For: a real exchange price. You trade directly at CBOT, with no issuer in between.
- For: two classes, one exchange. Chicago and Kansas City let you trade soft and hard wheat, and the spread between them.
- For: clear dates. WASDE, crop reports and the COT report give the market fixed events.
- For: a small entry size. The Micro makes Chicago wheat accessible with a smaller account.
- Against: large leverage. One CBOT contract stands for about 136 metric tons, and 10 cents are $500.
- Against: political risk. News from the Black Sea can make the price jump overnight.
- Against: delivery and rolling. Before every contract month you have to close or roll.
- Against: price limits. At the limit, you may not be able to exit your position.
Risks of trading wheat
The biggest risk is the contract size relative to your account. At about $29,600 in value in Chicago, a 5% move is enough for a loss of almost $1,500 per contract.
Wheat also reacts to politics. Export quotas, war news or weather warnings do not come on fixed dates, and a stop may then be filled at a much worse price.
Rolling adds another risk. If you hold for longer, you swap the old for the next contract month before every delivery period. On 20 November 2026, the later Chicago months were higher: December at 574.25 cents, March at 592.00 and July 2027 at 606.25 cents. What this futures curve means is explained in our guide to contango and backwardation.
So set your stop and position size before every trade, and check the current volatility for that. How to do this is shown in our guides to risk management and position sizing, and the stop always comes before the number of contracts.
Reading the COT report for wheat
The CFTC usually publishes the Commitments of Traders on Friday at 3:30 p.m. ET. The report shows positions as of the previous Tuesday; holidays can delay it, according to the CFTC release schedule.
The report separates producers, merchants and processors from Managed Money. Managed Money covers commodity trading advisors and funds that invest other people’s money speculatively.
As of 17 November 2026, Managed Money held 90,741 Chicago contracts long and 175,577 short. That is a net short of almost 85,000 contracts, against open interest of 558,414 contracts. In Kansas City, Managed Money held 55,927 long against 74,068 short.
An extreme Managed Money net position can indicate crowded positioning relative to its history. That alone is not an entry signal, and the report shows positions, not the money traders still have. How to read the report is explained in our guide to the COT report.
Conclusion: two US wheat markets, two stories
There is no single wheat price. Chicago reflects soft US wheat and has the largest volume, Kansas City the bread wheat of the Great Plains, and Paris the European price in euros.
The price is driven by the crops in the US, the EU and the Black Sea, the WASDE report and the dollar. If you want to trade wheat, first choose the right contract, then plan your stop and size. All five grain and oilseed markets, from corn to soybean oil, are on our overview of grain futures.
Frequently asked questions about wheat futures
What is the difference between Chicago and Kansas City wheat?
Chicago trades soft red winter wheat, Kansas City hard red winter wheat with at least 11 percent protein. Both contracts cover 5,000 bushels and trade at CBOT; hard red winter wheat is milled mainly into bread flour.
What is a tick worth in wheat futures?
One tick is a quarter cent per bushel and worth $12.50 in Chicago and Kansas City. A full cent is $50, because one contract covers 5,000 bushels.
When can I trade wheat futures?
CBOT wheat futures trade Sunday to Friday from 7:00 p.m. to 7:45 a.m. CT and Monday to Friday from 8:30 a.m. to 1:20 p.m. CT. In Eastern Time, that is 8:00 p.m. to 8:45 a.m. and 9:30 a.m. to 2:20 p.m.
How much does a metric ton of wheat cost?
At the settlement price of 20 November 2026, a metric ton of Chicago wheat was worth about $218. The March contract stood at 592.00 cents per bushel, and one metric ton is about 36.7 bushels.
Why is Kansas City wheat more expensive than Chicago wheat?
A plausible explanation is the smaller crop of hard red winter wheat, which trades in Kansas City. According to the USDA, it falls from 806 to 466 million bushels in 2026/27. On 20 November 2026, the Kansas City December contract was a little over 50 cents above Chicago.
Is there a small wheat futures contract?
Yes, the CBOT Micro wheat futures contract covers 500 bushels, one tenth of the Chicago contract. It settles in cash, and one tick is worth $2.50.
When are wheat prices most volatile?
In my test of Chicago wheat, the average daily range between high and low was widest in June and July. From 2007 to 2025 it was 3.26% each, rounded, and 2.45% in December.
This English edition is based on our German edition on kagels-trading.de and has been adapted for international readers.
More Markets and Brokers guides
- Open your first account
What Is a Brokerage Account? A US Beginner's Guide
How to open and fund a US brokerage account, cash vs margin, what it costs and what SIPC and FDIC really cover.
- Know what trading really costs
Trading Costs: Every Fee You Pay and How to Cut It
Spread, commissions, SEC and FINRA fees, market data, margin interest and tax, with yearly totals for three trading styles.
- Choose a broker
Interactive Brokers Review 2026: Fees and Platforms
Fees, platforms, investor protection and real futures commissions from a client since 1996.
- Check TradeStation
TradeStation Review 2026: Pricing Tiers, Fees and Platform
Broker and strategy platform: volume tiers for stocks, options and futures checked 21 November 2026, the $5 ticket charge outside the US, fees and EasyLanguage.
- Choose an options broker
tastytrade Review 2026: Options Fees, Margin and Safety
tastytrade from an options trader's own account and its October 2026 fee schedule: fees, the 6.75% margin rate, safety and FINRA fines.
- Check Tradovate
Tradovate Review 2026: Fees, Margins and Who Holds Your Money
The futures broker in many prop firm contracts: all-in costs per plan checked 21 November 2026, the $35 inactivity fee, margins and the clearing firm behind it.
- Check an offshore broker
PU Prime Review 2026: FCA Warning, Licences and Costs
Which PU Prime company you contract with, what the FCA warning means, and what 1:1000 leverage and the deposit bonus do to your account.
- Check an EU CFD broker
Tradeview Review 2026: Tradeview Europe, MFSA and Costs
What the Malta licence of Tradeview Europe covers, how it differs from the Cayman company, and what the three MetaTrader 5 accounts cost.
- Check ZuluTrade
ZuluTrade Review 2026: Costs, Regulation and US Status
Who runs the copy trading platform, what it costs through your broker, why the US was missing from its sign-up form and what the CFTC fined its US company for.
- Check CopyX
CopyX Review 2026: Is TAG Markets Copy Trading Legit?
Who runs the TAG Markets copy trading platform, which regulators warn about it, why US residents are excluded and how fast the 12x Amplify account eats your deposit.
- Choose a US forex broker
OANDA Review 2026: Fees, TradingView and US Rules
OANDA from its own pages and NFA records: spreads and fees, TradingView and the demo, FIFO and three penalties.
- Check a commission-free app broker
Webull Review 2026: Fees, Margin Rates and Safety
Webull from its own fee schedule and FINRA records: what is free, margin rates and Premium, overnight trading, crypto and three fines.
- Understand your price
Market Makers: Who Sets Your Price and How They Profit
How market makers earn on the spread, who sets prices at German trading venues and what the EU ban on payment for order flow changed.
- Trade an index CFD
Index CFDs at Interactive Brokers: Symbols, Costs and Trading
All 13 IBKR index CFDs, margin, stop and close-out worked through for IBDE40, financing, UK hours and the TradingView limit.
- Size an index future
Micro Futures: MES vs MNQ, Tick Values and Risk
MES and MNQ tick values, a worked sizing example from the stop with costs and slippage, and why margin is not your risk.
- Choose between futures and CFDs
Futures vs CFDs: Regulation, Order Execution and Costs
Who your counterparty is, EU, UK and US rules, how stops are triggered on CME and at CFD providers, and booked costs in a DAX example.
- Understand the IBKR Exposure Fee
IBKR Exposure Fee: What It Is and How to Reduce It
Why Interactive Brokers charges a daily fee on high-risk accounts, why weekends count, where to find it and how to reduce it, with a real 1.12 euro notice.
- Read the futures curve
Contango vs Backwardation: Futures Curves Explained
What contango and backwardation mean, what rolling does to a position in each case, and real gold, oil and gas curves from 28 October 2026.
- Understand the spot market
Spot Market Explained: Definition and Settlement Times
What a spot market is, why two days is a minimum and not a limit, and when stocks settle at T+1 in the US, EU, UK and Switzerland.
- Choose a silver future
Silver Futures: SI vs Micro Silver vs 100-oz SIC
SI, Micro Silver and the 100-ounce SIC compared by tick value, risk per contract, margin and December 2026 deadlines.
- Trade soybean futures
Soybean Futures: Contract Specs, Hours and Price Drivers
CBOT soybean contract specs, Mini and Micro, trading hours, daily price limits, WASDE and China, and a seasonal test over 4,784 trading days.
- Trade soybean meal futures
Soybean Meal Futures: Contract Specs, Crush and Price Drivers
CBOT soybean meal contract specs, the Micro, trading hours, price limits, the crush spread with beans and oil, Argentina and a seasonal test.
- Trade soybean oil futures
Soybean Oil Futures: Contract Specs, Biofuels and the Crush
CBOT soybean oil contract specs, the Micro, trading hours, daily price limits, biofuel demand and EPA rules, WASDE and the soybean crush.
- Trade corn futures
Corn Futures: Contract Specs, Hours and Price Drivers
CBOT corn contract specs, the Micro, trading hours in CT, daily price limits, WASDE, ethanol and exports, and a seasonal test over 4,784 trading days.
- Compare grain futures
Grain Futures: Corn, Wheat and Soybeans at CBOT
Corn, wheat, soybeans, soybean oil and meal at CBOT: contract sizes, tick values, shared hours and reports, and how the five markets are linked.
- Understand your taxes
Trading Taxes in the US: How Traders Are Taxed in 2026
US federal rules for 2026: short and long term rates, the $3,000 loss limit, wash sales, the 60/40 rule for futures and trader tax status.