
Kelly Criterion for Traders: Formula, Calculator, Risks


Contents
- Kelly criterion in 30 seconds
- What is the Kelly criterion?
- The Kelly formula for traders: W − (1 − W) / R
- Kelly criterion calculator: plug in your own numbers
- The Kelly fraction is a loss per losing trade, not a position size
- Why full Kelly leads to deep drawdowns in trading
- Half and quarter Kelly: the compromise
- Estimation error: Kelly only knows the past
- Pros and cons of the Kelly criterion in trading
- Kelly criterion in practice: a cap, not a target
- Conclusion: Kelly tells you where the limit is, not where to stand
- Frequently asked questions about the Kelly criterion
- About the author
Under the Kelly formula, I could lose almost 30 percent of my account on a single losing trade. That is the result of a simplified model when I plug in the numbers from my own trading journal. In practice, I risk between 0.5 and 1 percent per trade. The gap between these two numbers is what this article is about.
You get the Kelly formula in the form traders need, a calculator for your own numbers and a simulation with my journal values. In that simulation, the account fell by more than half at some point in every run with full Kelly. What half and quarter Kelly change, and where the model reaches its limits, follows below. This article follows our editorial policy.
Kelly criterion in 30 seconds
- What it is: a formula that uses the win probability and the win/loss ratio to calculate what share of your capital to risk per bet or trade so that the capital grows fastest over the long run in the model.
- The formula for traders: Kelly fraction = win rate minus (loss rate divided by the payoff ratio). With 54.1 % winners and a payoff ratio of 1.89, the model gives 29.8 %.
- What the number means: the share of the account that one losing trade costs in the model. It is your risk per trade only if every loss ends exactly at the stop, and it is never the amount you invest.
- Why full Kelly is too much: in 20,000 simulated runs, full Kelly took the account down a median 91 % from its peak. Five losses in a row cost 83 % in the model.
- Half and quarter Kelly: half Kelly keeps 76 % of the highest possible growth rate, quarter Kelly 45 %. The drawdowns shrink far more.
- The biggest weakness: Kelly works with averages from the past. If the true win rate is two standard errors below the measured one, full Kelly shrinks the account in the model.
What is the Kelly criterion?
The Kelly criterion is a formula that uses the win probability and the win/loss ratio to calculate what share of your capital to risk per bet or trade so that the capital grows fastest over the long run in the model.
The formula does not come from finance but from telecommunications. The scientist John L. Kelly Jr. published it in July 1956 in the Bell System Technical Journal under the title “A New Interpretation of Information Rate”. His thought experiment: a gambler receives advance tips on the outcome of bets over a noisy line. Kelly showed how fast that gambler’s capital can grow at most if the stakes are sized correctly.
The mathematician Edward O. Thorp did most to bring the idea to the markets. He applied it to the stock market, among other places in his paper “The Kelly Criterion and the Stock Market”. You will also see the method called the Kelly formula, Kelly strategy or Kelly bet; they mean the same thing.
The goal of the formula is unusual, and it is often described wrongly. Kelly does not maximize the expected profit of a single trade. It maximizes growth over many trades, where every gain and every loss builds on the current account balance. If you risk too little, you give up growth. If you risk too much, you lose growth to losses that hit a larger account.
The Kelly formula for traders: W − (1 − W) / R
The Kelly formula for traders is: Kelly fraction = W − (1 − W) / R, where W is the win rate and R is the ratio of the average win to the average loss.
Both inputs are in any decent trading journal. The win rate is the share of winning trades in all trades. R is your realized payoff ratio, the average win divided by the average loss. Use the realized values after costs, not the planned price targets.
The formula works with a simplified model. It knows exactly two outcomes: every win pays R times the loss, and every loss costs the same amount. Real trades vary in size; the model replaces them with their averages. For variable payoffs, the mathematician Ricardo Pérez-Marco showed that in his model the Kelly fraction comes out smaller than with the fixed average payoff, in “Kelly criterion for variable pay-off”. The result is therefore an approximation, not a reliable risk limit.
Worked example with the 61 trades from my journal
For the example I do not use made-up values but my own journal. I published the 61 trades in my article on trading math (in German): a 54.1 % win rate, and an average win of 1.89 times the average loss, after costs. Plugged into the formula:
| Step | Calculation | Result |
|---|---|---|
| Loss rate | 1 − 0.541 | 0.459 |
| Divided by R | 0.459 ÷ 1.89 | 0.243 |
| Kelly fraction | 0.541 − 0.243 | 0.298 = 29.8 % |
In the model, a losing trade therefore costs almost 30 percent of the account. On a $10,000 account that is about $2,981. Only if every loss ends exactly at the stop is this also the risk per trade.
There is one more detail in the journal itself. There, the average loss is 0.96R and the average win 1.81R, measured against the planned risk. If you run the model in these planned R units, it lands at about 31 % instead of 29.8 %. Both are model values, not recommendations, and as a position size for trading they are unusable. The next sections show why.
Two ways to write it, one result
Betting guides write the same formula differently, but it calculates the same thing. In sports betting, Kelly is usually written as f* = p − q / b, with p as the win probability, q = 1 − p and b as the net odds, the profit per dollar staked. For a trader, b is simply R. Many betting calculators ask for decimal odds Q instead and use (Q × p − 1) / (Q − 1). In trading terms, Q equals R + 1. With my numbers, (2.89 × 0.541 − 1) / 1.89 also gives 0.298.
The expectancy of a trading system is the average profit or loss per trade, measured in multiples of the amount at risk.
A third way of reading the formula makes it especially clear. The numerator W × R − (1 − W) is your expectancy per dollar at risk. Kelly divides this edge by the payoff ratio. A large edge with a small payoff ratio gives a high Kelly value; the same edge with a large payoff ratio gives a lower one. Without a positive expectancy, without an edge, the Kelly fraction is zero or negative.
The break-even win rate is the win rate at which a system neither wins nor loses over time at a given payoff ratio, and it equals 1 divided by (1 + payoff ratio).
At a payoff ratio of 1.89, it is 34.6 percent. Every percentage point above it is edge, and Kelly turns exactly this edge into a position size. At a payoff ratio of 1, by contrast, you need more than 50 percent winners before the Kelly fraction turns positive at all.
Kelly formula in Excel
In Excel or Google Sheets, the formula needs a single cell. Enter the win rate in A2 (54.1 %) and the payoff ratio in B2 (1.89). In C2, type =A2-(1-A2)/B2 and format the cell as a percentage: the result is 29.8 %. The same simplified model applies as above.
Kelly values for common combinations
The table shows how sensitive the Kelly fraction is to both inputs. It is meant as orientation; you can check your own numbers in the calculator below.
| Win rate | Payoff ratio | Kelly fraction |
|---|---|---|
| 35 % | 3.0 | 13.3 % |
| 40 % | 2.0 | 10.0 % |
| 45 % | 1.0 | no edge |
| 50 % | 1.5 | 16.7 % |
| 55 % | 1.0 | 10.0 % |
| 60 % | 1.0 | 20.0 % |
Kelly criterion calculator: plug in your own numbers
Enter the win rate and payoff ratio from your journal. The calculator shows full, half and quarter Kelly in the simplified model, in percent and in dollars. With a stop distance, it also shows how large the position would have to be if every loss ended exactly at the stop. The 1 % rule is shown for comparison. The preset values are the 61 trades from my journal.
Full Kelly in the model: the share of the account a losing trade costs
29.8%
Break-even win rate at this payoff ratio: 34.6%. The gap between this and your win rate is the edge that Kelly turns into a size.
| Fraction | Share | Loss per losing trade | Position if every loss ends at a 2.0% stop |
|---|---|---|---|
| Full Kelly | 29.8% | $2,981 | $149,071 |
| Half Kelly | 14.9% | $1,491 | $74,536 |
| Quarter Kelly | 7.5% | $745 | $37,268 |
| 1% rule, for comparison | 1.0% | $100 | $5,000 |
The 1% rule is about 29.8 times more cautious than full Kelly in the model.
Editorial warning level above 25%: check that your win rate and payoff ratio come from enough trades after costs. With full Kelly, the account in our simulation with similar numbers fell by more than half at some point in every run.
Simplified model with exactly two outcomes: all wins and losses are replaced by their averages. For real trades of different sizes, the result is an approximation, not a reliable risk limit. The position size applies only if every loss ends exactly at the stop; gaps can cost more. Take the win rate and payoff ratio from as many trades as possible, after costs. Preset: the 61 trades from my journal. Not investment advice. Nothing you enter is stored or sent.
When you try it, you quickly see how strongly the win rate drives the result. Lower the preset by five points to 49 % and leave the payoff ratio as it is: the Kelly fraction drops from 29.8 to 22.0 %. At a 40 % win rate, only 8.3 % is left. This sensitivity becomes a real problem in the section on estimation error.
The Kelly fraction is a loss per losing trade, not a position size
The Kelly fraction tells you what share of the account a losing trade costs in the model, and that equals your risk to the stop-loss only if every loss ends exactly at the stop.
Stake and risk are easy to mix up when you move the formula from betting to trading. In a bet, the stake equals the loss, because a lost bet costs the full stake. In trading, it is different. You buy a position, and on a losing trade you ideally lose only the distance to the stop. If you read “30 percent of capital” as the amount to invest and put 30 percent of the account into one stock, you are working with a different number than the one the model means.
An example makes the difference concrete. An account holds $10,000, and the stop sits 2 % below the entry. If every loss ends exactly at the stop, full Kelly allows $2,981 of risk in the model. For those $2,981 to be lost on a 2 % price move, the position would have to be about $149,000, almost fifteen times the account. That is impossible without leverage, and this is where a calculation exercise turns into a risk of ruin.
Regulators often cap the leverage that retail traders can use. In the European Union, for example, ESMA limited CFDs on individual stocks to 5:1 for retail clients in 2018, and major currency pairs to 30:1, according to ESMA’s announcement of its product intervention measures. Full Kelly in this example needs a multiple of what that rule allowed for single-stock CFDs. Leverage rules differ by country, product and broker, so check the ones that apply to your account.
Converting risk into position size is always the same step. Position size equals the dollar risk divided by the stop distance; the swing trading guide shows this with two SPY trades. Kelly only supplies the first number, the dollar risk. The stop comes from the chart, not from the formula, for example from a level of support and resistance. Our position size calculator does the conversion for stocks.
Why full Kelly leads to deep drawdowns in trading
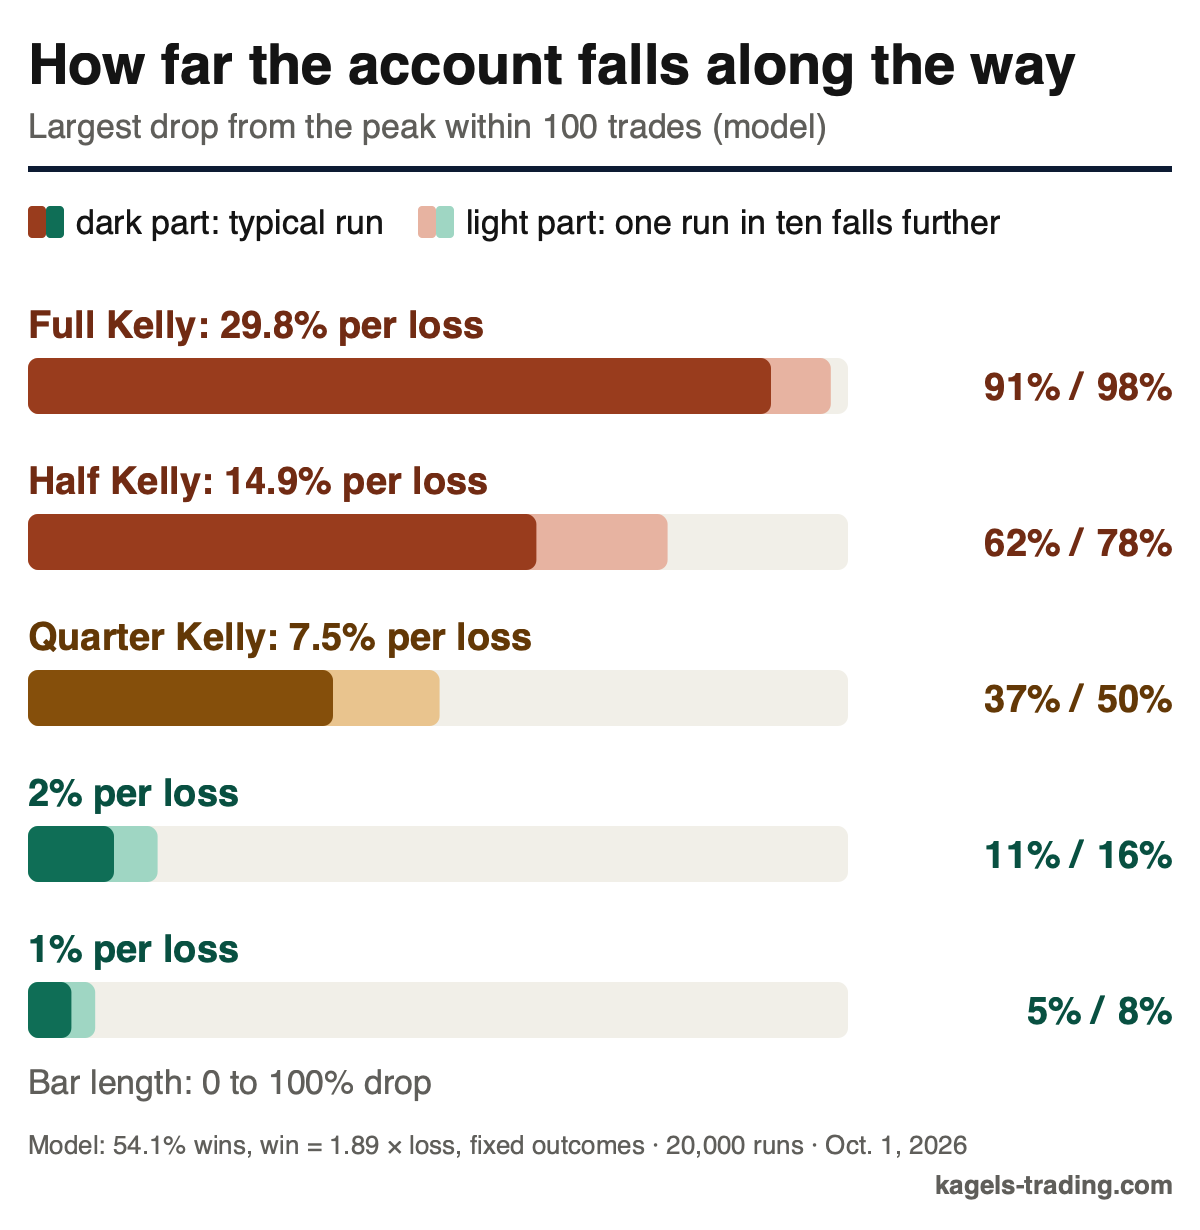
Kelly maximizes the growth rate, not your peace of mind. The formula accepts that the account falls deeply along the way. To see how deeply, we simulated it with my journal values: 20,000 runs of 100 independent trades each, a fixed win rate of 54.1 %, every win 1.89 times a loss, every result applied to the current account balance. The chart shows the typical drop for each position size and the drop that one run in ten exceeded.
 Click to enlarge
Source: Kagels Trading, own simulation.
| Risk per trade | Max. drawdown (median) | Drawdown of 50 % or more |
|---|---|---|
| Full Kelly, 29.8 % | 91 % | in 100 % of runs |
| Half Kelly, 14.9 % | 62 % | in 86 % of runs |
| Quarter Kelly, 7.5 % | 37 % | in 10 % of runs |
| 2 % | 11 % | in no run |
| 1 % | 5 % | in no run |
A drawdown is the decline of an account from its previous peak to the following low, measured in percent of the peak.
With full Kelly, every single one of the 20,000 runs in this simulation saw a drop of at least half. In the median case, the account fell 91 percent from its peak. After a 91 percent loss, the remaining capital would have to grow more than elevenfold just to get back to the old high. Losses and the gains needed to recover them are not symmetrical: a 50 % loss needs a 100 % gain.
The simulation leaves out a lot. It works with fixed wins and losses and a win rate that never changes. Real trades vary more, prices can gap past the stop, and there are phases in which a system simply does not work. All of this can cause additional losses that are not modeled here. And an event that did not occur in 20,000 runs is not impossible.
Five losses in a row
A streak of five losses is not a rare event in trading. With 61 independent trades at my win rate, the probability of at least one run of five losses in a row is about 49 percent in this model. What such a streak does to the account in the model depends only on the position size:
| Risk per trade | Account afterwards | Loss |
|---|---|---|
| Full Kelly, 29.8 % | 17.0 % | 83 % |
| Half Kelly, 14.9 % | 44.6 % | 55 % |
| Quarter Kelly, 7.5 % | 67.9 % | 32 % |
| 1 % | 95.1 % | 4.9 % |
Double Kelly means zero growth
Overbetting means risking more than the Kelly fraction, and it hurts growth more than falling short by the same amount.
Above the Kelly value, the math turns quickly. In the model with my values, the growth rate is zero once you risk 1.96 times the Kelly fraction. Beyond that, the account shrinks over time in the model, even though every single trade has a positive expectancy. If you risk too little, you grow more slowly. If you risk too much, you lose, and that asymmetry is the core of the formula. A close relative of this mistake is doubling up after losses, the martingale approach.
Half and quarter Kelly: the compromise
Fractional Kelly means risking only a fixed share of the calculated Kelly fraction, for example one half (half Kelly) or one quarter (quarter Kelly).
The reduction costs less growth than you might expect. That is due to the shape of the growth curve: it is flat around the Kelly value and only falls steeply toward the edges. In the model with my journal values, half Kelly keeps 76 percent of the highest possible growth rate, and quarter Kelly still 45 percent. This refers to the expected logarithmic growth per trade, not to the share of the final account.
| Risk per trade | Share of the growth rate | Drawdown median |
|---|---|---|
| Full Kelly, 29.8 % | 100 % | 91 % |
| Half Kelly, 14.9 % | 76 % | 62 % |
| Quarter Kelly, 7.5 % | 45 % | 37 % |
| 1 % | 7 % | 5 % |
Even half Kelly is still a lot for an individual trader. A median drop of 62 percent is psychologically hard to bear for most traders, long before the math can play out its advantage. Quarter Kelly, at 37 percent in the median, is still in a range that few people sit through. The jump in the table between quarter Kelly and 1 percent is not a calculation error; it is the reason why fixed percentage rules are so common in trading.
A fraction of Kelly also protects against the formula’s biggest problem. It leaves room in case your inputs are too optimistic. The next section shows how quickly that happens.
Estimation error: Kelly only knows the past
Estimation error describes how far a win rate measured from a sample can differ from the true win rate of a system.
Kelly assumes that you know your probability of winning. With dice, that is true; in trading, never. Your win rate is an estimate from past trades. With 61 trades and 54.1 % winners, the standard error is about 6.4 percentage points. A true rate of 48 or 41 percent is therefore only one or two standard errors below the measured value. With 61 trades, you cannot rule that out, even if the journal is kept correctly.
| True win rate | True Kelly | 29.8 % in the model |
|---|---|---|
| 54.1 % | 29.8 % | highest growth rate |
| 47.7 % | 20.1 % | 22 % below the optimum |
| 41.3 % | 10.3 % | growth negative |
Two standard errors are enough for full Kelly to lose money in the model. If the true win rate is 41.3 instead of 54.1 percent, the system still has an edge; the correct Kelly would be just over 10 percent. But if you keep trading with the old 29.8 percent, you risk almost three times that and lose money over time in the model. With half Kelly, 14.9 percent, the growth rate would stay slightly positive in the model in this case. The middle row of the table compares with the best value possible at 47.7 %, not with the growth at 54.1 %.
This leads to a simple rule for the inputs. Use values from at least 100 trades as a starting point, better from several hundred and from different market phases. That is an editorial rule of thumb, not a statistical guarantee. Calculate with values after commissions and slippage. And when in doubt, take the more cautious estimate: a Kelly value that is too low costs some growth, one that is too high can cost the account.
Pros and cons of the Kelly criterion in trading
Kelly is a valuable tool as long as you know what it measures. The two lists set the strengths and the limits of the formula for trading side by side.
What speaks for the Kelly criterion:
- Reference value: in the model, Kelly shows the position size above which more risk brings less growth.
- Honest edge test: a Kelly value of zero or below shows that a system has no edge on its averages, however good it feels.
- Adjusts itself: because the fraction applies to the current account balance, the dollar risk falls automatically after losses.
- Few inputs: the win rate and payoff ratio are in every journal and are enough for a first approximation.
What speaks against full Kelly in trading:
- Extreme drawdowns: with full Kelly, the account fell a median 91 percent from its peak in the simulation.
- Sensitive to estimation error: a win rate estimated only slightly too high leads to overbetting and can turn growth negative.
- Simplified model: the basic formula works with two fixed outcomes and knows neither positions that are open at the same time nor the correlation between them.
- Unrealistic position sizes: with tight stops, full Kelly requires positions that are only possible with high leverage.
Kelly criterion in practice: a cap, not a target
In practice, Kelly works better as a cap than as a target. The value shows whether a system has an edge on its averages, and how much room there is between the actual risk and the point above which, in the model, more risk does harm. For the position size itself, a fixed percentage well below it is the better choice.
My working range is 0.5 to 1 percent risk per trade. With a model value of 29.8 percent, that is roughly one sixtieth to one thirtieth of full Kelly. It looks overly cautious. But it leaves room for everything the formula does not know: a lower win rate than in the journal, several positions open at once, and gaps past the stop. How this range fares in a prop firm test with a fixed loss buffer is shown in our prop firm drawdown guide.
- Kelly as an edge test: if the value is zero or negative, the system has no edge on these numbers. Then no position size helps; only a revision of the system does.
- Kelly as a cap: used this way, the risk per trade stays well below quarter Kelly, even when a streak goes well.
- Recalculate Kelly regularly: as you collect more trades, plug in the new values, for example after every 50 to 100 trades. If the Kelly fraction falls, the system has lost edge.
- Watch the total risk: when several positions are open at once, the sum counts. Five trades at 1 percent each carry 5 percent of planned risk on paper, and gaps past the stops can cost more, especially in correlated markets.
A quantitative approach often handles Kelly differently from a discretionary one. If you run a system with thousands of trades and stable statistics, you can move closer to a fraction of Kelly, because the estimation error is smaller. How such systems are built and tested is explained in our guide to algorithmic trading. For most private traders with a few dozen trades a year, this does not apply.
Conclusion: Kelly tells you where the limit is, not where to stand
The Kelly criterion answers a precise question: above which risk per trade does an account stop growing faster in the model and start growing more slowly? Knowing this limit is valuable. It shows whether a system has an edge on its averages and how far your own risk is from that limit.
As a position size, full Kelly does not work for trading. In the simulation with my journal numbers, it led to a median drop of 91 percent, and a win rate that is only slightly too optimistic turns the growth rate negative. Half and quarter Kelly soften this but remain too aggressive for most traders. If you use Kelly as a cap and trade a small, fixed percentage below it, you keep the benefit of the formula and greatly reduce its drawdowns. This article is market education, not investment advice.
Frequently asked questions about the Kelly criterion
What is the Kelly criterion?
The Kelly criterion is a formula that uses the win probability and the win/loss ratio to calculate what share of your capital to risk per bet or trade so that the capital grows fastest over the long run in the model. It goes back to John L. Kelly Jr., who published it in 1956.
How do you calculate the Kelly formula for trading?
Kelly fraction = win rate − (1 − win rate) / payoff ratio. With a 54.1 % win rate and a payoff ratio of 1.89, that gives 0.541 − 0.459 / 1.89 = 0.298, so 29.8 % of the account as the loss per losing trade in the simplified model.
Is the Kelly fraction the position size?
No, the Kelly fraction is the amount a losing trade costs in the model. If every loss ends exactly at the stop, that is your risk per trade. The position size only follows when you divide this amount by the stop distance.
What is half Kelly?
Half Kelly means risking only half of the calculated Kelly fraction. With the values from the worked example, it keeps about 76 % of the highest possible growth rate in the model and lowers the median drawdown in the simulation from 91 to 62 %. It is not a safe value.
What does a negative Kelly value mean?
A Kelly fraction of zero or below shows that the system has no positive expectancy on its averages. The formula then says not to trade at all. No position size turns a system without an edge into a profitable one.
What is the downside of the Kelly criterion?
The main downside is the depth of the drawdowns along the way. In our simulation, full Kelly took the account down a median 91 % from its peak. On top of that, the formula is very sensitive to a win rate estimated too high, and its basic form works with only two fixed outcomes, so the result is an approximation.
Is the Kelly criterion suitable for traders?
As a reference and as a test of whether a system has an edge, yes. As a direct position size, no: full Kelly led to drawdowns in the simulation that most accounts do not survive, and it reacts strongly to win rates that are estimated too optimistically. A small fraction of it makes more sense.
This US edition is based on our German edition on kagels-trading.de and has been adapted for US readers.
More Risk Management guides
- Manage your trading risk
Risk Management in Trading: Rules, Math, Psychology
The 1% rule, stops, risk/reward, daily loss limits, leverage caps and the psychology of losing streaks, with the math behind each rule.
- Calculate your position size
Position Sizing in Trading: Formula, Calculator, Examples
The formula, a free calculator, the 1% rule explained correctly, and examples for stocks, forex and futures.
- Keep a trading journal
Trading Journal: How to Record and Review Your Trades
What to write before and after each trade, a completed example with a win and a loss, a weekly review and a template to copy.
- Choose a journal
Best Trading Journal Software 2026: 6 Tools Compared
Six journals compared on price, free plans, refunds, automatic broker sync, costs and export, with a decision guide.
- Check TradeZella
TradeZella Review 2026: Pricing, Features and Limitations
The three plans since July 2026, what Essential leaves out, the no-refund terms, imports, export and what users report.
- Check TraderSync
TraderSync Review 2026: Pricing, Broker Sync and Limits
Prices and the yearly sale, which of 502 brokers really sync automatically, Market Replay, Cypher and the no-refund policy.
- Check Tradervue
Tradervue Review 2026: Imports, Reports and Costs
Silver or Gold, why net P&L needs Gold, automatic import for 5 of 82 brokers, US-only stocks and how cancelling works.
- Check Edgewonk
Edgewonk Review 2026: Features, Costs and Limitations
One plan at $197 a year with a 14-day refund, MetaTrader auto sync, the psychology tools, and screenshots from our own test journal.