
Alexander Elder: Impulse System, Triple Screen and Books


Contents
- Alexander Elder in 30 seconds
- Who is Alexander Elder?
- Elder’s career as a teacher of traders
- The core idea: mind, method and money
- The Elder Impulse System explained
- My test: what happens after green, red and blue days?
- The Triple Screen trading system
- Elder’s other indicators: Force Index and Elder-ray
- Elder’s risk rules: 2% and 6%
- Alexander Elder’s books
- Criticism and limits
- My verdict on Alexander Elder
- Frequently asked questions about Alexander Elder
- About the author
Alexander Elder is a psychiatrist who became one of the most read trading authors in the world. His first book, Trading for a Living, came out in 1993 and is still on almost every list of trading classics. His best known tool is the Impulse System, which colors every price bar green, red or blue.
What makes Elder different is his focus on the trader, not on the market. He writes about discipline, record keeping and risk limits as much as about indicators. I have traded since 1980, and his rule that a system should first tell you when not to trade is one I use myself.
In this article you will learn who Elder is, how the Impulse System and the Triple Screen work, which risk rules he set out, and which of his books to read first. I also tested the Impulse colors on 32 years of SPY data, and the result is not what most summaries suggest. This article follows our editorial policy. It is for education, not investment advice, and past results do not predict future returns.
Alexander Elder in 30 seconds
- Psychiatrist turned trader: born in Leningrad, raised in Estonia, he left a Soviet ship in Africa, practised psychiatry in New York and taught at Columbia University.
- Bestselling author: Trading for a Living (1993) and The New Trading for a Living (2014) are his main works.
- Impulse System: the 13-day EMA and the MACD-Histogram color each bar; red forbids buying, green forbids shorting.
- Triple Screen: the weekly chart sets the direction, the daily chart finds the pullback, an order gets you in.
- My test: on SPY since 1994, green days were not followed by higher returns than red days. Elder himself says the system is a filter, not “buy green, sell red”.
Who is Alexander Elder?
Alexander Elder, M.D., is a professional trader, trading educator and author, trained as a psychiatrist, best known for his book Trading for a Living and for indicators such as the Impulse System, the Force Index and Elder-ray.
According to his publisher Wiley, Elder was born in Leningrad and grew up in Estonia. In a 2011 interview with MQL5, the introduction says he entered medical school in Tartu at 16 and was 23 when he left the Soviet Union. Elder himself says he came to the United States “after jumping a Soviet ship in Africa”, where he worked as the ship’s doctor, and that the Tolstoy Foundation took him in.
In New York he worked as a psychiatrist and served on the faculty of Columbia University. That background shapes everything he writes. He treats fear, greed and self-sabotage as the main reasons traders lose. In Trading for a Living he compares losing traders to people with an addiction who must first admit the problem.
His first trade was a stock bought on fundamentals. In the same interview he describes reading Louis Engel’s How to Buy Stocks, buying about 100 shares of KinderCare at roughly $13 and later selling because of a head-and-shoulders pattern. From there he moved to technical analysis, US stocks and futures.
Elder’s career as a teacher of traders
Elder built his company around teaching, not around managing money for others. The timeline on elder.com lists the seminars, courses and Traders’ Camps:
| Year | Milestone |
|---|---|
| 1988 | First seminar, with John J. Murphy as presenter |
| 1989 | Trading courses on VHS tapes |
| 1993 | Trading for a Living is published |
| 1994 | The company goes online at elder.com |
| 1996 | First Traders’ Camp, in the Caribbean |
| 2004 | The Spike group of traders is founded at a Traders’ Camp |
| 2007 | Webinars for traders |
The first seminar connects Elder with another classic author. John J. Murphy wrote Technical Analysis of the Financial Markets, which I reviewed in Murphy’s book review. Elder’s Traders’ Camps are week-long classes, and SpikeTrade is a group of traders who, in Elder’s words, hold a weekly contest for the best trade.
There is one gap you should know about. I found no published, independently audited long-term track record of Elder’s own trading. In the MQL5 interview he shows his methods and his approach in detail, but not account statements. That is normal for a teacher, but it means you judge his methods, not his returns.
The core idea: mind, method and money
Elder sums up trading in three Ms: mind, method and money. Mind is your psychology and discipline. Method is how you analyze the market and find trades. Money is risk control, how much you put on each trade.
His point is that most traders work only on the method. They search for the perfect indicator while their real problem is risk or discipline. A good method with poor money management still ends in ruin, because a few large losses wipe out many small gains.
The fourth habit he adds is keeping records. Elder asks traders to keep a trading journal with a chart of every entry and exit and to grade each trade. If you want to start one, our guide to the trading journal shows what to record.
The Elder Impulse System explained
The Elder Impulse System colors each price bar by asking two questions: is the trend rising, and is the momentum rising? Elder first described it in Come Into My Trading Room (2002), according to StockCharts. It uses only two inputs:
- Trend: the slope of the 13-day exponential moving average (EMA). Compared with the prior day, is it higher or lower?
- Momentum: the slope of the MACD-Histogram with the standard settings 12, 26, 9. Is the bar higher or lower than the bar before?
Note that it is the histogram, not the MACD line. Many summaries say “the MACD rises”, but the system uses the MACD-Histogram, the gap between the MACD line and its signal line. Our MACD indicator guide explains the parts. The colors then follow simple rules:
| Color | Condition | What it allows |
|---|---|---|
| Green | 13-day EMA rising and MACD-Histogram rising | Buy or stand aside, no new shorts |
| Red | 13-day EMA falling and MACD-Histogram falling | Short or stand aside, no new buys |
| Blue | The two disagree | No ban in either direction |
The heart of the system is the ban, not the signal. Elder calls it a censorship system in his e-book Step by Step Trading (2015): green prohibits shorting, red prohibits buying, and when the Impulse is blue, nothing is prohibited. He checks the colors on two time frames, usually daily and weekly, and if even one of them says no, he stands aside.
Elder warns against reading the colors as buy and sell signals. In the same e-book he writes that the system does not mean “buy green, sell red”. By the time a bar turns green, the uptrend is well under way. His idea is to spot a candidate while it is still red and to buy when the red disappears and the bar turns blue. The best signals, in his words, come from the disappearance of color.
Exits depend on your setup, not on the color alone. StockCharts quotes Elder’s advice to enter cautiously and exit fast, but that is a general attitude, not a fixed rule. How you leave a trade follows from your stop, your target and the setup you trade, as in the checklist further down.
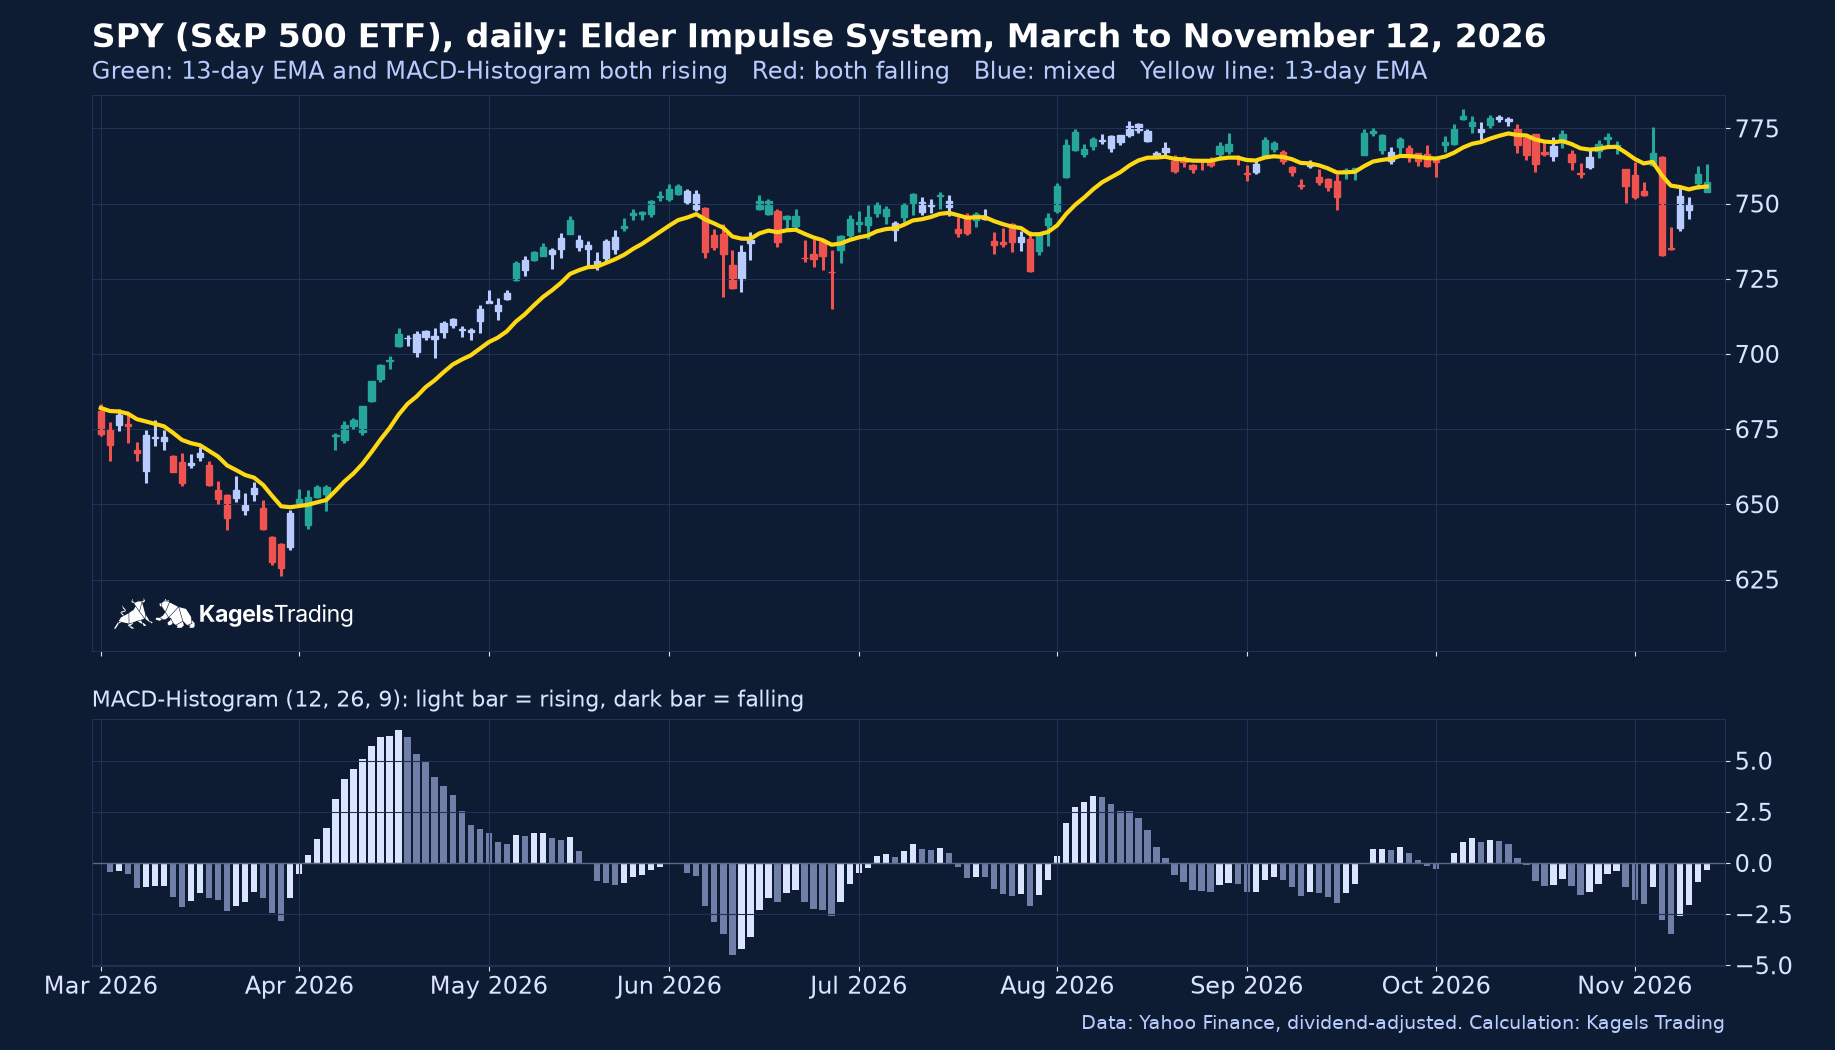 Click to enlarge
The chart shows the typical pattern on SPY in 2026. Red bars gathered into the March low, green bars carried the April rally, and the long sideways phase from August to October produced a mix of all three colors. At the March low the bars were still red, so the system forbade buying at the bottom. The first blue bar after the low lifted the ban, which is exactly the moment Elder looks for.
My test: what happens after green, red and blue days?
I tested the colors on SPY from January 3, 1994 to November 12, 2026, to see whether the color of a day says anything about the next days. The rules were fixed before the run: daily colors as above, prices adjusted for dividends, the return from the close of the color day to the close 5 and 20 trading days later. The weekly color comes from the last completed week, so the test does not look into the future. Each cell shows the average return first and then the share of cases in which SPY was higher. The share of days counts all 8,272 classified days; the 5-day figures use 8,267 days up to November 5, 2026, and the 20-day figures 8,252 days up to October 15, 2026, because later days have no complete window yet.
| Day color | Share of days | Next 5 days | Next 20 days |
|---|---|---|---|
| All days | 100% | 0.23%, 58.6% | 0.92%, 65.2% |
| Green | 38.4% | 0.08%, 57.0% | 0.76%, 65.0% |
| Red | 25.0% | 0.50%, 60.6% | 1.15%, 64.6% |
| Blue | 36.6% | 0.21%, 59.0% | 0.93%, 65.8% |
| Green day, green week | 16.7% | 0.10%, 57.3% | 0.65%, 64.8% |
| Red day, red week | 7.1% | 0.52%, 58.1% | 1.66%, 65.7% |
In this SPY sample, green days were not followed by higher average returns than red days, over 5 or over 20 days. After red days, SPY rose on average more than after green days. Stock indices often bounce after short sell-offs, and red bars gather in those sell-offs. A trader who shorted every red day would have fought both the long-term uptrend and the bounce.
This fits Elder’s own warning rather than contradicting it. He never sold the colors as signals on their own, and on SPY green days had lower average returns afterwards than red days. This comparison does not test a “buy green, sell red” strategy. What the table cannot show is whether the colors carry some information, or whether the Impulse filter improves a complete strategy. It is a descriptive comparison, not a test of predictive power.
Keep the other limits in mind as well. It covers one market with a strong upward drift, the 5- and 20-day windows overlap so the days are not independent, and there are no costs. Data: Yahoo Finance, checked against Alpaca for the last eight closes.
The Triple Screen trading system
The Triple Screen is Elder’s method for reading one market on two time frames, described in Trading for a Living. It solves a basic conflict: trend-following indicators work in trends, oscillators work in ranges, and both give opposite signals at the same time. Elder’s answer is to use each one where it belongs:
- First screen, the market tide: on the weekly chart, a trend tool such as the slope of the MACD-Histogram or an EMA decides the direction. Only trades in that direction are allowed.
- Second screen, the market wave: on the daily chart, an oscillator looks for a pullback against the weekly trend, for example a dip of the 2-day EMA of the Force Index below zero in a weekly uptrend.
- Third screen, the entry: a buy stop just above the prior day’s high (in an uptrend) gets you in only if the market turns back up. Elder moves the order down each day the pullback continues and cancels it if the weekly trend turns.
In Step by Step Trading, Elder turns this into a concrete checklist for a long trade. The weekly slow EMA is rising and the weekly Impulse is green or blue. On the daily chart, price is in the value zone between the 13- and 26-day EMAs or below it, the daily Impulse has turned blue, and the 2-day Force Index is below zero. He then buys in the value zone, places a stop near the low of the second lowest recent bar or 1.5 ATR below the entry, whichever is lower, and wants a reward of at least twice the risk.
The time frames follow a factor of five. Elder’s rule is to choose the time frame you trade and then use one that is about five times longer for the trend, so weekly for daily or daily for hourly. Our guide to multi-timeframe analysis shows how to set this up.
The Impulse System fits into the Triple Screen as a filter on both screens. A red weekly bar forbids longs for the whole week, and the daily color decides the day. That is why my test above also looks at the weekly color.
Elder’s other indicators: Force Index and Elder-ray
The Force Index combines price change and volume in one number. According to StockCharts, Elder introduced it in Trading for a Living: the change of the close from the prior day, multiplied by the volume. A 2-day EMA of it finds short pullbacks, a 13-day EMA shows the medium trend of buying and selling pressure. Our guide to volume analysis covers volume in more depth.
Elder-ray splits the market into bull power and bear power. Bull Power is the day’s high minus the 13-day EMA, Bear Power is the day’s low minus the same EMA. In an uptrend, Elder looks for buys when Bear Power is negative but rising, which means the bears are losing strength.
All three tools share the same building blocks. The 13-day EMA, the MACD-Histogram and a short oscillator appear again and again. That is a strength: you learn a few tools well instead of many tools badly.
Elder’s risk rules: 2% and 6%
Elder’s money management rests on two limits, the 2% rule and the 6% rule, which he repeats in his books up to Step by Step Trading. The 2% rule caps the planned loss of a single trade at 2% of your account. The 6% rule says you stop trading for the rest of the month once your losses reach 6% of your account equity at the beginning of that month.
The 2% rule protects you from one bad trade, the 6% rule from a bad streak. Elder compares them to protection against a shark bite and against many piranha bites. Losing streaks are normal, and the 6% rule forces a pause before a streak turns into a drawdown you cannot recover from. Our guide to position sizing shows how to turn the 2% limit into a share or contract count.
I see Elder’s numbers as the upper limit, not the target, and so does Elder. He writes that you may lower both limits but never raise them, and that risking 1% or less per trade gives you more room to practise. That costs little when your win rate is still uncertain. Our guide to the trading edge shows how often losing streaks occur.
Alexander Elder’s books
Elder has written trading books for more than 30 years, nearly all published by Wiley. The main titles in order, with their year and topic:
| Year | Book | What it covers |
|---|---|---|
| 1993 | Trading for a Living | Psychology, technical analysis, Triple Screen, Force Index, risk |
| 1998 | Rubles to Dollars | The Russian economy after the Soviet Union, for investors |
| 2002 | Come Into My Trading Room | The three Ms, the Impulse System, the 2% and 6% rules |
| 2006 | Entries & Exits | Real trades of other traders, with charts and Elder’s comments |
| 2008 | Sell and Sell Short | Taking profits, stops and short selling (new edition 2011) |
| 2014 | The New Trading for a Living | Updated version of the first book, with the newer tools |
| 2015 | Step by Step Trading | Short e-book from elder.com: risk rules, Impulse System, a complete checklist |
For a first book, take The New Trading for a Living. It covers psychology, analysis, systems, risk and record keeping in one volume and replaces the 1993 original. I recommend it as the first book in our guide to the best trading books. Most titles also have a study guide with questions and answers.
Sell and Sell Short fills a gap that most trading books leave open. Books explain how to buy, but rarely when to take profits or how to go short. If you want the basics first, our guide to short selling explains the mechanics.
Criticism and limits
The biggest point is the missing public track record. Elder’s authority comes from his books and his teaching, not from audited results. That does not make his methods wrong, but you should test them yourself before you trust them.
The tools are simple, and that cuts both ways. EMA, MACD and Force Index are lagging indicators. My SPY test shows that green days were not followed by better returns than red days, so the colors need a setup and a market with real trends.
Some advice has aged. Parts of the first edition dealt with markets and software of the early 1990s. The 2014 edition updates most of it, which is one more reason to read the new edition.
My verdict on Alexander Elder
Elder is one of the best teachers of trading psychology and risk control, and an honest source of simple tools. His books do not promise easy money. They show how much discipline and record keeping trading needs.
The Impulse System is a filter, not a crystal ball. Use it the way Elder meant it: as a ban on trades against the current impulse, on top of a setup with a clear stop. In my SPY test, green days had lower average returns afterwards than red days, although that comparison does not test a “buy green, sell red” strategy.
If you read only one of his books, read The New Trading for a Living. If you then want a trading plan, the Triple Screen checklist, the 2% rule and a journal give you a solid structure to test on your own markets.
Frequently asked questions about Alexander Elder
Who is Alexander Elder?
Alexander Elder is a trader, trading educator and author, trained as a psychiatrist. He was born in Leningrad, grew up in Estonia, worked as a psychiatrist in New York and wrote Trading for a Living (1993).
How does the Elder Impulse System work?
It colors each bar by the slope of the 13-day EMA and the MACD-Histogram. Both rising gives green, both falling gives red, a mix gives blue. Red forbids new buys, green forbids new shorts, blue forbids nothing.
Which settings does the Impulse System use?
A 13-period EMA and the MACD-Histogram with 12, 26 and 9. For the higher time frame, Elder uses a chart about five times longer, so the weekly chart for daily trading.
What is the Triple Screen trading system?
It is Elder’s method for trading on two time frames. The weekly chart gives the direction, an oscillator on the daily chart finds the pullback, and a buy stop or sell stop gets you into the trade.
What is the 2% rule by Alexander Elder?
Never risk more than 2% of your account on one trade. It works together with the 6% rule: once your losses in a month reach 6% of the account equity at the start of the month, you stop trading until the month ends.
Which Alexander Elder book should I read first?
The New Trading for a Living from 2014. It is the updated version of his first book and covers psychology, analysis and risk in one place.
More Famous Traders guides
- See who really performed best
Best Traders in the World, Ranked by Documented Returns
A ranking built only from documented annual returns, from Jim Simons to Warren Buffett, and why the famous 120% figures are missing.
- Meet the quant pioneer
Jim Simons: Medallion Fund Returns, Strategy and Access
Jim Simons and the Medallion Fund: 66% a year before fees from 1988 to 2018, how it traded, why you cannot invest and what traders can use.
- Understand trading championships
World Cup Trading Championship: Winners, Rules, Criticism
How the real-money World Cup Trading Championship works, what it costs to enter, record winners, German champions and its flaws.
- Meet the record holder
Larry Williams: The 11,376% Record Holder, Fact-Checked
Larry Williams and his 11,376% year: his COT approach, the Oops pattern, the volatility breakout and the criticism.
- Meet the Prince of the Pit
Richard Dennis: The Prince of the Pit and the Turtle Traders
Richard Dennis from $400 to a fortune, the Turtle experiment, his losses in 1987 and 1988 and what is really documented.
- Learn the Turtle rules
Turtle Trading: The Original Rules of Richard Dennis
The key original Turtle trading rules: entries, position size with N, the 2N stop, adding units and the exits.
- Understand the stock contest
US Investing Championship: Rules, Winners and Records
The real-money US Investing Championship: divisions, verification, recent winners and records, with dates.
- Read the classic interviews
Market Wizards: Jack Schwager's Books and Their Lessons
Jack Schwager's Market Wizards books: which traders each one features and the lessons they share.
- Meet the oldest legend
Jesse Livermore: Rules, Books and Lessons of a Legend
Jesse Livermore from his own 1940 book and the 1923 novel about him: rules, bankruptcies and lessons.
- Meet the first Market Wizard
Michael Marcus: How the First Market Wizard Traded
Michael Marcus: from early wipeouts to $80 million on a company account, and the rules he took from it.
- Meet the trend-following pioneer
Ed Seykota: Trend Following Pioneer From Market Wizards
Ed Seykota: early computerized trend following, his risk rules and what Market Wizards documents.
- Learn short-term setups
Linda Raschke: Trading Rules, Setups and Books
Linda Raschke: Holy Grail, Turtle Soup and the 3-10 oscillator, and where her famous 50 rules come from.
- Trade the opening range
Toby Crabel: Opening Range Breakout and His Numbers
Toby Crabel: opening range breakout, short-term price patterns and what is known about his record.
- Understand Buffett's investing approach
Warren Buffett: Portfolio and Investing Strategy
Berkshire's disclosed holdings, Buffett's investment principles and the limits of following a reported portfolio.
- Meet the 1987 crash trader
Paul Tudor Jones: Strategy Behind the 1987 Crash Trade
Paul Tudor Jones: the short before Black Monday, global macro, the 200-day rule, 5 to 1 and what the legend leaves out.
- Learn the SEPA method
Mark Minervini: SEPA, Trend Template and VCP Explained
Mark Minervini: SEPA, the eight Trend Template criteria, the VCP pattern, his risk rules and two contest wins.
- Understand All Weather
Ray Dalio: All Weather, Bridgewater and Lessons for Traders
Ray Dalio: what the All Weather portfolio really is, Bridgewater, his debt warnings and what traders can use.