
Best Oil Stocks 2026: Majors, Pipelines and Refiners


Contents
- Oil stocks in 30 seconds
- What are oil stocks?
- The 10 largest oil stocks by market value
- Upstream: the producers
- Midstream: the pipeline operators
- Downstream: the largest refiners
- Oilfield service companies
- European oil stocks
- Oil stocks and the price of crude
- Other factors that move oil stocks
- Which strategies suit oil stocks?
- High-yield oil stocks: check the legal form first
- Alternatives to single oil stocks: ETFs and futures
- What is the outlook for oil stocks?
- Conclusion: oil stocks are a cycle business, not a sure thing
- Frequently asked questions about oil stocks
- Sources
- About the author
Oil stocks move in cycles that politics sets, not quarterly reports. On 7 April 2026, Brent crude cost $138.21 a barrel on the spot market. Six weeks earlier it had been about $71. The war with Iran had made the Strait of Hormuz almost impassable for tankers, and the shares of the oil majors rose with the price. By 2 July Brent was back at $68.53, and by late October it was above $120 again.
Price jumps like these tempt investors to buy too late. From the end of 2024 to 28 October 2026, ExxonMobil gained 69 percent, Shell 68 percent and TotalEnergies 70 percent, without dividends. The sector also hides a second problem: some of the names with the highest payouts are partnerships, not companies, and their tax rules can cost you more than the extra yield.
This guide shows you which oil stocks exist, how they differ by business model and which figures matter when you choose. Market values, yields and P/E ratios are from 29 October 2026, oil prices from the EIA daily series up to 27 October. The third-quarter reports of the majors start on 30 October 2026, so check the latest numbers before you buy.
Oil stocks in 30 seconds
- Three business models react differently to the oil price. Upstream (production) earns more when prices rise, midstream (pipelines) collects fees almost regardless of the price, downstream (refining) often benefits from cheap crude.
- ExxonMobil leads with $755 billion in market value, followed by Chevron ($453 billion) and Shell ($308 billion). Saudi Aramco is far larger at about $1.67 trillion, but it is listed only in Riyadh.
- Exxon’s listed company changed on 1 July 2026. After the move from New Jersey to Texas, ExxonMobil Holdings Corporation is the listed parent. The ticker is still XOM, the CUSIP changed.
- The highest yields come from partnerships. Master limited partnerships (MLPs) such as MPLX and Western Midstream pay about 8 percent, but they send a Schedule K-1, and foreign investors can face up to 37 percent withholding on their share of business income.
- A broad ETF removes the stock picking. XLE costs 0.08 percent a year for 21 US energy stocks, IXC 0.37 percent for 50 global ones.
What are oil stocks?
Oil stocks are shares of companies that find, produce, transport or refine crude oil and natural gas. The industry splits into upstream, midstream and downstream, plus the oilfield service companies that work for all of them.
Upstream means exploration and production. These companies sell their oil at the market price, so their margin rises almost one for one with the price. Midstream companies own pipelines, storage tanks and export terminals and charge a fee per barrel. Whether a barrel costs $60 or $120 matters little for that fee.
Downstream companies refine crude oil and sell fuel. They buy oil and live on the crack spread, the gap between the crude price and the price of gasoline, diesel and jet fuel. Cheap crude tends to help them, which is why refiners often move against the rest of the sector.
Service companies drill wells, measure seismic data and maintain equipment. Their business follows the investment budgets of the producers, not the oil price itself. Producers adjust those budgets only a few quarters after a price move, so SLB, Halliburton and Baker Hughes often react late.
Most large names are integrated and cover all three stages. At ExxonMobil, Chevron, Shell and TotalEnergies the opposite effects partly cancel out. That makes them calmer than pure producers, but it also limits the leverage on a rising oil price.
The 10 largest oil stocks by market value
Market value is not a measure of quality, but it is a measure of staying power. Large companies can survive a price collapse without selling new shares, small producers cannot always. The table lists the ten largest Western-listed oil and gas companies with their dividend yield.
| Company (ticker) | Business model | Market value | Dividend yield |
|---|---|---|---|
| ExxonMobil Holdings (XOM) | integrated | $755 bn | 2.24% |
| Chevron (CVX) | integrated | $453 bn | 3.08% |
| Shell (SHEL) | integrated | $308 bn | 2.80% |
| TotalEnergies (TTE) | integrated | $211 bn | 4.20% |
| ConocoPhillips (COP) | upstream | $180 bn | 2.24% |
| Petrobras (PBR) | integrated, state controlled | $135 bn | 5.37% |
| BP (BP) | integrated | $130 bn | 4.07% |
| Marathon Petroleum (MPC) | downstream | $122 bn | 0.92% |
| Equinor (EQNR) | integrated, state controlled | $114 bn | 3.27% |
| Canadian Natural Resources (CNQ) | upstream | $114 bn | 3.22% |
Market value and dividend yield as quoted by stockanalysis.com, 29 October 2026, during the US session. Shell, Petrobras, BP and Equinor trade in New York as American depositary shares. TotalEnergies ended its ADR programme and has listed its ordinary shares on the NYSE since 8 December 2025. Marathon Petroleum raised its quarterly dividend by 10 percent to $1.10 on 28 October 2026, and ExxonMobil raised it from $1.03 to $1.07 on 30 October 2026; the yields do not include these increases yet. In their third-quarter reports of the same day, Chevron kept its dividend at $1.78 and BP declared 8.66 cents per share ($0.5196 per American depositary share).
Two names left the top ten since August. Enbridge fell to about twelfth place with $109 billion, behind the refiner Phillips 66. Marathon Petroleum moved up to eighth place. In a sector this volatile, a ranking from two months ago is already out of date.
ExxonMobil changed its legal home on 1 July 2026. The company moved from New Jersey to Texas. Since then ExxonMobil Holdings Corporation is the listed parent, every old share was exchanged one for one, and the ticker stayed XOM. The CUSIP changed to 30233Q108, according to Exxon’s SEC filing of the same day.
Hess no longer exists as a listed company. Chevron completed the takeover on 18 July 2025. Every Hess share became 1.025 Chevron shares, and Chevron’s quarterly report puts the purchase price at about $48 billion. Shell bought the Canadian gas producer ARC Resources on 2 September 2026.
The world’s largest oil company is missing from the table. Saudi Aramco is worth about $1.67 trillion, more than twice as much as ExxonMobil. It trades only on the Saudi Exchange (Tadawul, ticker 2222), which most foreign retail brokers do not offer.
Chart check: the four largest US-listed oil stocks
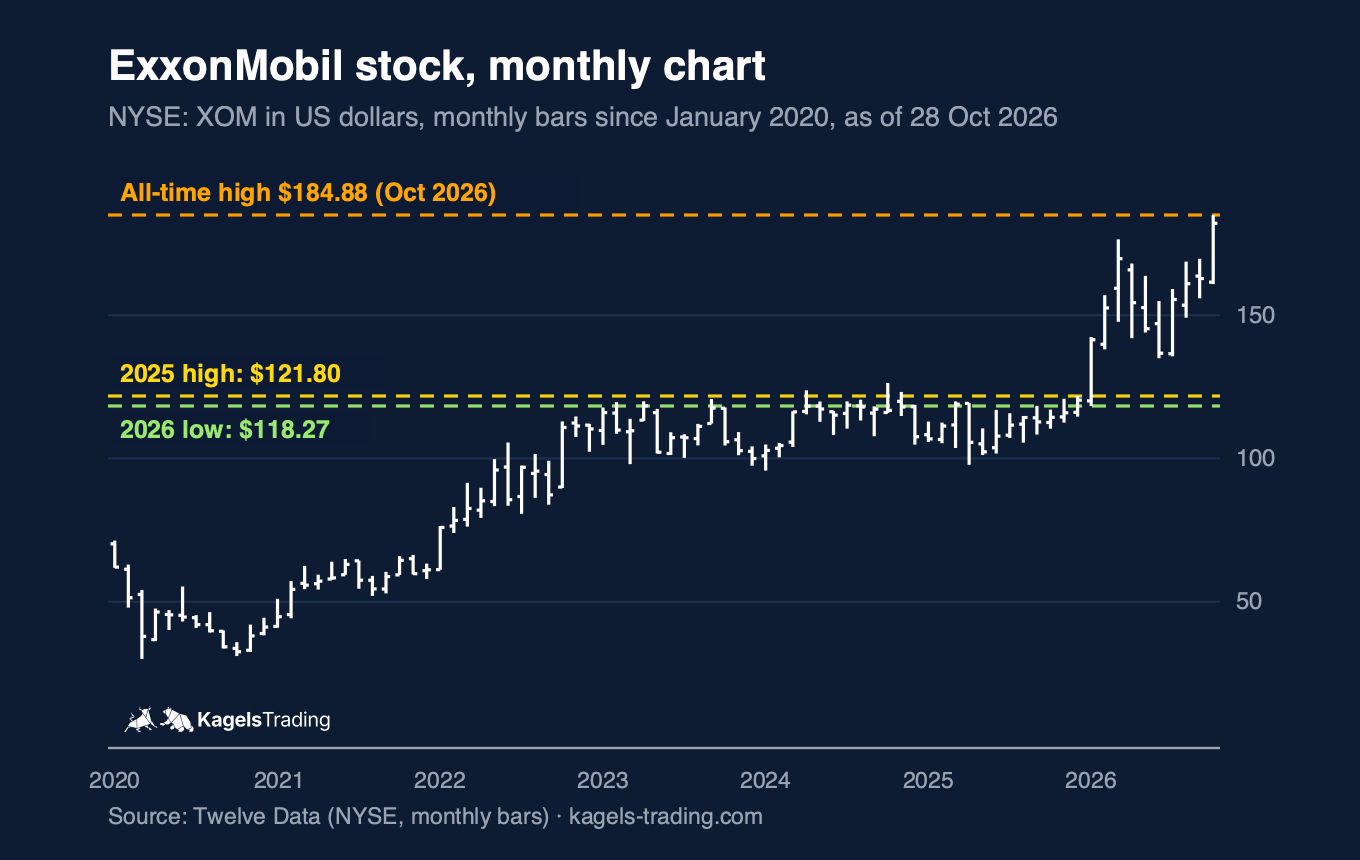
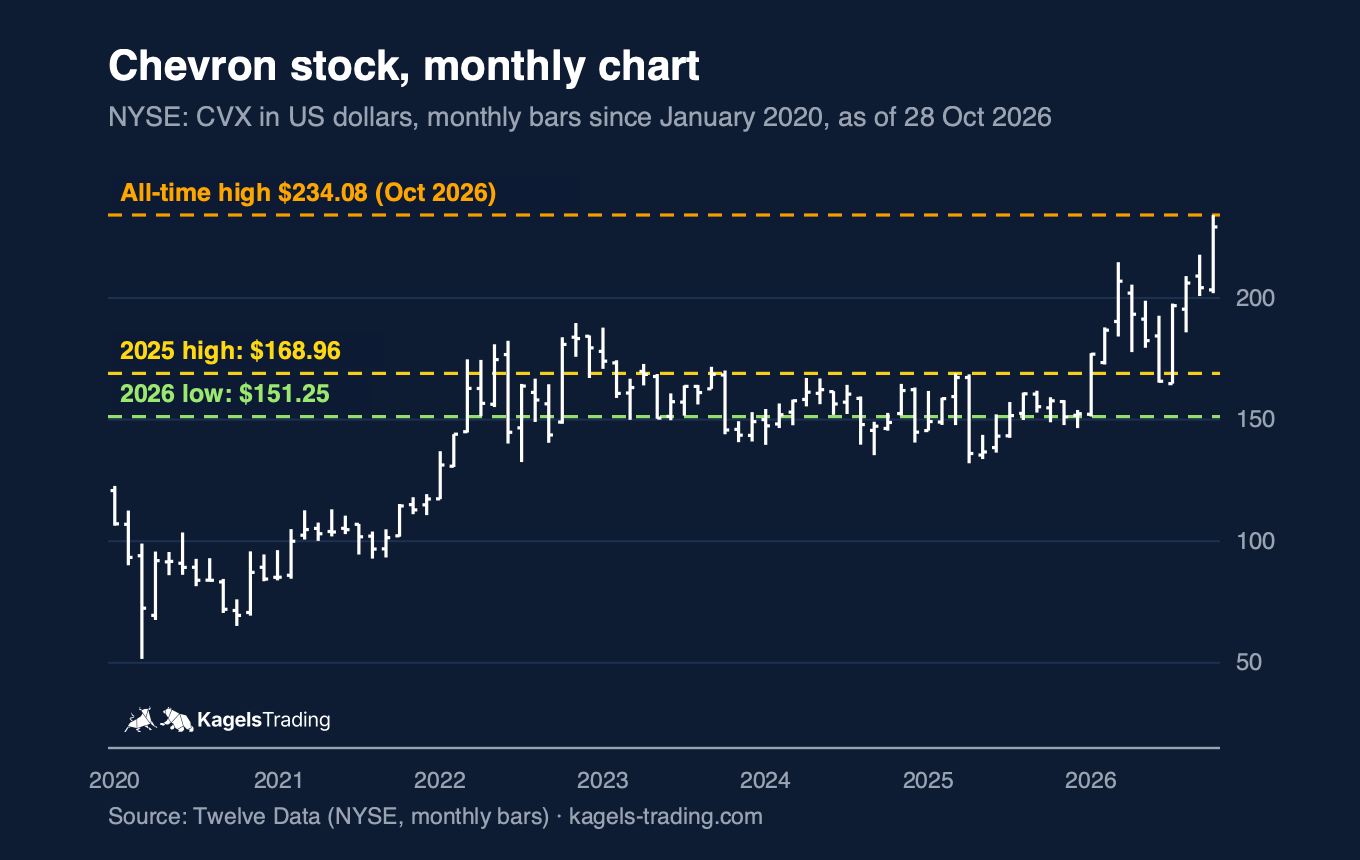
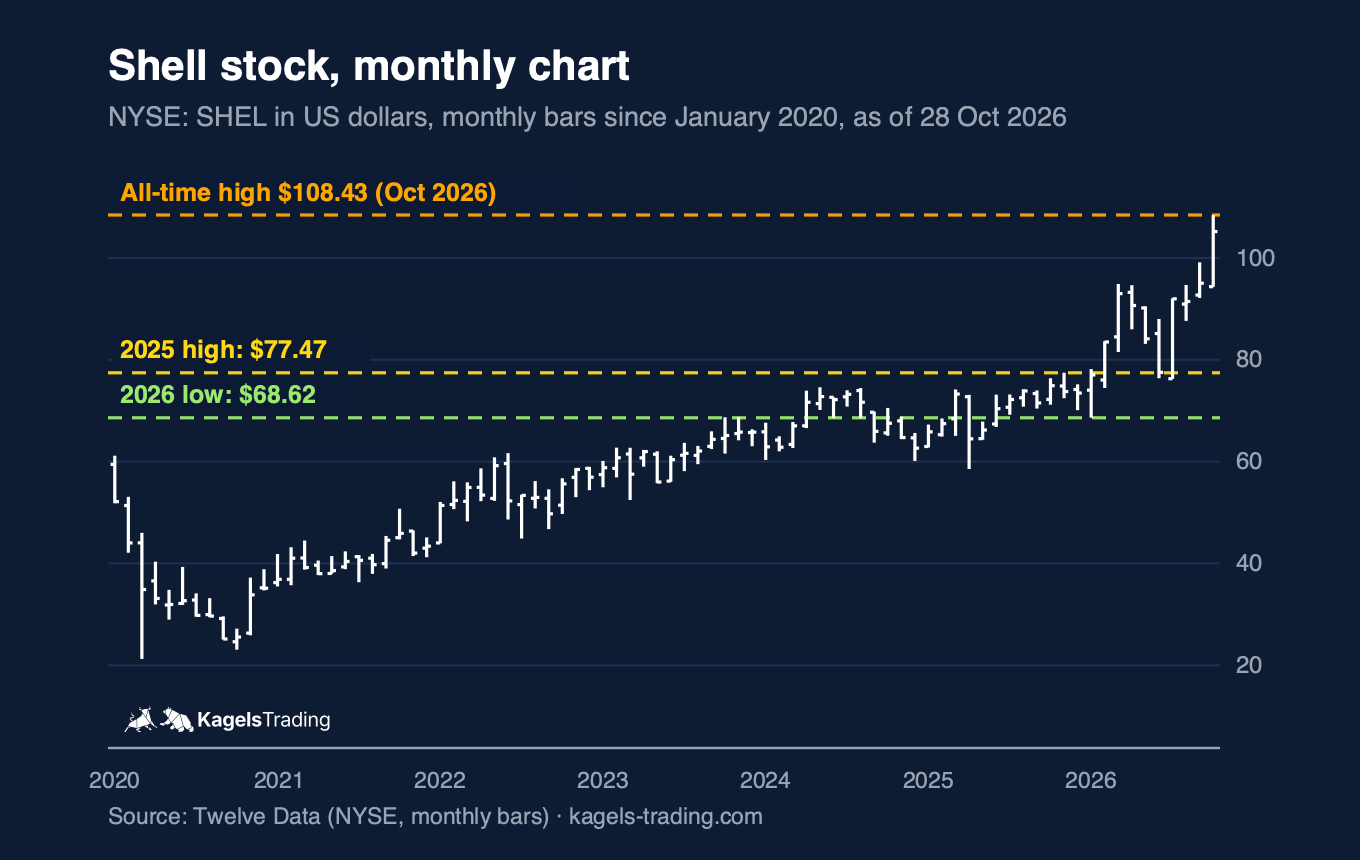
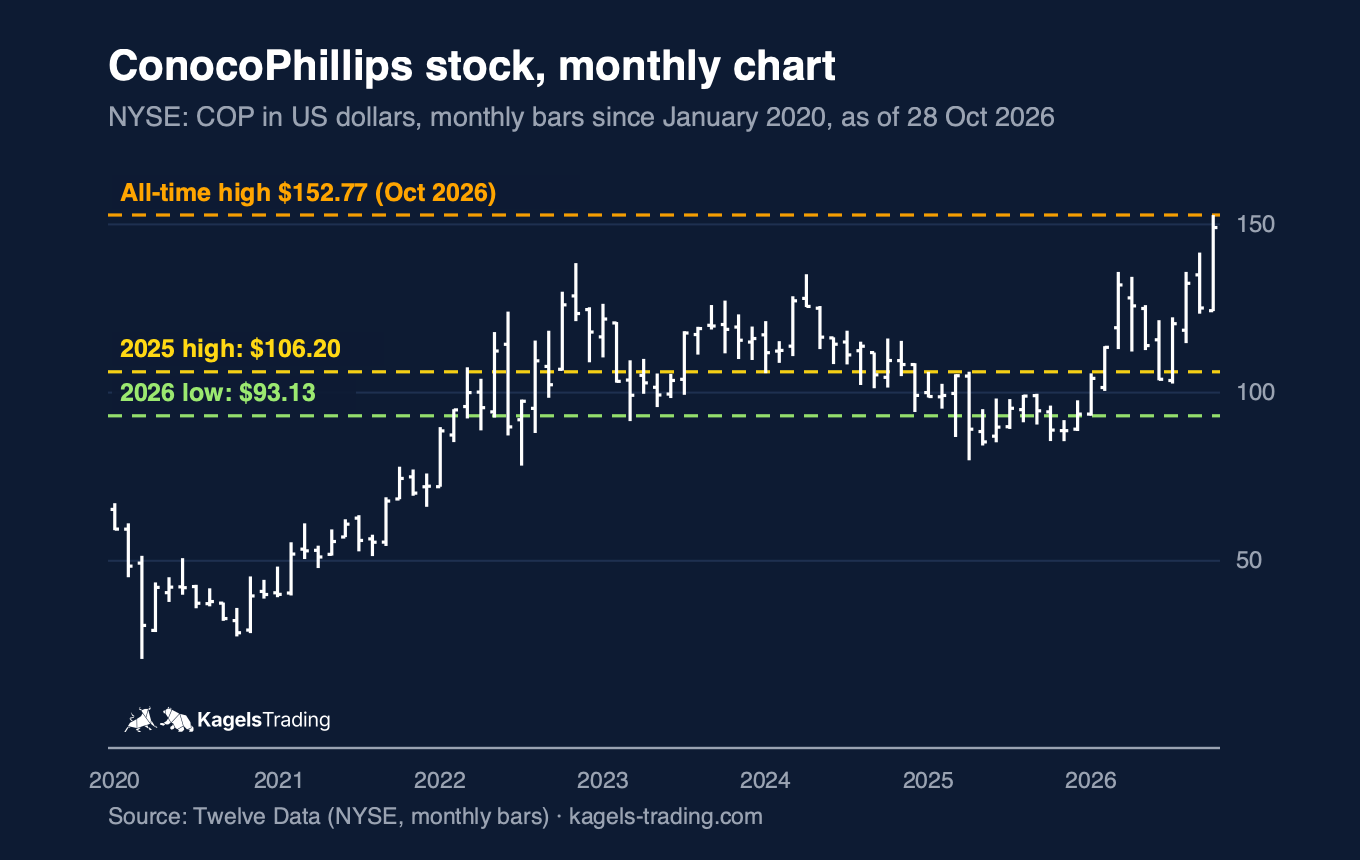
All four stocks reached new record highs in October 2026. The charts below mark the all-time high, the 2025 high and the 2026 low. In all four cases, the 2025 high is the first level a pullback would test, because the stocks broke above it during the price shock of spring 2026.
 Click to enlarge
Source: Twelve Data.
ExxonMobil traded below $122 for most of 2025. The breakout came in March 2026 together with the oil price. On 27 October 2026 the stock set a new record high of $184.88 and closed at $182.02 a day later. The zone around the 2025 high at $121.80 and the 2026 low at $118.27 is now more than 30 percent below the price.
 Click to enlarge
Source: Twelve Data.
Chevron followed the same pattern a little more slowly. The 2025 high was $168.96, the 2026 low $151.25 in January. After the Hess takeover the company produces more oil, and on 26 October 2026 it reached a record of $234.08.
 Click to enlarge
Source: Twelve Data.
Shell’s shares in New York rose from below $78 to over $108. The 2025 high of $77.47 marks the old range. Shell has bought back shares for years and added ARC Resources in September 2026, which gives it more North American gas.
 Click to enlarge
Source: Twelve Data.
ConocoPhillips shows the most leverage of the four, because it only produces. From the 2026 low of $93.13 the stock climbed to a record of $152.77 on 23 October 2026. In a falling oil market, the same leverage works against a pure producer, as the drop from April to July 2026 showed.
Upstream: the producers
Upstream stocks are the leveraged bet on the oil price. Their production costs per barrel are largely fixed, so most of every extra dollar reaches the profit line. The same leverage works on the way down, which is why these stocks often lose double digits when crude falls. You can follow the price itself in our crude oil price forecast.
| Company (ticker) | Main region | Market value |
|---|---|---|
| ConocoPhillips (COP) | USA, Alaska, Norway, others | $180 bn |
| Canadian Natural Resources (CNQ) | Canada (oil sands) | $114 bn |
| EOG Resources (EOG) | USA, Trinidad | $85 bn |
| Devon Energy (DVN) | USA, after the Coterra merger | $59 bn |
| Diamondback Energy (FANG) | USA (Permian Basin) | $58 bn |
The five largest pure producers. Market value per stockanalysis.com, 29 October 2026.
ConocoPhillips is by far the largest pure producer. Many lists count it as an integrated company, but it spun off its refining business as Phillips 66 in 2012. Devon Energy completed its all-stock merger with Coterra Energy on 7 May 2026 and now ranks just ahead of Diamondback, which concentrates on the Permian Basin in West Texas and New Mexico.
Midstream: the pipeline operators
Midstream is the toll road of the oil industry. These companies own pipelines, storage and loading terminals and charge per barrel, usually under contracts that run for years. That is why their payout ratios are much higher than those of producers.
| Company (ticker) | Legal form | Market value | Yield |
|---|---|---|---|
| Enbridge (ENB) | Canadian corporation | $109 bn | 5.66% |
| Williams Companies (WMB) | US corporation | $92 bn | 2.79% |
| Enterprise Products Partners (EPD) | partnership (K-1) | $84 bn | 5.78% |
| Kinder Morgan (KMI) | US corporation | $76 bn | 3.50% |
| Energy Transfer (ET) | partnership (K-1) | $72 bn | 6.48% |
The five largest midstream companies. Market value and yield per stockanalysis.com, 29 October 2026.
Two of the five are partnerships, not corporations. Enterprise Products and Energy Transfer are limited partnerships. What that means for your taxes is explained in its own section below. Enbridge, Williams and Kinder Morgan are ordinary corporations.
Downstream: the largest refiners
Refiners earn the processing margin, not the oil price. They buy crude and sell gasoline, diesel and jet fuel. When crude rises faster than fuel prices, the margin shrinks. When crude falls, it widens. That is why refining stocks often run against the rest of the sector.
| Company (ticker) | Market value | P/E ratio |
|---|---|---|
| Marathon Petroleum (MPC) | $122 bn | 15.0 |
| Phillips 66 (PSX) | $110 bn | not stated |
| Valero Energy (VLO) | $108 bn | not stated |
The three largest US refiners. Market value and trailing P/E per stockanalysis.com, 29 October 2026.
Marathon Petroleum runs the largest refining capacity in the United States. Phillips 66 is the former refining arm of ConocoPhillips. Valero is also one of the world’s largest producers of renewable diesel. All three are now worth more than $100 billion, and Marathon raised its dividend on 28 October 2026.
Oilfield service companies
Service companies follow the oil price with a delay. Their order books fill only when producers raise their investment budgets, usually one or two quarters after a price rise. For traders that delay can be useful, for investors it explains the often high valuations.
| Company (ticker) | Market value |
|---|---|
| SLB, formerly Schlumberger (SLB) | $80 bn |
| Baker Hughes (BKR) | $54 bn |
| Tenaris (TS) | $31 bn |
| Halliburton (HAL) | $30 bn |
| TechnipFMC (FTI) | $27 bn |
The five largest oilfield service companies. Market value per stockanalysis.com, 29 October 2026.
SLB is the world’s largest service provider and works in more than 100 countries. The company dropped the name Schlumberger in 2022. Baker Hughes completed its takeover of Chart Industries on 16 July 2026, which adds gas processing and LNG equipment. Tenaris makes the steel pipes that wells need.
European oil stocks
Europe’s oil majors pay higher yields and trade at lower valuations than their US peers. All five are listed at home in euros, pounds or Norwegian kroner. Four of them also trade in New York as American depositary shares, Eni under the ticker E. TotalEnergies is the exception: since December 2025 its ordinary shares trade directly on the NYSE.
| Company | Home country | Yield | P/E ratio |
|---|---|---|---|
| Shell | United Kingdom | 2.80% | 11.9 |
| TotalEnergies | France | 4.20% | 12.1 |
| BP | United Kingdom | 4.07% | 24.3 |
| Equinor | Norway | 3.27% | 9.6 |
| Eni | Italy | 2.84% | not stated |
Trailing yield and P/E of the New York listings per stockanalysis.com, 29 October 2026. Eni’s yield does not include the special dividend for 2026.
Eni ties extra payouts directly to the oil price. For 2026 the Italian company pays an ordinary dividend of €1.10 per share and an extra €0.46, under its policy of handing out all incremental cash flow when Brent is above $90, according to its third-quarter release of 23 October 2026. Equinor is about two thirds owned by the Norwegian state, which makes its payout predictable but also political.
Oil stocks and the price of crude
Crude oil trades under two main benchmarks. WTI comes from the United States and is delivered inland at Cushing, Oklahoma. Brent comes from the North Sea and is loaded onto ships. Brent normally trades a few dollars above WTI, because shipping it around the world costs more.
The Brent WTI spread is the price gap between seaborne Brent and landlocked WTI. It widens when sea routes are disrupted and narrows when US supply gets tight.
2026 is the textbook example of this mechanism. After the war with Iran began at the end of February, Brent spot rose from $71.21 on 24 February to $138.21 on 7 April. WTI rose only to $114.58, because it does not need the Strait of Hormuz. On 8 April the spread reached $25.94, and after renewed disruption it reached $37.62 on 2 October 2026, its highest level of the year so far.
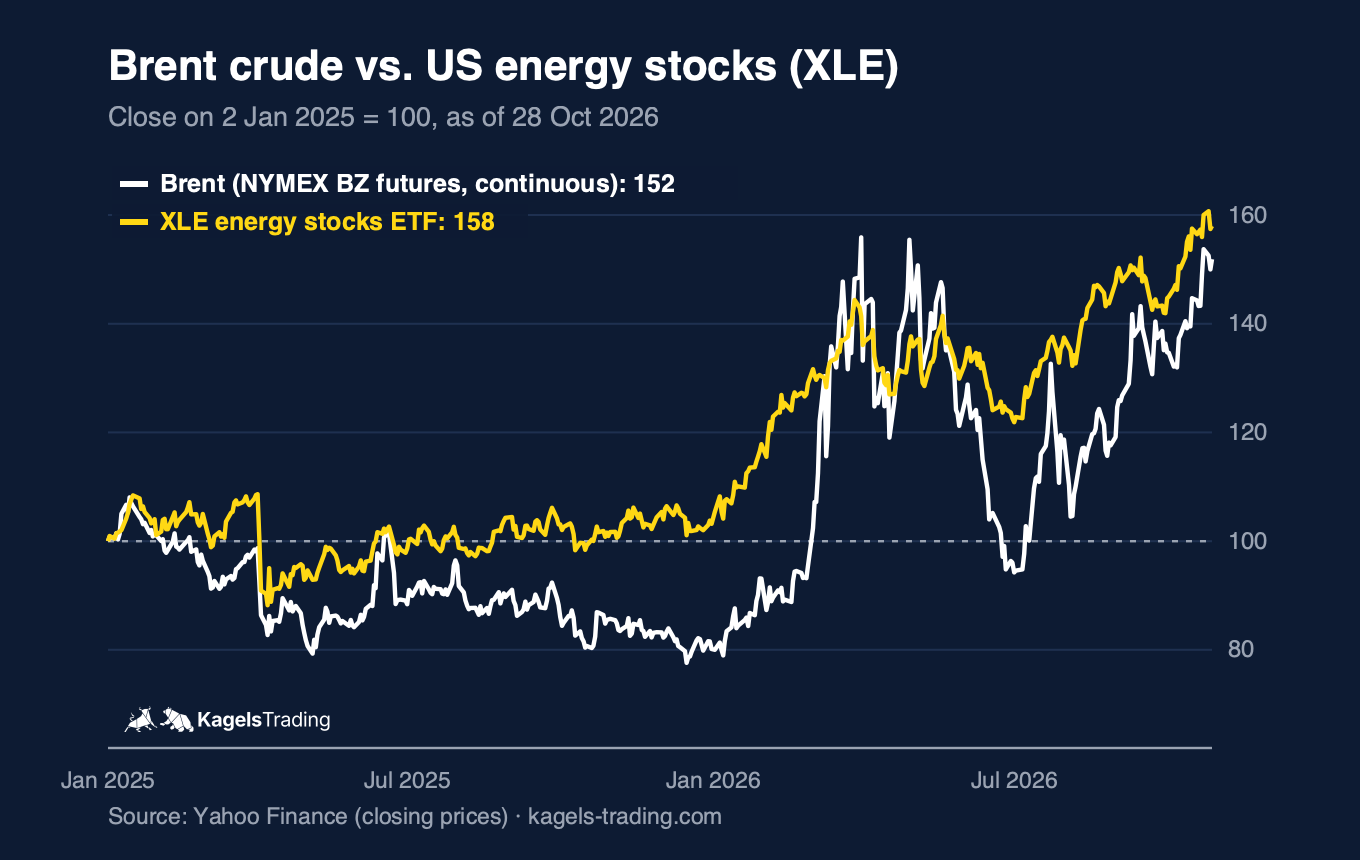
Spot and futures prices drifted apart in this crisis. The EIA figures above are physical spot prices. The front-month Brent future peaked lower, and on 28 October 2026 the December Brent contract closed at about $115, while Brent spot stood at $123.10 on 27 October. Our chart uses the NYMEX Brent Last Day Financial future, which settles against the ICE Brent price, so its peaks look smaller than the spot record.
Annual averages show how cyclical this market is. WTI averaged $76.63 in 2024, $65.39 in 2025 and $86.74 in 2026 up to 27 October. Brent averaged $80.52, $69.14 and $96.04 in the same periods. These swings feed into producer profits with leverage.
 Click to enlarge
Source: Yahoo Finance.
The energy sector rose more steadily than the oil price. From the close on 2 January 2025 to 28 October 2026, the XLE energy ETF gained 58 percent and the Brent future 52 percent, without dividends. Brent fell back below its starting level in July 2026, while XLE stayed above 120. Integrated companies, buybacks and dividends dampen the swings of crude.
Other factors that move oil stocks
OPEC+ steers supply, not the price. The group of OPEC members and partners such as Russia sets production quotas. Announced cuts often move prices more than the actual output, because some members regularly produce above their quotas.
Politics works in both directions. Drilling permits, export bans and windfall taxes change the earnings of whole groups of companies. At state-controlled companies such as Petrobras or Equinor, the government also decides directly about the payout.
The energy transition remains the long-term risk. Several European majors have weakened their climate targets since 2023 and are investing more in oil and gas again. That supports profits in the short run, but nobody knows how the market will value fossil assets in ten years.
Oil stocks offer income other sectors rarely match, and they carry risks other sectors rarely have. The lists below sum up the advantages and risks you take on.
Advantages of oil stocks
- High, regular payouts. The majors yield about 2 to 4 percent. Chevron has raised its dividend for 39 years in a row, through three oil price crashes.
- Moderate valuations. Equinor trades at a P/E of 9.6, Shell at 11.9 and TotalEnergies at 12.1. Many funds with sustainability rules cannot buy the sector, which keeps multiples low.
- A hedge against energy inflation. When oil and gas rise, your fuel costs go up, and so do the profits of the producers in your portfolio.
- Long, tradable trends. Supply shocks take months to work through the supply chain, which creates moves you can follow with a swing trading approach.
Disadvantages of oil stocks
- Politics beats fundamentals. The jump from $71 to $138 in spring 2026 had nothing to do with quarterly results. Such moves cannot be forecast.
- Sharp setbacks. Between April and July 2026 Brent spot fell by half. Pure producers lose more than the oil price in such phases, because their costs stay fixed.
- Currency and tax friction. Most names trade in US dollars. For investors outside the United States, a falling dollar eats into gains, and partnerships add extra withholding.
- The open question of the energy transition. Most capital still goes into fossil projects. Whether the business model keeps today’s valuation in ten years is uncertain.
Which strategies suit oil stocks?
Your strategy decides the selection, not the other way round. A dividend investor needs different stocks than someone betting on an oil price breakout. If you mix both, you often end up with a portfolio that works in no market phase.
Dividend investing in oil stocks
The dividend yield alone is a poor filter. It rises automatically when the share price falls. A yield of 9 percent can be a sign of quality or a warning. What counts is whether the dividend is covered: a company whose payout exceeds its free cash flow for years will eventually cut.
The payout ratio is the share of profit a company pays out as dividends. Values above 100 percent mean the dividend is larger than the accounting profit. That is not automatically a warning, because profit includes noncash charges. Check cash-flow coverage, capital spending and debt before you judge whether the dividend is safe.
| Company (ticker) | Yield | Note |
|---|---|---|
| Enbridge (ENB) | 5.66% | Canadian pipelines, payout ratio 151% of earnings |
| Petrobras (PBR) | 5.37% | state controlled, payout swings strongly |
| ONEOK (OKE) | 4.48% | US midstream corporation |
| TotalEnergies (TTE) | 4.20% | P/E 12.1 |
| BP (BP) | 4.07% | P/E 24.3, payout ratio 99% |
| Kinder Morgan (KMI) | 3.50% | US pipelines, corporation |
| Chevron (CVX) | 3.08% | 39 years of dividend growth |
High-yield oil stocks that are corporations, not partnerships. Yields, P/E and payout ratios on an earnings basis per stockanalysis.com, 29 October 2026. Pipeline companies often cover their dividend from cash flow rather than accounting profit.
Petrobras shows how fast a state-controlled payout can change. In the twelve months to February 2025 the company paid $2.68 per ADR, in the twelve months to August 2026 only $0.95, a drop of 64 percent. Since then the payout has risen again: the dividend for the second quarter of 2026 was almost twice the first. The policy pays out 45 percent of free cash flow, but the government sits at the table.
Chevron is the more predictable choice. The company has raised its dividend for 39 consecutive years, including 2015, 2016 and 2020, when the oil price collapsed. The yield of 3.08 percent is lower, but the reliability counts more when you build a dividend portfolio than a top yield.
Oil stocks for value and momentum traders
The oil sector is structurally cheap. Many institutional investors may not buy it because of sustainability rules, and that keeps valuation multiples low. For a value investor that is the opportunity, for an index investor it explains the small sector weight.
| Company | P/E ratio | Yield |
|---|---|---|
| Petrobras | 5.7 | 5.37% |
| Equinor | 9.6 | 3.27% |
| Shell | 11.9 | 2.80% |
| TotalEnergies | 12.1 | 4.20% |
| Canadian Natural Resources | 13.7 | 3.22% |
| Marathon Petroleum | 15.0 | 0.92% |
Oil stocks with low trailing P/E ratios. Per stockanalysis.com, 29 October 2026.
Equinor is now the cheapest of the large integrated companies. A P/E of 9.6 with a yield of 3.27 percent is unusual among the majors. Part of the discount reflects Norwegian taxes and the state’s control. In August, Shell held that position, which shows how fast these numbers move.
Petrobras with a P/E of 5.7 is not a bargain but a political risk. Such low multiples at state-owned companies almost always reflect the fear that profits will be redirected. The market is pricing the government, not the business.
The sector suits momentum approaches, and it is dangerous for them. Trends run long because supply shocks take months to work through. At the same time a single headline can move a stock 10 percent overnight, as in April 2026. A stop loss that ignores such overnight gaps does not protect you, so size your positions with our position sizing guide.
Service stocks lag the oil price instead of leading it. Because their orders follow the producers’ investment decisions, their moves typically start one or two quarters later. If you missed the first move in the producers, SLB or Halliburton sometimes offer a second entry, better suited to swing trades over several weeks than to day trading.
High-yield oil stocks: check the legal form first
The highest yields in the oil sector usually come from partnerships, not companies. They sit at the top of every dividend screener and pay 6 to 8 percent. What the screener does not show is the legal form, and it decides how you are taxed.
A master limited partnership (MLP) is a publicly traded US partnership. Its unitholders are taxed as partners in a business, not as shareholders.
| Partnership (ticker) | Yield |
|---|---|
| Western Midstream Partners (WES) | 8.15% |
| MPLX (MPLX) | 8.11% |
| Energy Transfer (ET) | 6.48% |
| Plains All American (PAA) | 6.22% |
| Enterprise Products Partners (EPD) | 5.78% |
Large energy MLPs that issue a Schedule K-1. Distribution yield per stockanalysis.com, 29 October 2026.
The structure pays no corporate tax itself. Profits flow straight to the unitholders. Inside the United States that can be an advantage, but it also brings more paperwork, and outside the United States it turns you into a partner in a US trade or business.
What MLPs mean for US investors
- A Schedule K-1 instead of a Form 1099. The K-1 often arrives later than other tax forms and can delay your return.
- Trouble inside an IRA. An MLP held in an IRA can generate unrelated business income. If that gross income reaches $1,000 or more in a year, the IRA must file Form 990-T, according to IRS Publication 598, and the custodian or trustee handles the filing. The cash distribution itself is not the same as this taxable income.
What MLPs mean for investors outside the United States
- Withholding at the top rate. Under section 1446(a), the partnership withholds tax on a foreign partner’s share of its effectively connected income, for individuals at the highest US rate, currently 37 percent. The usual treaty rate for dividends does not apply, because this is business income. Withholding is a prepayment, not the final bill: you may have to file a US tax return, and part of it can come back as a credit or refund.
- Ten percent of the sale proceeds. Since 1 January 2023, brokers withhold 10 percent of the gross amount when a foreign person sells MLP units, under section 1446(f). That is 10 percent of the proceeds, not of the gain, and it can apply even if you sell at a loss. There are exceptions, for example when the partnership publishes a qualifying notice, so check your broker’s statement.
- Many brokers have stopped offering them. Several European banks and brokers restrict or block US partnerships because of the extra reporting.
The word “LP” in the name is not a reliable test. Hess Midstream LP has elected to be taxed as a corporation and sends a Form 1099, while Kinetik Holdings is an ordinary C corporation. Check the legal form and the tax form on the investor relations page before you buy, not the yield.
For almost every MLP there is a corporation with a similar business. Instead of Enterprise Products or Energy Transfer, you can hold Enbridge, Kinder Morgan, ONEOK or Williams. All four run pipelines and all four are corporations, with yields between 2.8 and 5.7 percent and an ordinary Form 1099. Whether they leave you more after tax than an MLP depends on your country and your treaty, so compare both with a tax adviser. The Alerian MLP ETF (AMLP) is another route: it is itself a corporation, pays corporate tax and sends a single Form 1099.
Alternatives to single oil stocks: ETFs and futures
Single stocks are not the only way into the sector. If you do not want to pick, you buy an ETF. If you want to trade the oil price directly, including falling prices, you need futures. Both routes have clear limits.
Investing in oil stocks with ETFs
US investors can choose from cheap and liquid energy ETFs. The table shows the most important ones with costs and number of holdings. XLE is the oldest and largest, but it is heavily concentrated: ExxonMobil and Chevron make up more than 40 percent.
| ETF (ticker) | Focus | Expense ratio | Holdings |
|---|---|---|---|
| Energy Select Sector SPDR (XLE) | US energy stocks in the S&P 500 | 0.08% | 21 |
| Vanguard Energy (VDE) | broad US energy sector | 0.09% | 111 |
| SPDR S&P Oil & Gas E&P (XOP) | US producers, equal weighted | 0.35% | 51 |
| iShares Global Energy (IXC) | global energy majors | 0.37% | 50 |
| VanEck Oil Services (OIH) | oilfield service companies | 0.35% | 26 |
Expense ratios from the issuers (State Street, Vanguard, iShares, VanEck), 28 and 29 October 2026. Holdings from the issuers, VDE as of 30 September 2026. XLE held $45.1 billion on 28 October 2026, with ExxonMobil at 24.2 percent and Chevron at 18.2 percent.
Investors in the European Union usually cannot buy US-domiciled ETFs. These funds publish no key information document, and without it EU brokers may not offer them to retail clients. The solution is UCITS ETFs domiciled in Ireland that track similar indices.
| UCITS ETF | ISIN | Cost (TER) | Holdings |
|---|---|---|---|
| Xtrackers MSCI World Energy 1C | IE00BM67HM91 | 0.25% | 52 |
| State Street SPDR S&P U.S. Energy Select Sector (Acc) | IE00BWBXM492 | 0.15% | 21 |
| VanEck Oil Services A | IE000NXF88S1 | 0.35% | 25 |
Three energy ETFs available to EU retail investors, all accumulating. Costs and holdings per State Street (29 October 2026) and justETF (holdings as of 31 August 2026).
Trading the oil price with futures
A futures contract tracks the oil price almost one for one. The key difference to a stock is direction: you can bet on falling prices as easily as on rising ones. In spring 2026, when Brent spot fell by half from April to July, short futures were the most direct way to profit from the decline.
Two features make futures unsuitable for beginners. They are leveraged: one WTI contract covers 1,000 barrels, about $103,000 at late October prices, and you post only a fraction as margin. They also expire and must be rolled to the next contract. Smaller contracts help with position size, see our guide to micro futures.
In futures, position size decides your fate more than your opinion. First understand the mechanics, then trade small, then grow. In a market that can move 10 percent in a day, you lose money not because of a wrong view but because of a position that was too large. Our risk management guide shows how to limit that.
What is the outlook for oil stocks?
There is no serious price target for a whole sector. What exists is a starting position: the energy sector has left a long period of weakness, and two big forces are pulling it in opposite directions. If you know them, you make better choices than someone waiting for a target.
XLE broke out of a range that held for 18 years. Adjusted for its split, the fund peaked at $50.76 in 2014 and stayed below that level through 2025, with a 2025 high of $47.41. In 2026 it broke out and reached $69.86. Breakouts after such long ranges often carry for years, but they can also fail if the oil price falls back.
Force one pulls up: the geopolitical risk premium. Since the war with Iran began in February 2026, tanker traffic through the Strait of Hormuz has been disrupted, and prices climbed again from September. Brent spot stood at $123.10 on 27 October. This premium is not a foundation: from April to July Brent spot fell from $138 to $69 when a calmer phase seemed likely.
Force two pulls down: more supply and slower demand. OPEC+ has been raising output since 2025, and US producers drill more at high prices. If the risk premium disappears, ample supply meets demand that does not grow at the same pace. Our crude oil price forecast tracks both sides.
For your selection this means two things. Pure producers react most strongly to both forces, integrated companies and midstream operators much less. If you think the sector is cheap but have no view on the oil price, a broad energy ETF is calmer than a single producer.
Conclusion: oil stocks are a cycle business, not a sure thing
The sector has gained strongly since the end of 2024, driven by a war and a blockade. ExxonMobil is up 69 percent, TotalEnergies 70 percent, Shell 68 percent, without dividends. If you read these numbers as a trend that must continue, you confuse a supply shock with a business model.
Choose the profile first, then the name. Upstream gives you the full leverage on the oil price in both directions. Midstream delivers predictable fees and the highest payouts. Downstream runs against the sector at times, and the integrated majors mix everything, which makes them calmer but slower.
Two things cost money in this sector more often than elsewhere. One is outdated data: a screener value from last year is not imprecise for oil stocks, it is wrong, as the Petrobras payout shows. The other is the high-yield partnerships, whose tax treatment can eat the extra yield.
If you do not trust yourself with single stocks, an ETF is the more honest route. A broad energy ETF for 0.08 to 0.37 percent a year spares you the question whether Shell is cheap or just low. If you buy single names, check at least the payout ratio and the legal form before a high yield decides for you.
Frequently asked questions about oil stocks
Which oil stock is the best?
There is no best oil stock, only the one that fits your strategy. For stability, Chevron stands out with 39 years of dividend growth. For full leverage on the oil price, a pure producer like ConocoPhillips fits. For a low valuation, Equinor trades at a P/E of 9.6. If you do not want to choose, buy a broad energy ETF.
Which oil stocks are there?
The ten largest Western-listed oil companies are ExxonMobil, Chevron, Shell, TotalEnergies, ConocoPhillips, Petrobras, BP, Marathon Petroleum, Equinor and Canadian Natural Resources. Add pure producers such as EOG Resources and Devon Energy, refiners such as Phillips 66 and Valero, pipeline operators such as Enbridge and service companies such as SLB and Baker Hughes. Saudi Aramco is the largest of all, but it is listed only in Riyadh.
Which oil stocks pay the highest dividend?
Among corporations, Enbridge pays the most at 5.66 percent, followed by Petrobras at 5.37 and ONEOK at 4.48 percent. Higher yields of 6 to 8 percent come from partnerships such as MPLX, Western Midstream and Energy Transfer. They send a Schedule K-1, cause trouble inside an IRA and can withhold up to 37 percent on distributions to foreign investors. All values as of 29 October 2026.
Should you buy oil stocks now?
The sector has risen sharply since the end of 2024, and the latest leg came with a new oil price shock. A supply shock is not a lasting profit driver: Brent spot fell from $138 to $69 between April and July 2026. If you buy now, you buy after a strong rise. Spreading your entries over several months makes more sense than a yes or no answer.
How does the oil price affect oil stocks?
The effect depends on the business model. Producers sell at the market price, so their profit rises almost one for one with oil. Pipeline operators earn fees and react much less. Refiners buy crude and tend to benefit from lower prices. Integrated majors combine all three effects and swing less.
What is the difference between Brent and WTI?
Brent comes from the North Sea and is shipped by sea, WTI comes from the United States and is delivered inland at Cushing, Oklahoma. Brent normally trades a few dollars higher. When sea routes are disrupted the gap widens: on 2 October 2026 Brent spot was $37.62 above WTI, because WTI does not need the Strait of Hormuz.
What are the alternatives to single oil stocks?
An ETF takes the stock picking off your hands. XLE holds 21 US energy stocks for 0.08 percent a year, IXC 50 global ones for 0.37 percent. Investors in the EU use UCITS versions. If you want to trade the oil price directly, including falling prices, you need futures, which are leveraged and expire.
Which stocks benefit from a rising oil price?
Pure producers benefit most, because their costs per barrel are largely fixed. Examples are ConocoPhillips, Canadian Natural Resources, EOG Resources, Devon Energy and Diamondback. Integrated majors such as ExxonMobil or Shell react less, because their refining business works the other way. Pipeline operators such as Enbridge depend least on the price.
Sources
Company, tax and price data come from these pages, checked on 28 and 29 October 2026. Market values and dividend yields are the figures quoted by stockanalysis.com on 29 October 2026; check them at the source, because they change daily. The tax rules below are general information, not tax advice.
- Oil prices: EIA Brent spot history, EIA WTI spot history, CME on the NYMEX Brent Last Day Financial contract.
- US tax rules for MLPs: IRS partnership withholding, IRS Publication 515, IRS Publication 598, IRS Notice 2023-8 on section 1446(f), Kinetik tax reporting.
- Companies: market data at stockanalysis.com, TotalEnergies NYSE listing, Enbridge dividend policy, Petrobras shareholder remuneration, 6-K of 6 August 2026, Eni third quarter 2026, ExxonMobil third quarter 2026, Chevron third quarter 2026, BP third quarter 2026.
- ETFs: XLE, VDE fact sheet, XOP, IXC, OIH, AMLP, Xtrackers MSCI World Energy, VanEck Oil Services UCITS.
This article is market information, not investment advice. Prices, yields and company data change quickly; check them before you act.
This English edition is based on our German edition on kagels-trading.de and has been adapted for international readers.
More Stocks & Commodities guides
- Choose a silver stock
Best Silver Stocks 2026: 10 Companies Compared
Ten silver producers, streamers and explorers compared on 2025 output, costs, dividends and chart levels after the record highs of early 2026.
- Choose a gold stock
Best Gold Stocks 2026: Miners and Royalty Companies
Eleven gold producers, royalty companies and developers compared on output, costs, dividends and 2026 takeovers, plus gold miner ETFs.