
Best Gold Stocks 2026: Miners and Royalty Companies


Contents
- Gold stocks in 30 seconds
- What are gold stocks?
- Three business models: producers, royalties and developers
- The eleven gold stocks compared
- The XAU and HUI miners indices
- Royalty and streaming companies
- Gold producers
- Developers
- Gold miner ETFs
- How to choose a gold stock
- Conclusion: gold stocks are leverage, with company risk on top
- Frequently asked questions about gold stocks
- Sources
- About the author
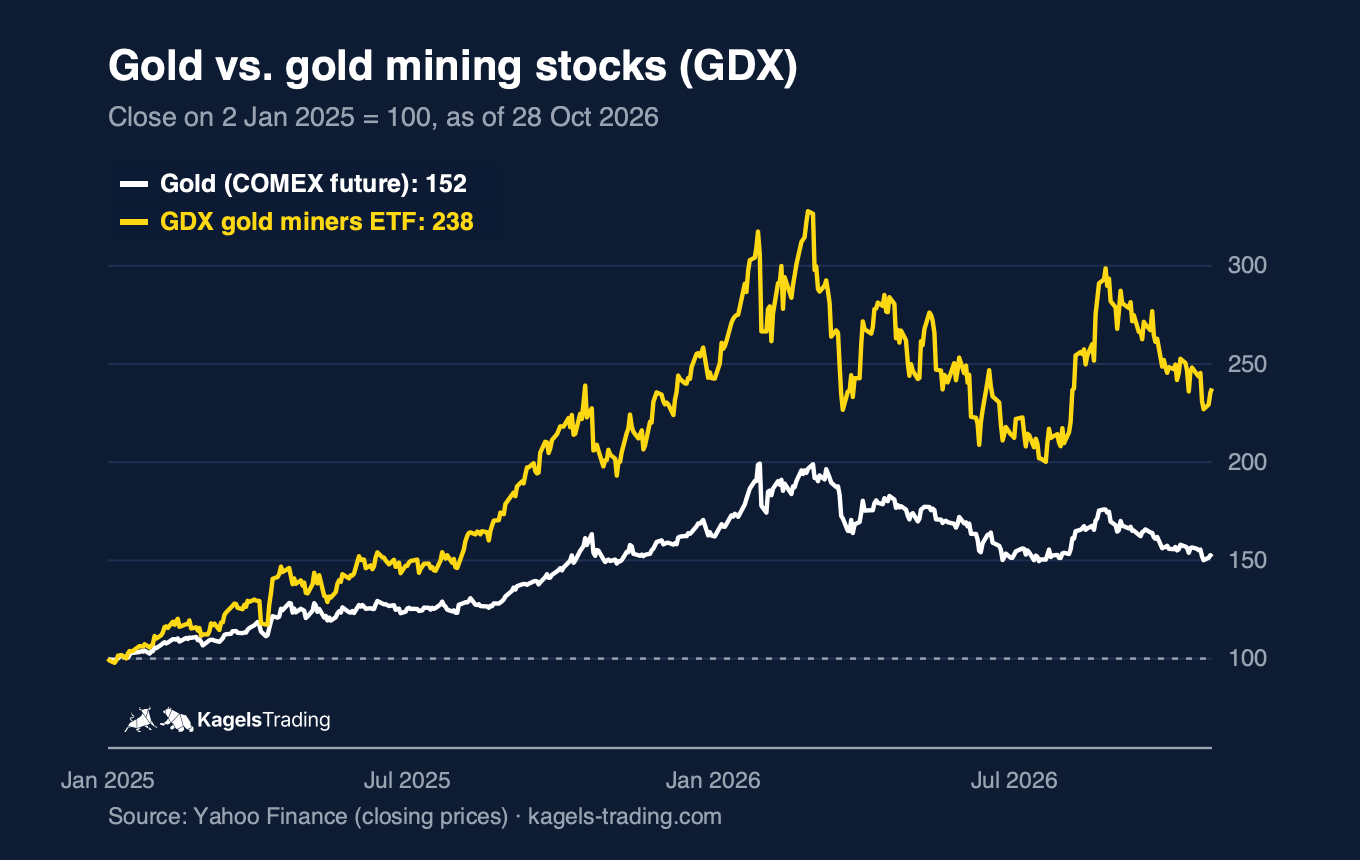
Gold mining stocks are no substitute for physical gold, they are a bet on the miners’ margin. When the gold price rises and production costs stay the same, profits grow faster than the price. This leverage explains why gold stocks beat the metal in good years and fall further in bad ones. From the close on 2 January 2025 to 28 October 2026, gold rose 52 percent and the GDX miners ETF 138 percent.
Many of the best-known gold stocks do not run a single mine. Royalty and streaming companies finance other companies’ projects and receive a share of the output in return. They carry a very different risk than producers. The sector is also consolidating fast: Orla Mining disappeared into Equinox Gold in July 2026, and Vista Gold has agreed to sell itself to Artemis Gold.
This guide compares eleven gold stocks by business model, output, costs and dividends. All company figures come from the companies’ own reports, checked on 29 October 2026. Charts and prices are as of the close on 28 October 2026. Several companies report their third quarter in early November, so check the latest numbers before you buy.
Gold stocks in 30 seconds
- Gold Fields is the largest producer in this overview with 2.44 million attributable gold-equivalent ounces in 2025. Harmony follows with 1.43 million ounces in its year to June 2026, and the streamer Wheaton Precious Metals produced about 690,000 gold-equivalent ounces.
- Not every gold stock is a mine. Producers mine the metal, royalty and streaming companies buy a share of other mines’ output, developers have no revenue yet.
- Royalty models carry less cost risk, but also less leverage. Rising wages or energy prices do not hit them directly. In return, their profit jumps less when the gold price rises.
- Costs rose sharply in 2026. All-in sustaining costs (AISC) of the producers here range from about $1,500 to $2,200 per ounce, and Alamos and Eldorado raised their 2026 cost guidance after operational problems.
- The sector is consolidating. Equinox Gold completed the Orla takeover on 31 July 2026, Eldorado bought Foran Mining in April, and Gold Fields made a rejected offer for Northern Star in September.
What are gold stocks?
Gold stocks are shares of companies that make money with gold: producers mine it, royalty and streaming companies buy a share of other mines’ output, and developers prepare new mines. They are also called gold mining stocks or gold miners.
A gold stock’s profit depends on the gap between the gold price and its costs. Most producers report all-in sustaining costs (AISC) per ounce, which include mining, processing, sustaining capital and overhead, but not the cost of building new mines. The higher the gold price above AISC, the more cash each ounce produces. You can follow the metal itself in our gold price forecast.
Three business models: producers, royalties and developers
Producers carry the full operating risk and the full leverage. They own the mines, pay the workers, the energy and the equipment. When costs rise faster than the gold price, the margin shrinks. When the gold price rises faster, profits jump. Examples here are Gold Fields, Harmony, Alamos, Eldorado and DRDGOLD.
Royalty and streaming companies are the financiers of the industry. A royalty is a right to a percentage of a mine’s revenue. A stream is a contract to buy part of the output at a fixed low price, paid for with money up front. Wheaton, Franco-Nevada, Royal Gold and OR Royalties work this way. They have no mining staff, and their margins are far higher than a miner’s: Wheaton’s cash operating margin in 2025 was $3,040 per gold-equivalent ounce against cash costs of $514.
Developers have deposits but no production yet. Their value depends on financing, permits and the gold price years from now. Vista Gold with its Mt Todd project in Australia is the example in this list, and it is about to be taken over. Developers are the most speculative group.
The eleven gold stocks compared
The table orders the companies by output in their last full financial year. Royalty and streaming companies do not mine, so their figure shows the gold-equivalent ounces (GEO) they received from other mines, while producers show their own output. These numbers are only comparable within the same group.
| Company (ticker) | Type | Output, last full year | AISC per ounce |
|---|---|---|---|
| Gold Fields (GFI) | producer | 2,438,000 oz eq. (2025) | $1,645 |
| Harmony Gold (HMY) | producer, also copper | 1,429,551 oz (FY to June 2026) | $2,195 |
| Wheaton Precious Metals (WPM) | streamer | 689,864 GEO produced (2025) | not applicable |
| Alamos Gold (AGI) | producer | 545,400 oz (2025) | $1,524 |
| Franco-Nevada (FNV) | royalty and stream | 519,106 GEO sold (2025) | not applicable |
| Eldorado Gold (EGO) | producer, also copper | 488,268 oz (2025) | $1,664 |
| Equinox Gold (EQX), incl. former Orla | producer | Orla alone: 300,620 oz (2025) | Orla: $1,458 |
| Royal Gold (RGLD) | royalty and stream | 300,300 GEO (2025) | not applicable |
| DRDGOLD (DRD) | tailings retreatment | 155,577 oz (FY to June 2026) | $1,986 |
| OR Royalties (OR) | royalty and stream | 80,775 GEO (2025) | not applicable |
| Vista Gold (VGZ) | developer | no production | not applicable |
Sources: results releases and annual reports of each company, linked in the sources list at the end of this article. Harmony and DRDGOLD close their financial year on 30 June. Gold Fields reports attributable gold-equivalent production. AISC per ounce sold; Gold Fields, Alamos, Eldorado and Orla for 2025, Harmony and DRDGOLD for the year to June 2026.
Prices rose much faster than output. From the end of 2024 to 28 October 2026, DRDGOLD gained 191 percent, Gold Fields 174 percent and Eldorado 132 percent, while the large royalty companies Franco-Nevada (+103 percent) and Royal Gold (+84 percent) rose less. That fits the leverage logic: the higher the operating risk, the stronger the reaction to the gold price, without dividends.
 Click to enlarge
Source: Yahoo Finance.
The leverage works in both directions. From 2 January 2025 to its peak in early 2026, GDX more than tripled, while gold almost doubled. Since then GDX has fallen from about 328 to 238 on the chart, a drop of roughly 27 percent, while gold gave up about 24 percent from its peak. Miners also react to rising costs, which pushed several producers to cut their 2026 guidance.
The XAU and HUI miners indices
Two indices track listed gold and silver miners in the United States. The PHLX Gold/Silver Sector Index (XAU) holds 30 gold and silver mining stocks, is calculated by Nasdaq and started on 19 January 1979 at 100 points. Its weights are capped, so no single stock dominates. Our silver stocks guide shows the yearly charts of XAU and HUI.
The NYSE Arca Gold BUGS Index (HUI) is the second widely followed miners index. It was originally designed for companies that do not hedge their gold production far ahead, so its members feel the gold price directly. According to NYSE data, the HUI reached a record of 986.06 points on 2 March 2026, far above its old 2011 high. On 29 October 2026 it traded around 690 points.
No common ETF tracks these two indices directly. For investors they serve mainly as sector barometers. The ETFs further below follow other index families.
Royalty and streaming companies
Wheaton Precious Metals (WPM)
Wheaton is the largest streaming company in this list and earns money from gold and silver. It finances mines operated by others, for example Vale’s Salobo mine, and buys part of their output at a fixed price. Since April 2026 it also holds a larger silver stream on the Antamina mine in Peru, bought from BHP for about $4.3 billion. Wheaton is listed in New York, Toronto and London and appears in our silver stocks guide as well.
 Click to enlarge
Source: Twelve Data.
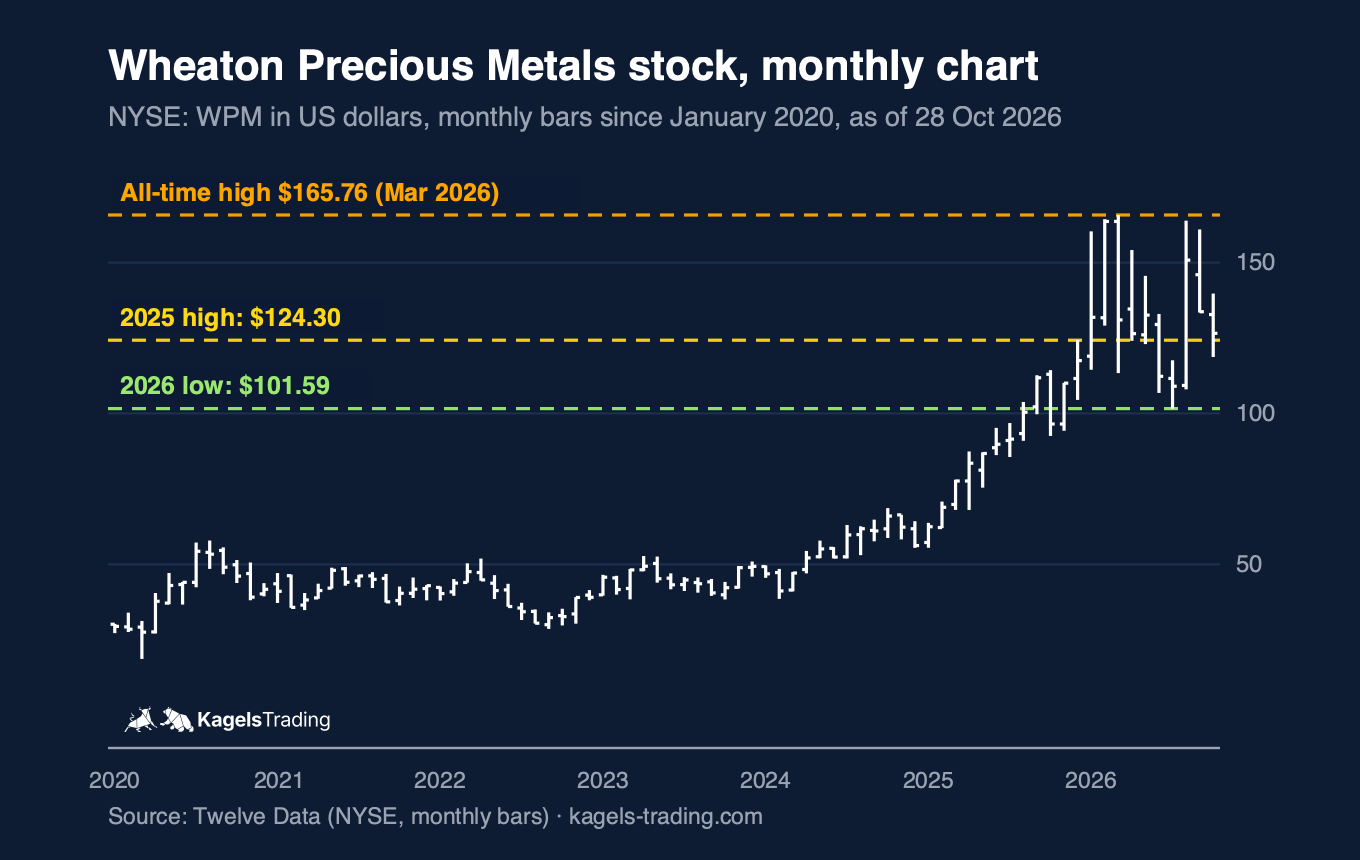
The stock doubled in 2025 and peaked in March 2026. Wheaton set its all-time high at $165.76 in March 2026, fell back to $101.59 in July and rose again to almost $164 in August. On 28 October 2026 it closed at $126.57, right above its 2025 high of $124.30, which now acts as the first support.
The 2025 figures show the growth path. Wheaton produced 689,864 GEO in 2025 and sold 651,311, above its own guidance of 600,000 to 670,000. Proven and probable reserves rose to 25.0 million GEO at the end of 2025. For 2026 Wheaton guides 860,000 to 940,000 GEO at higher assumed metal prices, and it pays $0.195 per quarter. Third-quarter results follow on 5 November 2026.
Franco-Nevada (FNV)
Franco-Nevada is the oldest of the large royalty companies and also holds oil and gas royalties. It receives payments from mines such as Detour Lake and Canadian Malartic, both operated by Agnico Eagle. Its adjusted EBITDA margin was 90.9 percent in 2025.
 Click to enlarge
Source: Twelve Data.
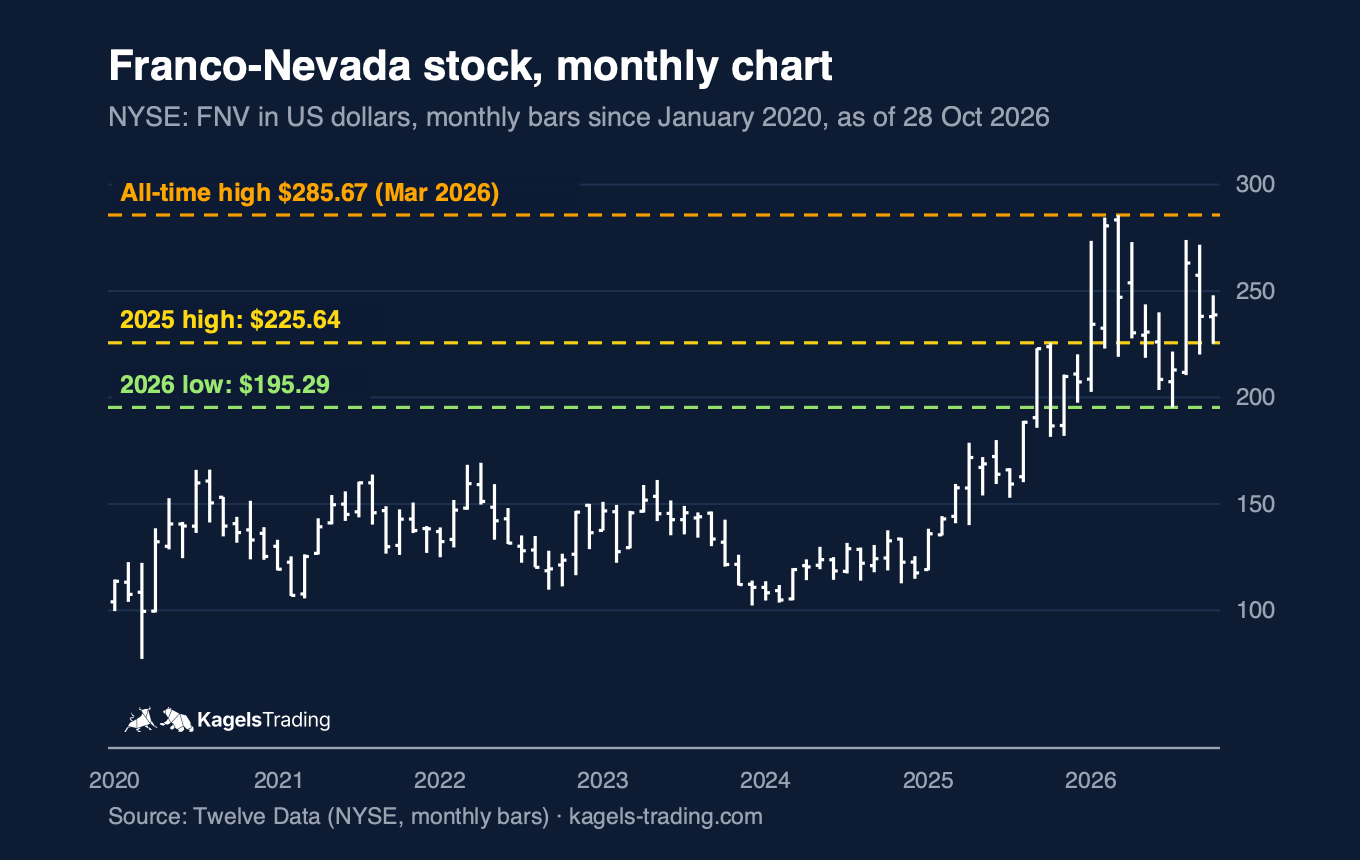
Franco-Nevada broke out of a long sideways range in 2025. The 2025 high was $225.64, the record $285.67 in March 2026. The 2026 low at $195.29 is the key support. On 28 October 2026 the stock closed at $238.80, still above the 2025 high.
2025 was a record year for revenue, but not for volume. Franco-Nevada sold 519,106 GEO, up 12 percent, but below the 627,045 GEO of 2023. The reason is the Cobre Panamá mine, which has been shut since late 2023 and only started processing stockpiles again in May 2026. Franco-Nevada raised its dividend for the 19th year in a row to $0.44 per quarter.
Royal Gold (RGLD)
Royal Gold became much larger through the takeover of Sandstorm Gold and Horizon Copper. The deal closed on 20 October 2025 and was paid mainly in shares. Its largest asset is now the Mount Milligan stream in Canada, followed by Pueblo Viejo in the Dominican Republic with about 12.6 percent of 2025 revenue.
Royal Gold’s revenue reached a record $1.03 billion in 2025. Earnings were $6.70 per share. The GEO volume stayed flat at 300,300, because the Sandstorm assets arrived only in the last quarter. For the next five years Royal Gold expects 430,000 to 480,000 GEO a year. It pays $1.90 a year, its 25th increase in a row.
OR Royalties (OR)
OR Royalties is the former Osisko Gold Royalties, renamed in May 2025. The ticker OR stayed the same in Toronto and New York. Its portfolio holds close to 200 royalties and streams, with the Canadian Malartic royalty as the core asset.
Volumes are flat, margins are very high. OR earned 80,775 GEO in 2025, almost exactly the 2024 level, with a cash margin of 96.7 percent. For 2030 the company targets 120,000 to 135,000 GEO. The dividend is now paid in US dollars, $0.065 per quarter. To fund acquisitions, OR drew $228 million on its credit line by the end of September 2026.
Gold producers
Gold Fields (GFI)
Gold Fields is a South African group with mines in Australia, South Africa, Ghana, Chile and Peru. Since it handed the Damang mine back to the government of Ghana on 18 April 2026, it runs eight mines. The Windfall project in Quebec is still waiting for its environmental approval and a construction decision.
 Click to enlarge
Source: Twelve Data.
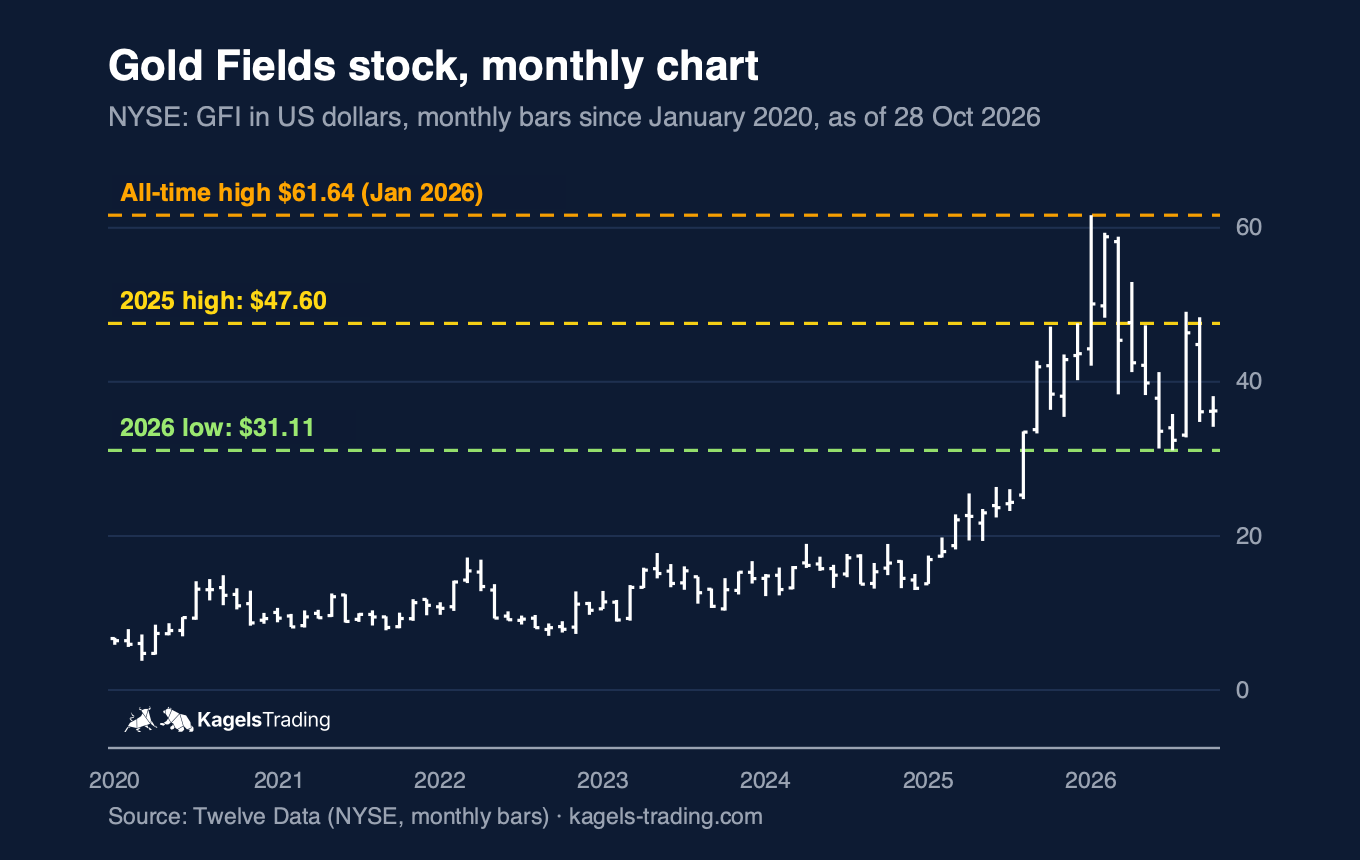
Gold Fields shows the leverage of a producer most clearly in this list. The stock rose from $13.20 at the end of 2024 to an all-time high of $61.64 in January 2026. On 28 October 2026 it closed at $36.23, 41 percent below the record and below the 2025 high of $47.60. The 2026 low at $31.11 is the next support.
The new Salares Norte mine drove growth in 2025. Attributable output rose 18 percent to 2.44 million gold-equivalent ounces, and reserves grew to 48.3 million ounces. Earnings jumped to $3.99 per share. Two risks matter now: the Tarkwa leases in Ghana expire in April 2027, and in September 2026 Northern Star rejected a takeover proposal from Gold Fields.
Harmony Gold (HMY)
Harmony is South Africa’s largest gold producer and has become a copper producer as well. Besides its deep underground mines in South Africa it operates Hidden Valley in Papua New Guinea. It bought the CSA copper mine in Australia with MAC Copper in October 2025 and approved the Eva Copper project a month later.
Output fell, revenue rose. In the year to June 2026 Harmony produced 1,429,551 ounces, 3 percent less than a year earlier, while revenue rose 34 percent to about $5.9 billion. AISC climbed to $2,195 per ounce. Deep-level mining is dangerous: six people died at Harmony’s operations in that year, and the company reported three further fatal incidents between July and September 2026. The dividend for the year totalled 1,280 South African cents.
Alamos Gold (AGI)
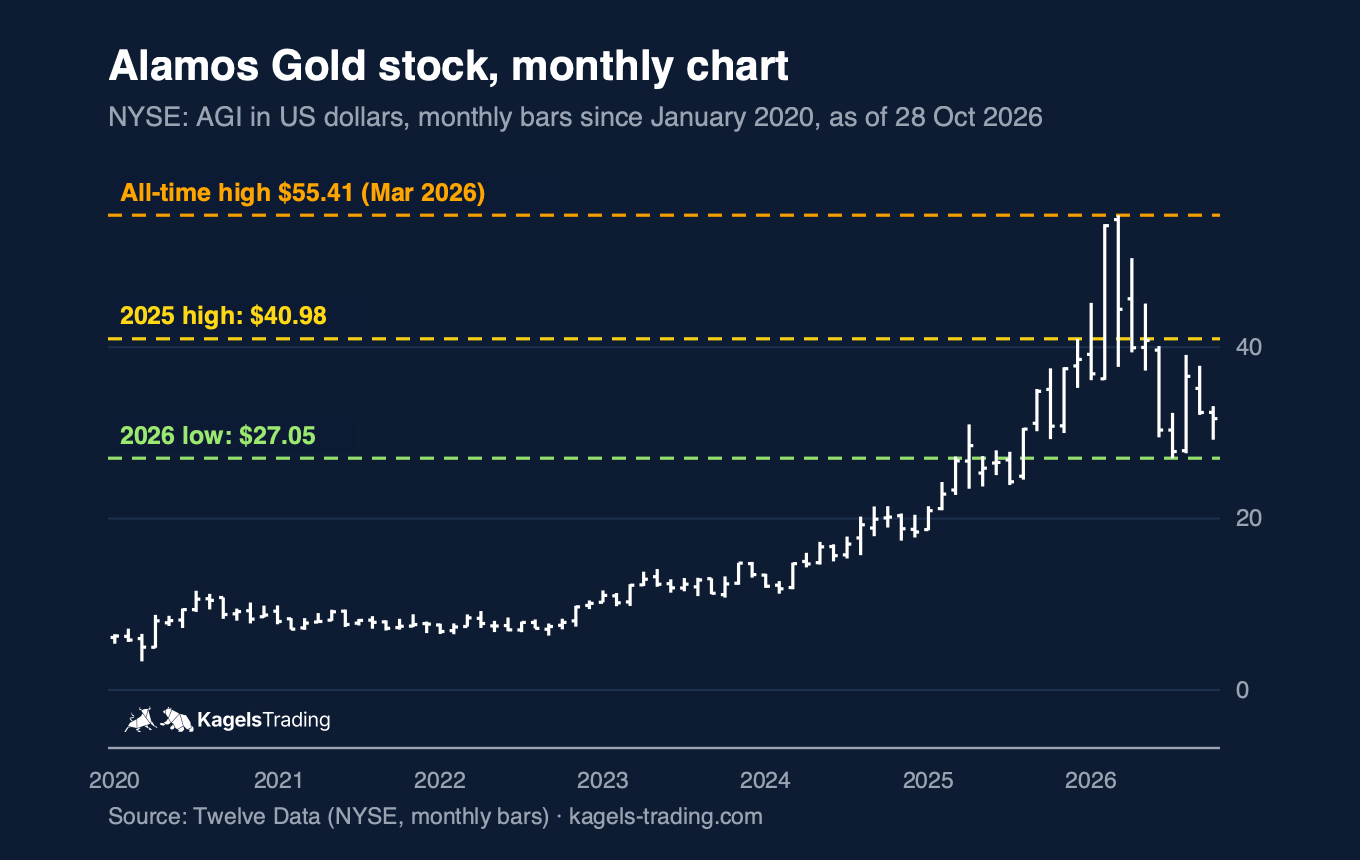
Alamos is a Canadian producer with three operations in Ontario and Mexico. The largest is the Island Gold District, where reserves more than doubled in 2025. Alamos is also building the Lynn Lake mine in Manitoba, with first gold planned for the first half of 2029.
 Click to enlarge
Source: Twelve Data.
Alamos peaked in March 2026 and then lost about half. From the record of $55.41 the stock fell to a low of $27.05. Seismic events at Young-Davidson in June 2026 led to a cut in the 2026 guidance to 510,000 to 560,000 ounces, with AISC raised to $1,775 to $1,875. On 28 October 2026 the stock closed at $31.67, below the 2025 high of $40.98.
The third quarter of 2026 met the reduced guidance. Alamos produced about 119,000 ounces, a record 68,700 of them from Island Gold. The expansion shaft there is delayed to mid-2027. The dividend was raised by 60 percent at the start of 2026 to $0.04 per quarter.
Eldorado Gold (EGO)
Eldorado mines gold in Canada, Türkiye and Greece and is turning into a gold and copper company. It completed the takeover of Foran Mining on 14 April 2026, which brought the McIlvenna Bay copper and zinc mine in Saskatchewan. Its Skouries copper and gold mine in Greece shipped its first concentrate on 8 September 2026.
Eldorado cut its 2026 guidance on 28 October 2026. Total output is now expected at 425,000 to 475,000 ounces, down from up to 590,000, and AISC at the operating mines rose to $1,975 to $2,125. Skouries is slower to ramp up than planned, with commercial production expected late in 2026. Eldorado announced a quarterly dividend programme in January 2026 and made the first payment of $0.075 in March.
Equinox Gold, including the former Orla Mining (EQX)
Orla Mining no longer trades on its own. Equinox Gold completed the takeover on 31 July 2026: every Orla share became one Equinox share plus a token cash amount. Orla brought the Musselwhite mine in Ontario, the Camino Rojo mine in Mexico and the South Railroad project in Nevada, which received its federal permit on 17 August 2026.
If you held Orla, you now hold Equinox. In 2025 Orla alone produced 300,620 ounces at an AISC of $1,458. Equinox produced 237,019 ounces in the third quarter of 2026, including two months of the former Orla mines. Its third-quarter financial results are due on 9 November 2026.
DRDGOLD (DRD)
DRDGOLD does not mine underground, it reprocesses old tailings around Johannesburg. Its operations Ergo and Far West Gold Recoveries recover gold from historic dumps. The geological risk is low, but power supply and local protests can stop the plants. Sibanye-Stillwater owns 50.1 percent.
DRDGOLD is the strongest performer in this list since the end of 2024, up 191 percent. In the year to June 2026 it produced 155,577 ounces at an AISC of $1,986, and it reports reserves of 6.24 million ounces in its dumps. The company has no debt and paid 170 South African cents in dividends for the year. Its Vision 2028 programme aims to lift output toward about six tonnes of gold a year by 2028.
Developers
Vista Gold (VGZ)
Vista Gold is a developer with a single project and an agreed takeover. Its Mt Todd project in Australia’s Northern Territory holds proven and probable reserves of 5.19 million ounces. Vista’s own 2025 feasibility study planned a smaller mine of about 153,000 ounces a year with an initial investment of $425 million.
Artemis Gold agreed to buy Vista on 20 September 2026. Each Vista share will become 0.0966 Artemis shares, about $2.83 per share at announcement and about $427 million in total. Closing is expected in the first quarter of 2027. Artemis plans to build Mt Todd at the larger permitted rate of 50,000 tonnes a day, and only after its Blackwater expansion is finished, expected by mid-2028. New economics for that plan are not published yet. Until closing, the share price mainly follows the Artemis price, not the gold price.
Gold miner ETFs
A gold miner ETF spreads the company risk over dozens of stocks. That matters in a sector where a single mine accident, a lost lease or a guidance cut can move a stock 20 percent in a day. The table shows the main US-listed funds.
| ETF (ticker) | Focus | Expense ratio | Holdings |
|---|---|---|---|
| VanEck Gold Miners (GDX) | large global gold miners | 0.51% | 59 |
| VanEck Junior Gold Miners (GDXJ) | smaller gold and silver miners | 0.52% | 155 |
| iShares MSCI Global Gold Miners (RING) | global gold miners | 0.39% | 40 |
| Sprott Gold Miners (SGDM) | gold miners selected by factors | 0.46% | 48 |
Expense ratios and holdings from the issuers’ pages, as of 28 October 2026. GDX held $25.9 billion, GDXJ $7.7 billion.
GDX is the benchmark most investors watch, RING is the cheapest. GDX is by far the largest and most liquid fund. GDXJ holds smaller companies and swings harder. Investors in the European Union usually need UCITS versions of these funds, because US-domiciled ETFs publish no key information document.
How to choose a gold stock
Start with the business model, then look at the numbers. If you want maximum leverage on the gold price, a producer fits. If you want steadier cash flow and fewer surprises, a royalty company fits better. Developers are a bet on one project.
Five figures tell you most of what you need. First, AISC against the gold price: the bigger the gap, the more resilient the mine. Second, reserves and mine life: how many years of production are proven. Third, the jurisdiction: Ghana, South Africa, Mexico or Canada carry different political and tax risks. Fourth, the balance sheet: net cash or net debt. Fifth, the guidance record: companies that miss their targets repeatedly, as several did in 2026, deserve a discount.
Chart levels help with timing, not with selection. All four charts above show the 2025 high, the record high of early 2026 and the 2026 low. A stock that holds above its 2025 high is in a different position than one that fell below it. To compare a stock with the sector, our guide to relative strength shows a simple method.
Size every position for the volatility of this sector. Gold stocks can lose 40 percent within a few months, as Gold Fields and Alamos showed in 2026. Our position sizing guide explains how to keep such a drop from hurting your account.
Conclusion: gold stocks are leverage, with company risk on top
Gold stocks remain a way to profit from a rising gold price, but they are not a safe haven. In 2025 and early 2026 the miners rose much faster than gold. Since the peak they have also fallen faster, and rising costs have pushed several producers to cut their guidance.
Royalty and streaming companies are the calmer choice. Wheaton and Franco-Nevada fell less than the producers, and their margins stay high because they run no mines themselves. In return, they usually have less leverage to the gold price than a producer.
Producers offer more upside and more risk. Gold Fields and Alamos show both sides: huge gains to early 2026, then drops of 40 to 50 percent. Watch each company’s costs, its mines’ locations and its next quarterly report before you commit money.
If you do not want to pick single names, a broad ETF is the simpler route. GDX or RING spread the risk over dozens of companies. For the metal itself, see our gold price forecast, and for silver producers our silver stocks guide.
Frequently asked questions about gold stocks
What are gold stocks?
Gold stocks are shares of companies that make money with gold. Producers mine it, royalty and streaming companies buy a share of other mines’ output, and developers prepare new mines. They are also called gold mining stocks or gold miners.
Which gold stocks are the largest?
By output, Gold Fields leads this overview with 2.44 million gold-equivalent ounces in 2025, followed by Harmony Gold. Worldwide, the largest producers are Newmont, Agnico Eagle and Barrick, which are not covered in detail here. Among royalty companies, Wheaton Precious Metals and Franco-Nevada are the largest.
How risky are gold stocks?
Gold stocks are more volatile than gold itself. Their profits depend on the gold price and on costs such as energy and wages, so moves of 40 percent within months are not unusual. On top come company risks: mine accidents, lost permits, delays and takeovers. Keep positions small and spread over several companies or use an ETF.
Why invest in gold stocks instead of gold?
Gold stocks give you leverage on the gold price and often a dividend. When gold rises, miners’ profits can rise much faster. Physical gold pays nothing, but it carries no operating risk. Many investors hold both: gold as insurance, gold stocks as the leveraged part.
What are royalty and streaming companies?
Royalty and streaming companies finance mines and receive part of their revenue or output in return. A royalty pays a percentage of revenue, a stream lets the company buy metal at a fixed low price. They have no mining staff and very high margins, but less leverage than producers.
How can I invest in gold stocks?
You can buy single gold stocks through any broker that offers US or Canadian shares, or buy a gold miner ETF. Many South African and Canadian miners trade in New York as American depositary shares or direct listings. GDX, GDXJ, RING and SGDM are the main US-listed ETFs.
Do gold stocks pay dividends?
Most large producers and all royalty companies in this list pay dividends. Franco-Nevada pays $0.44 per quarter, Royal Gold $1.90 a year, and Eldorado started paying in 2026. The South African miners Gold Fields and Harmony pay in rand and link the payout to free cash flow, so the amount changes from year to year. Foreign withholding taxes may apply, depending on where you live.
What moves gold stocks besides the gold price?
Costs, production news and takeovers move gold stocks as much as the metal. Rising energy and wage costs squeeze margins, a guidance cut can send a stock down sharply, and takeover offers lift targets. In 2026 seismic events, ramp-up delays and lease negotiations moved several stocks in this list. For the metal’s own outlook, see our gold price forecast.
Sources
Every company figure comes from the companies’ own filings, checked on 29 October 2026. Prices and ETF data are dated where they appear. Quarterly reports change the production and cost figures several times a year, so check the latest release before you act.
- Royalty and streaming companies: Wheaton 2025 results, Franco-Nevada 2025 results, Royal Gold 2025 results, OR Royalties 2025 results.
- Producers: Gold Fields 20-F for 2025, Harmony results for the year to June 2026, DRDGOLD results for the year to June 2026, Alamos 2025 results, Eldorado 2025 results, Eldorado third quarter 2026, Eldorado dividend programme, Orla 2025 results, Orla takeover closing.
- Developer: Vista Gold 10-K for 2025, Artemis and Vista takeover announcement.
- Indices and ETFs: XAU at Nasdaq, HUI at NYSE, GDX, GDXJ, RING, SGDM.
This article is market information, not investment advice. Company figures and prices change quickly; check the latest reports before you act.
This English edition is based on our German edition on kagels-trading.de and has been adapted for international readers.
More Stocks & Commodities guides
- Choose a silver stock
Best Silver Stocks 2026: 10 Companies Compared
Ten silver producers, streamers and explorers compared on 2025 output, costs, dividends and chart levels after the record highs of early 2026.
- Choose an oil stock
Best Oil Stocks 2026: Majors, Pipelines and Refiners
The largest oil producers, pipelines and refiners by market value and dividend, the MLP tax traps and the main energy ETFs.