
Joe Ross's Gimmee Bar: Bollinger Bands for Sideways Markets


Contents
- Gimmee Bar in 30 seconds
- What is a Gimmee Bar?
- Where the rules come from: Joe Ross and our additions
- Step 1: confirm the sideways market before the signal
- Step 2: what qualifies as a Gimmee bar
- Long and short rules at a glance
- Entry, stop, target and expiry: how the order works
- The three exceptions: when to leave a Gimmee bar alone
- Example 1: a clean Gimmee bar in Procter & Gamble
- Example 2: a Gimmee bar that failed
- What the two examples teach
- Limits of the Gimmee Bar
- Frequently asked questions about the Gimmee Bar
- About the author
The Gimmee Bar is a reversal setup for markets that move sideways. It combines a simple reversal bar with Bollinger Bands and trades the swing back from one edge of a range toward the other. Joe Ross described it in one of his books from the late 1990s, and I represented Joe Ross in Germany for more than 17 years.
This guide turns the setup into rules you can actually follow. You get the long and short rules, the entry order, the stop, the target, when an order expires and how to handle gaps. Then you see one trade that worked and one that failed, both in Procter & Gamble in 2026 and both under the same rules. This article follows our editorial policy.
Gimmee Bar in 30 seconds
- Definition: a Gimmee Bar is a bar that reverses direction at the upper or lower Bollinger Band while the market is moving sideways overall.
- Settings: Bollinger Bands 20, 2, a 20-bar average of the close with bands two standard deviations away.
- Long signal: prices fall, touch the lower band, and that bar or the next one closes above its open. You buy one tick above its high.
- Three reasons to skip: the bar reaches the middle band, the bar is much larger than the bars before it, or the next bar opens with a gap beyond the Gimmee bar.
- What Ross left open: stop, target and order expiry. We add fixed rules for them and mark them as our choices.
- Two examples, two outcomes: one Procter & Gamble trade reached its target in three sessions, the next one was stopped out the day after entry.
What is a Gimmee Bar?
A Gimmee Bar is a reversal bar that forms at the upper or lower Bollinger Band while a market is in a sideways range.
The idea is older than the indicator. Reversal bars at the end of a short rise or fall are among the oldest chart patterns. Ross tied them to Bollinger Bands, which mark unusually stretched prices. In a sideways market, a reversal at a band can start the swing back toward the middle and the other side of the range.
The setup only makes sense when the market has no clear trend. In a strong trend, prices can walk along the band for weeks, and a reversal bar at the band is then often just a pause. The Bollinger Bands guide shows this “walking the band” behavior and explains the settings and the standard deviation in detail.
Where the rules come from: Joe Ross and our additions
Ross described the setup in his book Electronic Trading “TNT” IV (1998), in a short chapter called “Gimmees”. The chapter defines the signal bar, the entry order and three situations in which he would not take the trade. It does not set a protective stop, a profit target or a time limit for the order.
Rules you cannot execute are not rules, so we filled those gaps with our own choices. Every choice below is marked as editorial, which means it comes from Kagels Trading, not from Ross. We fixed them in writing before we chose the examples, and we applied them to both trades without change.
| Part of the setup | Documented by Joe Ross | Our editorial choice |
|---|---|---|
| Market condition | Prices overall in a sideways range | ADX(14) below 25 and a flat middle band |
| Band settings | 20-bar average of the close, 2 standard deviations | Population standard deviation, as on the Bollinger Bands guide |
| Signal bar | Touching bar or the next bar closes against the prior direction | Prior direction: close below (long) or above (short) the close three bars earlier |
| Entry | One tick beyond the Gimmee bar | Stop order valid for the next session only |
| Too close to the middle band | Skip, “a matter of judgment” | Skip if the bar reaches the inner quarter between band and middle band |
| Oversized bar | Skip if excessively long | Skip if the range is more than twice the average of the previous five bars |
| Gap | Skip if the next bar opens beyond the Gimmee bar’s range | Same rule, both directions |
| Protective stop | Not specified in the chapter | One tick beyond the other end of the Gimmee bar |
| Target and exit | Not specified in the chapter | Opposite band at the Gimmee close, or exit at the close of the 10th session after entry |
Step 1: confirm the sideways market before the signal
The most important filter comes before the bar itself: the market has to be moving sideways. Ross only says that prices must be overall in consolidation. That is a judgment, so we add two measurable checks on the day of the Gimmee bar.
- Trend strength: the ADX indicator with 14 periods is below 25. Readings above 25 are commonly read as a trend.
- Flat middle band: the 20-day average has moved less than 2% over the previous 10 sessions.
- Visual check: prices have swung between both halves of the bands in recent weeks and show a recognizable high and low of the range.
The checks remove obvious trends, but they cannot guarantee that the range holds. Every range ends at some point, and the breakout often starts exactly at the band where a Gimmee bar forms. How to find and trade the edges of a range in general is covered in the guide to range trading.
Step 2: what qualifies as a Gimmee bar
A Gimmee bar must close against the move that brought prices to the band. For a long setup, prices were falling and the bar closes above its open. For a short setup, prices were rising and the bar closes below its open. Ross allows two candidates: the bar that touches the band, or the very next bar.
The second candidate matters in practice. In both examples below, the bar that touched the lower band closed below its open and did not qualify. The next bar closed above its open and became the Gimmee bar. A bar that closes exactly at its open is not a reversal bar.
For the prior direction we use a simple test. For a long, the touching bar closes below the close three bars earlier; for a short, above it. Ross shows the falling or rising move only in his chart examples, so this test is our editorial addition.
Long and short rules at a glance
The long version trades the swing up from the lower band:
- Market: sideways under Step 1, and prices have been falling inside the range.
- Touch: a bar reaches or crosses the lower Bollinger Band.
- Gimmee bar: that bar or the next one closes above its open.
- Entry: buy stop one tick above the high of the Gimmee bar, for the next session only.
- Stop: one tick below the low of the Gimmee bar (editorial).
- Target: the upper band at the close of the Gimmee bar, as a fixed limit order (editorial).
The short version is the mirror image:
- Market: sideways under Step 1, and prices have been rising inside the range.
- Touch: a bar reaches or crosses the upper Bollinger Band.
- Gimmee bar: that bar or the next one closes below its open.
- Entry: sell stop one tick below the low of the Gimmee bar, for the next session only.
- Stop: one tick above the high of the Gimmee bar (editorial).
- Target: the lower band at the close of the Gimmee bar (editorial).
Entry, stop, target and expiry: how the order works
The entry is a stop order, so the market has to confirm the reversal before you are in. On a daily chart you place a buy stop after the close of the Gimmee bar, one tick above its high. For a stock, one tick is one cent; in our examples we add it to the high as shown on daily bars rounded to the cent. If the next session never trades above that price, nothing happens.
We cancel the entry order if it does not fill in the next session. Ross does not say how long the order stays valid. A one-session limit keeps the trade tied to the reversal bar that justified it; a day later, a new bar is the reference. That is an editorial choice, and a longer window is possible if you test it.
The protective stop sits one tick beyond the other end of the Gimmee bar. For a long, that is one tick below its low. If prices fall back through the low of the reversal bar, the reversal has failed. The stop is tight by design, which keeps the planned risk small but leads to frequent stop-outs, as the second example shows.
A stop order limits the planned risk, not the actual loss. When the price reaches the stop, the order becomes a market order and fills at the next available price. If the stock opens with a gap below the stop (long) or above it (short), the fill can be much worse than the stop price; the SEC explains this in its investor bulletin on stop orders. Our examples assume fills at the order prices, without slippage or costs.
The target is the opposite band, frozen at the close of the Gimmee bar. Bands move every day, so we take the value of the upper band (long) or lower band (short) on the signal bar and place a fixed limit order there. If neither the stop nor the target is hit, we exit at the close of the tenth session after the entry session. Both rules are editorial; many traders take part of the position off at the middle band instead.
Position size follows from the stop distance. The distance between entry and stop is your risk per share. How to turn it into a number of shares with a fixed percentage risk is explained in the guide to risk management.
The three exceptions: when to leave a Gimmee bar alone
Ross named three situations in which he would not take the trade, and two of them need a number to become usable. We kept his logic and added thresholds where he called the decision a matter of judgment.
- Too close to the middle band: if the high of a long Gimmee bar (or the low of a short one) touches or nearly touches the middle band, prices often stall there and little room is left. Our threshold: skip if the bar reaches the inner quarter of the distance between the band and the middle band.
- Oversized bar: a bar that is much larger than the bars before it is often followed by a reaction to that large move rather than a clean swing. Our threshold: skip if its range is more than twice the average of the previous five bars.
- Gap on the next bar: if the next session opens beyond the range of the Gimmee bar, above its high or below its low, skip the trade. Gaps outside a single bar’s range often move back toward the previous close, and a long that opens above the entry price would also fill worse than planned. More on this behavior in the guide to gap trading.
Example 1: a clean Gimmee bar in Procter & Gamble
 Click to enlarge
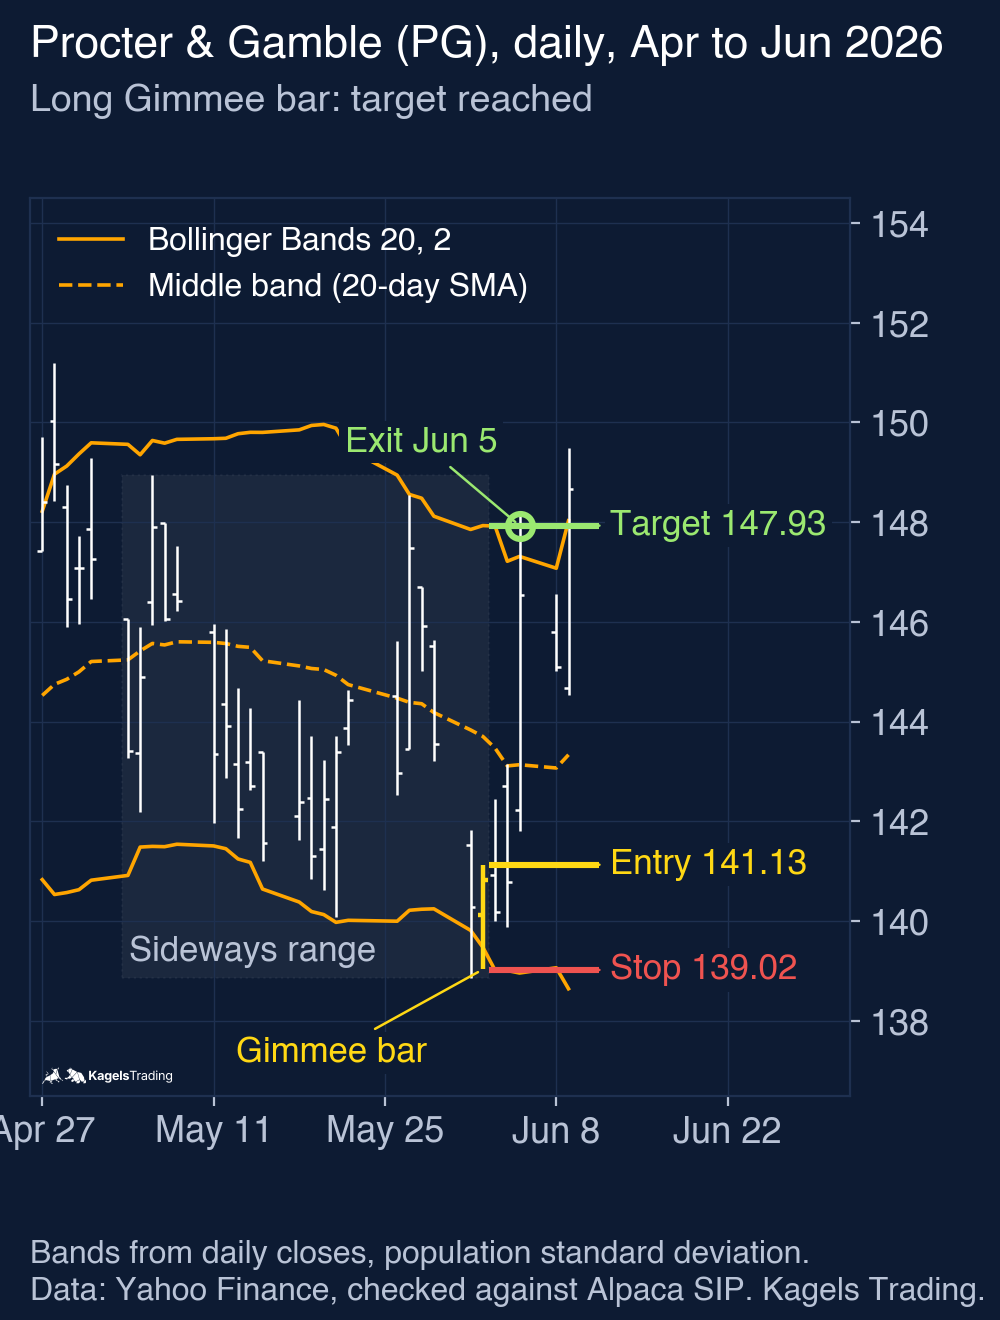
In late May 2026, Procter & Gamble traded in a sideways range between about $139 and $149. On June 2, the ADX(14) stood at 15.9 and the middle band had moved only 0.97% in ten sessions, so both checks for a sideways market were met.
The touch came on June 1, but that bar did not qualify. It fell to $138.86, below the lower band at $139.81, and closed at $140.28, below its open. On June 2 the stock opened at $140.12 and closed at $140.82, above its open. That made June 2 the Gimmee bar, with a high of $141.12 and a low of $139.03.
None of the three exceptions applied. The high of $141.12 stayed well below the middle band at $143.70 and below our threshold of $142.65. The bar’s range of $2.09 was smaller than the five-bar average of $3.05. On June 3 the stock opened at $140.93, inside the Gimmee bar’s range, so there was no gap.
The buy stop at $141.13 filled on June 3, when the stock traded up to $142.45. The stop sat at $139.02 and the target at $147.93, the upper band on June 2. On June 3 and 4 the lows of $140.00 and $139.89 came within a dollar of the stop. On June 5 the stock rose to $148.23, and the limit order at the target was filled.
The trade made $6.80 per share for a risk of $2.11, before costs. That is a reward of about 3.2 times the risk. Most of the gain came from one strong session on June 5, which shows how quickly a range trade can work when it works.
Example 2: a Gimmee bar that failed
 Click to enlarge
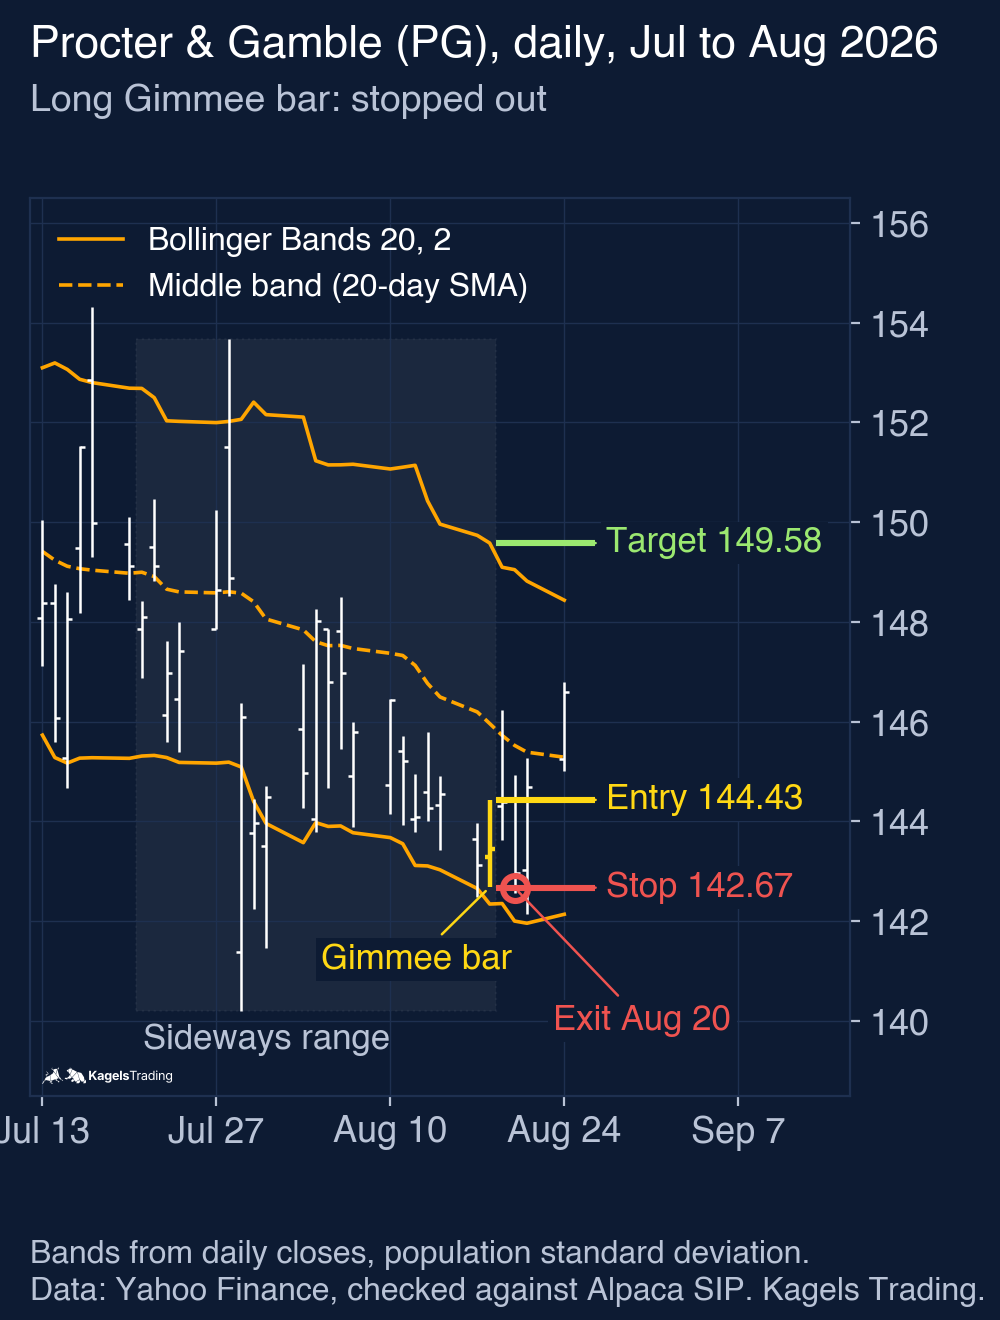
Eleven weeks later the same stock produced a signal that looked even better on paper. On August 18 the ADX(14) was only 6.0, a very weak trend reading, and the middle band had moved 1.11% in ten sessions. The range of the previous 20 sessions ran from about $140 to $154.
Again the touching bar did not qualify, and the next bar did. On August 17 the stock fell to $142.48, below the lower band at $142.65, and closed below its open. On August 18 it opened at $143.28 and closed at $143.45, above its open. That made August 18 the Gimmee bar, with a high of $144.42 and a low of $142.68.
The exception checks were passed again. The high stayed below our middle band threshold of $145.06. The range of $1.74 was larger than the five-bar average of $1.54, but well below twice that average. On August 19 the stock opened at $144.30, inside the Gimmee range, so there was no gap.
The buy stop at $144.43 filled on August 19, but the stock closed that day back at $144.38. On August 20 it fell to $142.56, below the stop at $142.67, and the trade was closed with a loss of $1.76 per share before costs. The target at $149.58 was never in reach.
The stock then recovered and closed at $146.60 on August 24. A wider stop would have survived, but changing the stop after the fact is exactly the kind of hindsight that makes a setup look better than it is. Under fixed rules, this was a losing trade.
What the two examples teach
A Gimmee bar gives you a defined risk, not a high probability. The stop is close and the target is far, so a single winner can pay for several losers. That only works if you take every valid signal and keep the stop where the rules put it.
The clean example is not the typical outcome. We found both examples by scanning 15 US ETFs and large stocks with the rules above, for band touches from January 6, 2023 to October 19, 2026 (data through November 6, 2026). We used daily bars rounded to the cent for all calculations. Of 293 triggered trades, one per stock, direction and Gimmee bar, 176 reached the stop first, 26 reached the target and 62 ended at the time exit. In 29 cases entry and stop fell into the same daily bar and the bar closed above the stop (long) or below it (short), so the daily data cannot show whether the stop was hit after the entry. That scan is not a backtest: it ignores costs and slippage, signals overlap, and we tested only one rule variant. It is a reason to test the setup on your own market before you trade it, and to judge it by results over many trades, not by one chart example.
Daily bars do not show the order of prices within a day. If entry and stop, or stop and target, fall into the same daily bar, the daily chart often cannot tell you which came first. Sometimes it can: if a long is entered and the same bar closes below the stop, the stop must have been crossed after the entry. We chose two examples where this question does not arise. In your own testing, count such trades separately or check them on an intraday chart.
Limits of the Gimmee Bar
The setup depends on a range that you can only confirm in hindsight. The filters reduce the number of signals in trends, but the break of a range often begins with exactly the kind of band touch that looks like a Gimmee bar.
The tight stop makes the result sensitive to noise and costs. In Example 1 the risk was $2.11 per share, in Example 2 only $1.76. Commissions, the bid-ask spread and slippage on the stop order take a larger share of such small distances than of a wide swing trade.
Our editorial choices are reasonable defaults, not Ross’s rules. Another trader may use the middle band as the target, keep the order open for two sessions or measure the sideways market differently. Each change produces a different set of trades, so test it on your own data before you rely on it. A simple way to start is described in the guide to backtesting.
Frequently asked questions about the Gimmee Bar
What is a Gimmee Bar in trading?
A Gimmee Bar is a reversal bar at the upper or lower Bollinger Band in a sideways market. For a long, prices fall to the lower band and the touching bar or the next one closes above its open. You buy one tick above its high and aim for the other side of the range.
Who invented the Gimmee Bar?
The Gimmee Bar comes from Joe Ross, a trader and author of many trading books. He described it in a chapter called “Gimmees” in Electronic Trading “TNT” IV (1998). He tied the setup to Bollinger Bands; reversal bars themselves are much older.
What Bollinger Band settings does the Gimmee Bar use?
Ross used the standard settings: a 20-bar moving average of the close and bands two standard deviations away. These are the default 20, 2 settings in most charting software. We calculate them with the population standard deviation, as in our Bollinger Bands guide.
Where do I place the stop on a Gimmee Bar trade?
Ross’s chapter does not set a stop, so we place it one tick beyond the other end of the Gimmee bar. For a long, that is one tick below the low of the signal bar. If prices fall through it, the reversal has failed and the trade is closed.
Does the Gimmee Bar work in trending markets?
No, the setup is built for sideways markets. In a trend, prices often walk along the band, and a reversal bar there is frequently just a pause. That is why we check the ADX and the slope of the middle band before every signal.
Is the Gimmee Bar profitable?
We have not tested whether it is profitable, and two examples cannot answer that question. In our scan, far more triggered trades reached the stop than the target, which is expected with a tight stop and a distant target. Whether the winners pay for the losers depends on your market, your costs and how strictly you follow the rules.
This article explains a chart setup for educational purposes. It is market analysis, not investment advice, and the examples show past prices, not a promise of future results.
More Technical Indicators guides
- Judge a golden cross
Golden Cross: Definition and S&P 500 Test Results
How the 50-day and 200-day averages cross, and what 38 signals in the S&P 500 since 1950 did against the base rate and buy and hold.
- Judge a death cross
Death Cross: What 38 S&P 500 Signals Since 1950 Show
How deep the S&P 500 fell after 38 death crosses since 1950, how late the signal comes, and what shorting it on SPY did since 1993.
- Judge a Hindenburg Omen
Hindenburg Omen: What 21 Signal Clusters Since 2017 Show
How the breadth signal is calculated, why trackers disagree on its rules, and how often SPY fell 10% after 21 signal clusters since 2017.
- Use moving averages
Moving Averages: SMA, EMA and a 76-Year 200-Day Test
SMA, EMA and WMA formulas with a worked example, common periods, and what the 200-day line showed on the S&P 500 since 1950.
- Trail a stop with the Supertrend
Supertrend Indicator: Settings, Strategies and an ETF Test
How the ATR-based line is calculated, common settings, five strategies, and what 654 completed flip trades in SPY, QQQ and GLD since 1993 showed.
- Read the Ichimoku Cloud
Ichimoku Cloud: The Five Lines and a US ETF Test
The five lines and the cloud, how traders read the Tenkan/Kijun cross, and what the cloud and the crosses did in SPY (since 1993), QQQ and GLD.
- Measure trend strength with the ADX
ADX Indicator: What Trend Strength Really Tells You
How +DI, −DI and the ADX are calculated, what 20 and 25 mean, and whether a high ADX meant the trend went on in SPY, QQQ and GLD.
- Read the RSI
RSI Indicator: Formula, Settings and a 75-Year Test
The RSI formula, overbought and oversold, and what RSI signals did on the S&P 500 since 1951 against the base rate.
- Compare a stock with the market
Relative Strength: Compare Stocks with the Market
The price ratio behind every relative strength line, how it differs from the RSI, a five-step watchlist and two Dow examples from one selection date.
- Read volatility with Bollinger Bands
Bollinger Bands: Settings, Squeeze and a 76-Year Test
Settings, the three typical chart situations, five strategies with rules, and what the bands and the squeeze showed on the S&P 500 since 1950.
- Set stops with the ATR
ATR Indicator: Average True Range for Stops and Size
True range and Wilder smoothing, stop distance and position size, and how ATR stops behaved on SPY from 1994 to 2026 against a fixed stop.
- Trade Donchian breakouts
Donchian Channel: Breakout Rules and a 20-Year ETF Test
Channel rules, the current-bar pitfall, the Turtle systems, and what 499 breakout trades in SPY, GLD and TLT from 2006 to 2026 showed.
- Read the Stochastic
Stochastic Oscillator: Settings, Signals and a 30-Year Test
The %K and %D formula, what 14, 3, 3 means, fast versus slow, and what 785 oversold signals in SPY, QQQ and GLD did against the base rate.
- Judge a divergence
Divergence Trading: Regular and Hidden Divergence Tested
Regular and hidden, bullish and bearish divergences, when they are confirmed, and what 447 RSI divergences detected in SPY, QQQ and GLD did against the base rate.
- Read the MACD
MACD Indicator: Histogram, Divergence and a 31-Year Test
Formula, histogram, crossovers and divergences, with a 31-year test on the S&P 500 and the DAX against the base rate.
- Use VWAP
VWAP Indicator: Formula, Anchored VWAP and TradingView Setup
The VWAP formula, trend day versus range day, Anchored VWAP and the right settings in TradingView.