
Divergence Trading: Regular and Hidden Divergence Tested


Contents
- Divergence trading in 30 seconds
- What is a divergence?
- The four types: regular and hidden, bullish and bearish
- Confirmation: when does a divergence exist?
- My test: RSI divergences in SPY, QQQ and GLD
- Divergence with RSI, MACD and Stochastic
- How to use divergences sensibly
- Advantages and disadvantages of divergence trading
- My conclusion: a description of momentum, not a forecast
- Frequently asked questions about divergences
- About the author
A divergence is one of the most quoted warning signs in technical analysis. Price makes a new high, the oscillator below the chart does not, and the conclusion seems obvious: the momentum is running out. There is a second, less known kind, the hidden divergence, which is read as the opposite: a sign that the trend will continue.
This guide explains both kinds, in both directions, and the point that most explanations skip: when a divergence is actually confirmed. Then I counted every RSI divergence by a fixed rule in three US ETFs, SPY, QQQ and GLD, and compared what followed with an average trading day. The MACD version of the count is in the MACD indicator guide; this article does not repeat it. This article follows our editorial policy.
Divergence trading in 30 seconds
- Regular divergence: price makes a higher high while the oscillator makes a lower high (bearish), or price makes a lower low while the oscillator makes a higher low (bullish). It is read as a warning of a reversal.
- Hidden divergence: price makes a lower high while the oscillator makes a higher high (bearish), or a higher low with a lower oscillator low (bullish). It is read as a sign of continuation.
- Confirmation comes late: a high is only a high once later bars have stayed below it. With a five-bar rule, the signal comes five sessions after the second extreme.
- Most regular bearish divergences did not end the rise: in 80.6% of 155 cases, the second high was exceeded within 60 sessions after the confirmation.
- Little difference from the base rate in this sample: 20 sessions after the signal, the four types moved as expected about as often as an average day did; the largest gap was under two points.
What is a divergence?
A divergence in trading is a disagreement between price and an oscillator: price makes a new extreme, but the indicator does not confirm it, or the other way round.
The idea behind it is momentum. An oscillator such as the RSI, the MACD or the Stochastic measures how strong the recent moves were. If price rises to a new high but the oscillator stays lower than at the previous high, the second push came with less force. Many traders read that as a sign that the buyers are getting tired.
A divergence compares two points, not two lines. You need two price highs (or two lows) and the indicator readings on exactly those bars. A line drawn between the two price highs and a second line between the two indicator readings must start and end on the same days. If the lines point in different directions, there is a divergence.
The four types: regular and hidden, bullish and bearish
There are four combinations, and they are easy to confuse. The table shows what price and oscillator do and how each type is usually read. Regular divergences are read as reversal warnings, hidden divergences as continuation signals; the TradingView documentation on the MACD describes them the same way. Whether that reading holds in my sample is the subject of the test further down.
| Type | Price | Oscillator | Usual reading |
|---|---|---|---|
| Regular bearish | Higher high | Lower high | Uptrend losing force, possible top |
| Regular bullish | Lower low | Higher low | Downtrend losing force, possible bottom |
| Hidden bearish | Lower high | Higher high | Downtrend intact, pullback ending |
| Hidden bullish | Higher low | Lower low | Uptrend intact, pullback ending |
A simple memory aid: in a regular divergence, price makes the more extreme point. In a hidden divergence, the oscillator makes the more extreme point, while price holds a higher low or a lower high. That is why hidden divergences appear in pullbacks within a trend: price stays in its trend structure, but the oscillator swings further than price.
Regular divergences often come in series. A strong uptrend can form two or three regular bearish divergences one after the other and still keep rising. Each new high can come with a slightly lower reading while price keeps rising, and a lower oscillator high does not by itself establish a reversal. The divergence then describes a trend that is slowing, not necessarily one that is ending.
 Click to enlarge
Confirmation: when does a divergence exist?
The most common mistake with divergences is a timing mistake. On a live chart you cannot know that today’s high is the second peak of a divergence until price has fallen away from it. Drawn afterwards, a divergence always looks clear; in real time it only exists once the high is confirmed.
For a fixed rule I used the same definition as in my MACD test. A price high is a daily high that is at least as high as every high of the five sessions before and after it. A price low likewise with the lows. So a high is confirmed only five sessions after it was made, and the divergence counts from that day, not from the day of the high itself.
That confirmation has a price. In my test, at the confirmation of a regular bearish divergence the close was already 1.6% (SPY) to 2.7% (QQQ) below the second high in the median. Part of the move the divergence warns about has already happened by the time you can see it. On the bullish side the distance was larger: for regular bullish divergences the close at the confirmation was 2.3% (GLD) to 4.6% (QQQ) above the second low in the median, the other direction. If you trade divergences, decide in advance what your trigger is: the confirmation of the extreme, a break of a level, or a signal of your own.
My test: RSI divergences in SPY, QQQ and GLD
I wrote the rules down before calculating and applied them unchanged to three ETFs. SPY stands for the S&P 500, QQQ for the Nasdaq 100 and GLD for gold, with daily bars from Yahoo Finance up to October 15, 2026, price returns without dividends. The test starts on the first day for which the RSI and a 200-day average both exist: November 11, 1993 for SPY, December 21, 1999 for QQQ and September 2, 2005 for GLD.
- Indicator: RSI 14 with Wilder’s smoothing, read on the days of the two price extremes.
- Extremes: highs and lows as defined above (five sessions on each side), two neighbouring extremes 10 to 60 sessions apart.
- Signal day: five sessions after the second extreme, when it is confirmed.
- Outcome: the close 20 sessions after the signal day. For bullish types the question is whether it was higher, for bearish types whether it was lower. Comparison: every trading day of the same periods, with complete windows only.
 Click to enlarge
| RSI divergence, all three ETFs | Complete 20-session windows | Moved as expected after 20 sessions | Any trading day |
|---|---|---|---|
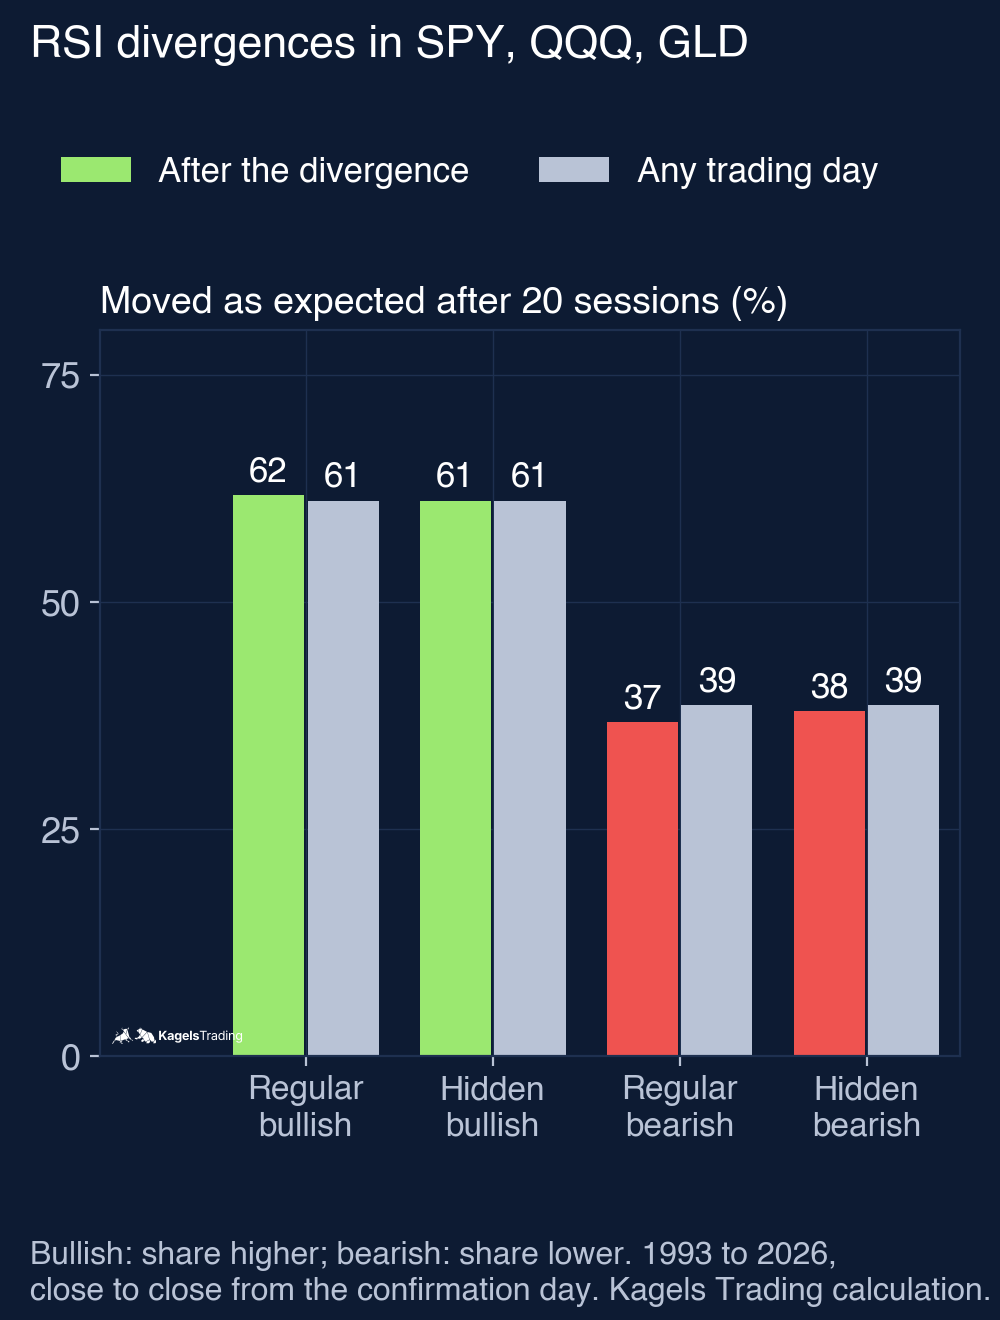
| Regular bullish (higher) | 55 | 61.8% (34) | 61.2% |
| Hidden bullish (higher) | 165 | 61.2% (101) | 61.2% |
| Regular bearish (lower) | 155 | 36.8% (57) | 38.7% |
| Hidden bearish (lower) | 71 | 38.0% (27) | 38.7% |
In this sample, the four types differed little from an average day. After a regular bullish divergence the ETF was higher 20 sessions later in 61.8% of cases, against 61.2% for any day; after a hidden bullish one in exactly 61.2%. After a regular bearish divergence it was lower in 36.8% of cases, slightly less often than on any day (38.7%). 447 divergences were detected and 446 had a complete 20-session window (one hidden bearish signal of September 29, 2026 is too recent). They overlap with each other and with the windows of neighbouring days, so these are descriptions of the sample, not proof that divergences carry no information at all.
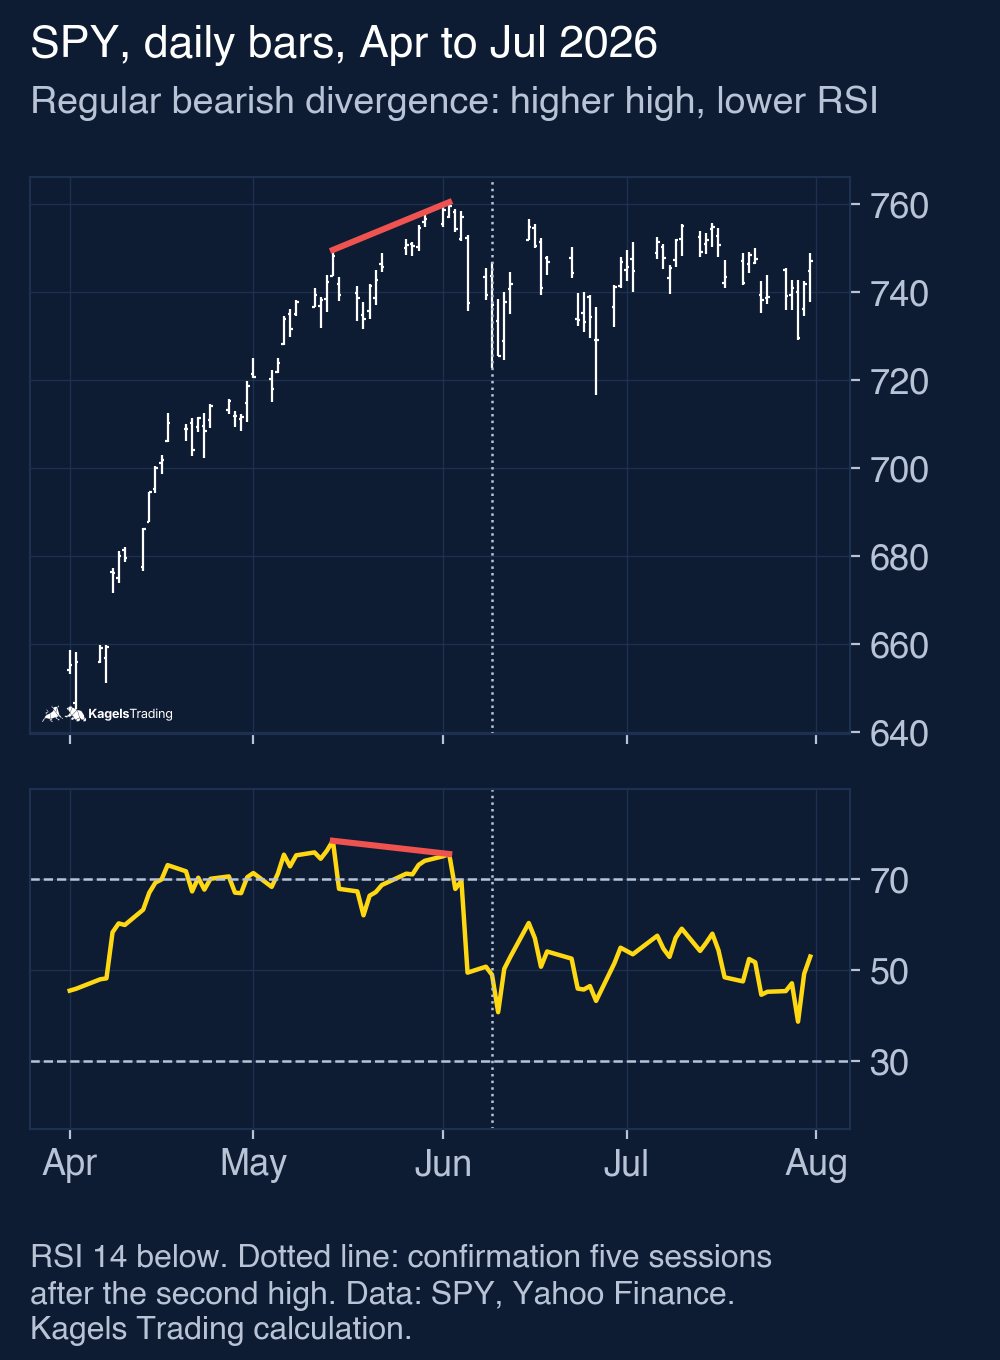
Regular bearish divergences mostly failed as a top signal. In 125 of 155 cases (80.6%), price traded above the second high within 60 sessions after the confirmation. For regular bullish divergences, the second low was undercut within 60 sessions in 32 of 55 cases (58.2%). The SPY example above is typical: the divergence of May and June 2026 was confirmed on June 9, but on August 4 SPY traded above its June 2 high. The MACD guide counted the same pattern for the S&P 500 with the MACD and came to a similar picture.
The results per ETF point in different directions, and the samples are small. In GLD, regular bearish divergences were followed by a lower price in 51.4% of cases (18 of 35), against 44.1% for any day; in SPY only in 30.4% (21 of 69), against 35.9%. Regular bullish divergences were rarer: 23 in SPY, 21 in QQQ and 11 in GLD. With a few dozen cases per ETF, differences of several points can come from a handful of trades.
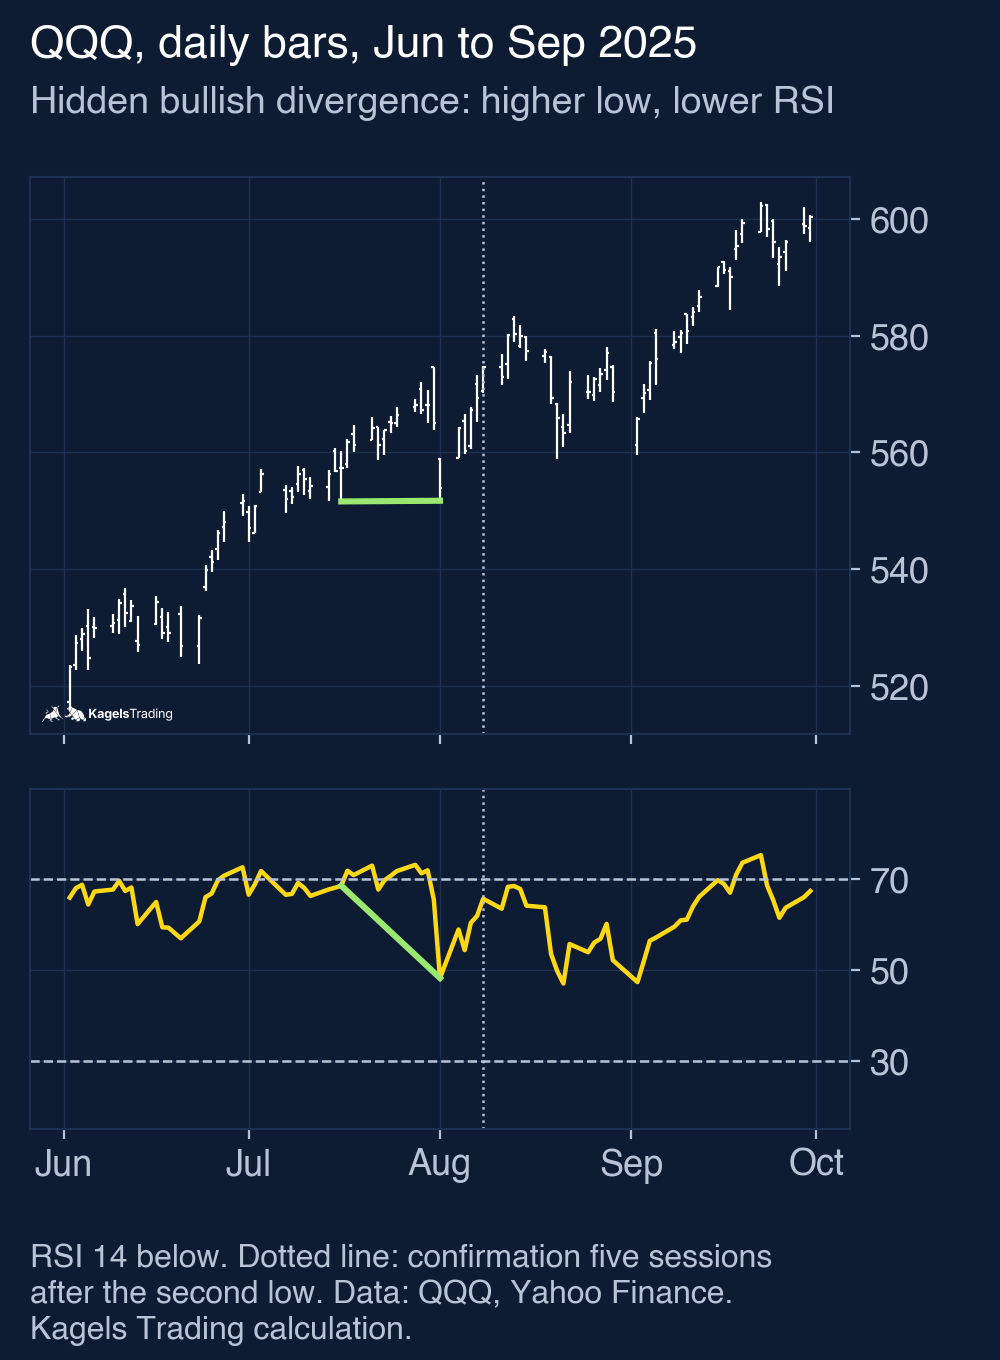
Hidden divergences moved in the trend direction about as often as an average day did. Hidden bullish divergences were the most common type, with 165 cases, and they were followed by a higher price in 61.2% of cases, the same share as any day. In an ETF that rises most of the time, a pullback that ends in a higher low is common, and the trend continues about as often as it does anyway. The QQQ example also shows a weakness of a mechanical rule: the two lows of July and August 2025 were 12 cents apart, but by the rule it was a hidden divergence.
The variants I tested
I planned three variants before calculating, and all of them are in this table. They test the most common refinements: a faster pivot rule, divergences only from the extreme zones of the RSI, and a trend filter. None of them produced a clear improvement with a reasonable number of cases.
| Variant (all three ETFs) | Regular bullish: higher | Regular bearish: lower | Hidden bullish: higher | Hidden bearish: lower |
|---|---|---|---|---|
| Main rule (5-bar extremes) | 61.8% of 55 | 36.8% of 155 | 61.2% of 165 | 38.0% of 71 |
| 3-bar extremes | 66.7% of 39 | 37.6% of 125 | 61.3% of 142 | 39.1% of 69 |
| Only from RSI below 30 / above 70 | 57.1% of 14 | 34.8% of 69 | ||
| With trend filter (200-day line) | 61.9% of 21 | 40.0% of 10 | ||
| Any trading day | 61.2% | 38.7% | 61.2% | 38.7% |
The faster pivot rule gave the best number for regular bullish divergences, on only 39 cases. That is the kind of result that tempts you to pick a setting after the fact. With 3-bar extremes, the second high was exceeded within 60 sessions in 85.6% of regular bearish cases. The classic “only from overbought or oversold” rule and the trend filter left too few cases to say anything; 14 and 10 signals are anecdotes, not statistics.
These numbers have limits. They come from one oscillator, three ETFs, daily bars and one horizon. Divergences on other indicators, other markets or intraday charts can behave differently, and a trader who combines a divergence with a clear trigger and a stop is trading a different rule. What the test shows is that, on these ETFs, the share of divergences that moved as expected over 20 sessions was close to the unconditional base rate; it does not measure trading returns, stops or targets, and without a significance test it does not prove that divergences carry no information.
Divergence with RSI, MACD and Stochastic
The idea is the same on every oscillator, but the readings are not interchangeable. The RSI and the Stochastic have a fixed scale from 0 to 100; in strong trends they can stay elevated for a long time, and a lower high on them does not establish a price reversal. The MACD has no upper limit, so its divergences depend more on how fast the averages separate.
| Oscillator | What a divergence compares | Typical trap |
|---|---|---|
| RSI | Strength of gains against losses at two extremes | Fixed scale: can stay elevated in strong trends |
| MACD | Distance between a fast and a slow average | Slow: the second high can be far from the first in time |
| Stochastic | Position of the close within the range | Very sensitive: many small divergences without meaning |
Two oscillators showing the same divergence are not two independent confirmations. The RSI, the MACD and the Stochastic are all calculated from the same prices, so their signals are not independent, even though each transforms the prices differently. The divergence of SPY in May and June 2026 showed up both in the RSI here and in the MACD in the MACD guide. Agreement between them says that the momentum pattern is clear, not that a reversal is twice as likely.
How to use divergences sensibly
If a divergence does not predict the next move on its own, use it as a reason to look, not as a reason to act. These are ideas for how to use it, not rules I tested beyond the variants above.
- As a warning, with a trigger from price: a regular divergence can be a reason to watch for a break of a level, for example the last swing low in an uptrend. The trade comes from the break, not from the divergence. Our guide to support and resistance shows how to find such levels.
- To manage an open position: a bearish divergence in a long position can be a reason to tighten a stop or take part of the profit. In my test the second high was exceeded in four out of five cases; I did not test short trades.
- With the confirmation in mind: count from the day the extreme is confirmed, not from the day of the high, and accept that part of the move is over by then.
- With a fixed risk per trade: a divergence does not make a setup more reliable; keep the risk constant. The guide to position sizing shows how.
I read divergences from price itself. As a discretionary price action trader, I look at whether a new high is reached with smaller bars, more overlap or weaker closes; the guide to price action trading describes how. An oscillator divergence often says the same thing in a different form, and the price chart tells me sooner whether the structure has really changed.
Advantages and disadvantages of divergence trading
Divergences are popular because they look convincing on a finished chart. That is both their strength and their weakness. The list draws on my test where a number is given; the rest describes how the method works.
What speaks for divergences
- A clear picture of slowing momentum: a divergence shows that a new extreme came with less force than the one before.
- Works on any oscillator and time frame: the same logic applies to the RSI, the MACD, the Stochastic and others.
- Useful for managing positions: a divergence can be a prompt to check a stop or a target in an open trade.
What speaks against divergences
- Little difference in my test: all four types moved as expected over 20 sessions about as often as an average day in this sample.
- Regular bearish divergences rarely ended the rise: in 80.6% of 155 cases the second high was exceeded within 60 sessions.
- Late confirmation: the extreme is only confirmed after several bars; for regular bearish divergences the close was already 1.6 to 2.7% below the high in the median.
- Easy to see after the fact: on a finished chart every divergence looks clear; in real time you do not know which high is the last one.
My conclusion: a description of momentum, not a forecast
A divergence describes something real: a new high or low that came with less momentum than the one before. That is useful information about the character of a move. It is not, on its own, a forecast of where price goes next.
In my test on three US ETFs over their histories, starting in 1993 for SPY, no type of RSI divergence differed much from an average day. Regular bearish divergences were followed by a new high within 60 sessions in four out of five cases, hidden divergences moved with the trend about as often as an average day did, and the refinements with fewer cases left too few signals to judge.
If you use divergences, use them as a prompt to look more closely at the price chart. Decide the trigger, the stop and the size before the trade, and do not let a convincing picture on a finished chart replace a rule.
This article is market analysis, not investment advice. Past results of a rule test do not show future results.
Frequently asked questions about divergences
What is a divergence in trading?
A divergence is a disagreement between price and an oscillator at two highs or two lows. In a regular divergence price makes the more extreme point and the oscillator does not; in a hidden divergence the oscillator makes the more extreme point while price holds its trend structure.
What is the difference between regular and hidden divergence?
A regular divergence is read as a reversal warning, a hidden divergence as a continuation signal. Regular bearish: higher price high, lower oscillator high. Hidden bullish: higher price low, lower oscillator low. In this sample, the directional frequencies of all four types were close to the unconditional base rate over the following 20 sessions.
What is a bullish divergence?
A bullish divergence forms when price makes a lower low while the oscillator makes a higher low. That is the regular form; the hidden form is a higher price low with a lower oscillator low. In my test 55 regular bullish RSI divergences in SPY, QQQ and GLD were followed by a higher price after 20 sessions in 61.8% of cases, against 61.2% for any day.
How reliable are divergences?
On their own, not reliable in my test. Regular bearish RSI divergences were followed by a lower price after 20 sessions in 36.8% of 155 cases, less often than on an average day (38.7%), and in 80.6% the second high was exceeded within 60 sessions. A divergence is a warning, not a signal.
When is a divergence confirmed?
Only when the second high or low is confirmed by the bars that follow it. With a five-bar rule, that is five sessions after the extreme. By then, for regular bearish divergences, the close was already 1.6 to 2.7% below the high in the median (2.3 to 4.6% above the low for regular bullish ones), so part of the move is over before the divergence can be seen in real time. Drawn afterwards, every divergence looks earlier than it was.
Which indicator is best for divergences?
This test does not establish which indicator is best. It covers the RSI only; the MACD guide has its own count for the S&P 500 with a similar picture. The RSI, the Stochastic and the MACD transform the same prices differently, so their divergences are not independent confirmations.
More Technical Indicators guides
- Judge a golden cross
Golden Cross: Definition and S&P 500 Test Results
How the 50-day and 200-day averages cross, and what 38 signals in the S&P 500 since 1950 did against the base rate and buy and hold.
- Judge a death cross
Death Cross: What 38 S&P 500 Signals Since 1950 Show
How deep the S&P 500 fell after 38 death crosses since 1950, how late the signal comes, and what shorting it on SPY did since 1993.
- Use moving averages
Moving Averages: SMA, EMA and a 76-Year 200-Day Test
SMA, EMA and WMA formulas with a worked example, common periods, and what the 200-day line showed on the S&P 500 since 1950.
- Trail a stop with the Supertrend
Supertrend Indicator: Settings, Strategies and an ETF Test
How the ATR-based line is calculated, common settings, five strategies, and what 654 completed flip trades in SPY, QQQ and GLD since 1993 showed.
- Read the Ichimoku Cloud
Ichimoku Cloud: The Five Lines and a US ETF Test
The five lines and the cloud, how traders read the Tenkan/Kijun cross, and what the cloud and the crosses did in SPY (since 1993), QQQ and GLD.
- Measure trend strength with the ADX
ADX Indicator: What Trend Strength Really Tells You
How +DI, −DI and the ADX are calculated, what 20 and 25 mean, and whether a high ADX meant the trend went on in SPY, QQQ and GLD.
- Read the RSI
RSI Indicator: Formula, Settings and a 75-Year Test
The RSI formula, overbought and oversold, and what RSI signals did on the S&P 500 since 1951 against the base rate.
- Read volatility with Bollinger Bands
Bollinger Bands: Settings, Squeeze and a 76-Year Test
Settings, the three typical chart situations, five strategies with rules, and what the bands and the squeeze showed on the S&P 500 since 1950.
- Set stops with the ATR
ATR Indicator: Average True Range for Stops and Size
True range and Wilder smoothing, stop distance and position size, and how ATR stops behaved on SPY from 1994 to 2026 against a fixed stop.
- Trade Donchian breakouts
Donchian Channel: Breakout Rules and a 20-Year ETF Test
Channel rules, the current-bar pitfall, the Turtle systems, and what 499 breakout trades in SPY, GLD and TLT from 2006 to 2026 showed.
- Read the Stochastic
Stochastic Oscillator: Settings, Signals and a 30-Year Test
The %K and %D formula, what 14, 3, 3 means, fast versus slow, and what 785 oversold signals in SPY, QQQ and GLD did against the base rate.
- Read the MACD
MACD Indicator: Histogram, Divergence and a 31-Year Test
Formula, histogram, crossovers and divergences, with a 31-year test on the S&P 500 and the DAX against the base rate.
- Use VWAP
VWAP Indicator: Formula, Anchored VWAP and TradingView Setup
The VWAP formula, trend day versus range day, Anchored VWAP and the right settings in TradingView.