
VWAP Indicator: Formula, Anchored VWAP and TradingView Setup


Contents
- VWAP in 30 seconds
- What is VWAP (volume weighted average price)?
- How to calculate VWAP: formula and worked example
- Trend day or range day: what VWAP shows on the chart
- Our test: how reliable is the side of VWAP?
- VWAP trading: three strategies and the VWAP bands
- Anchored VWAP: VWAP from a point you choose
- How to set up VWAP in TradingView
- Pros and cons of VWAP
- Conclusion: VWAP is a reference line, not a signal
- Frequently asked questions about VWAP
- About the author
VWAP shows you the price at which most of today’s money actually changed hands. A moving average treats every candle the same. The volume weighted average price, by contrast, weights each price by the volume traded there. That is why funds measure their order execution against this line, and why it is built into almost every charting platform.
Here you get the formula with a real worked example, two annotated charts and our own test on 720 trading days. You also get the Anchored VWAP, which you can attach to any point on the chart, and the right settings in TradingView. This article follows our editorial policy.
VWAP in 30 seconds
- Definition: VWAP (volume weighted average price) is the average price of all trades in a session, weighted by the volume traded at each price.
- Formula: the sum of typical price times volume, divided by total volume. The typical price is (high + low + close) / 3, in TradingView the default source hlc3.
- How to read it: price above VWAP means today’s buyers are in profit on average; price below means they are at a loss. That describes the situation; it is not a buy signal.
- Our test: in SPY, the side of VWAP after two hours of trading matched the side at the close on 58 percent of 720 days, after four hours on 69 percent.
- Anchored VWAP: it starts not with the session but at a point you choose, such as a yearly low. The idea goes back to the physicist Paul Levine.
- Limit: without real volume, VWAP is inaccurate or not available. Forex often has only tick volume, and TradingView shows no volume for most indexes.
- Verdict: use it as a reference line for trend day or range day. The entry comes from price action.
What is VWAP (volume weighted average price)?
VWAP (volume weighted average price) is the average price of all trades in a trading session, with each price weighted by the volume traded at it. It starts fresh with each session and shows the price at which the market traded on average that day.
Two things set it apart from a moving average. It needs no lookback period like 20 or 50 days, because it starts at zero with each session and adds up until the close. And it weights by volume: a candle with ten times the volume pulls the line ten times as hard. Do not confuse it with the VWMA, the volume weighted moving average, which is calculated over a fixed number of candles.
Where VWAP comes from: a yardstick for large orders
VWAP was not invented as a chart indicator but as a benchmark for execution. According to Wikipedia, the first execution against VWAP is generally attributed to James Elkins, then head trader at the New York brokerage Abel Noser, who used it in 1984 for the Ford pension fund. In 1988, Berkowitz, Logue and Noser made it the yardstick for transaction costs on the New York Stock Exchange in the Journal of Finance.
Funds still check their brokers against this line today. If a pension fund buys below the day’s VWAP, the execution was good; if it buys well above it, it was too expensive. Interactive Brokers offers a VWAP algo for this that aims for the VWAP from the time you submit the order until the close. The guaranteed VWAP order it used to offer is, according to IBKR, no longer supported.
For you as a trader, this has a practical consequence. Anyone who measures a large order against VWAP does not want to buy well above it. The line is therefore a price level that many market participants watch at the same time.
How to calculate VWAP: formula and worked example
The calculation has five steps. The TradingView help page on VWAP describes it the same way, with the typical price and a running sum:
- Take the typical price of each candle: (high + low + close) / 3.
- Multiply the typical price by the volume of the candle.
- Add up these products since the start of the session.
- Add up the volume since the start of the session.
- Divide the first sum by the second. The result is the VWAP.
VWAP = sum (typical price × volume) / sum of volume
The example shows why volume carries so much weight. The graphic below works through the first five 5-minute candles of SPY on August 4, 2026, the ETF that tracks the S&P 500. The first candle at 09:30 New York time (ET) traded 2.40 million shares, the next four only 3.21 million together.
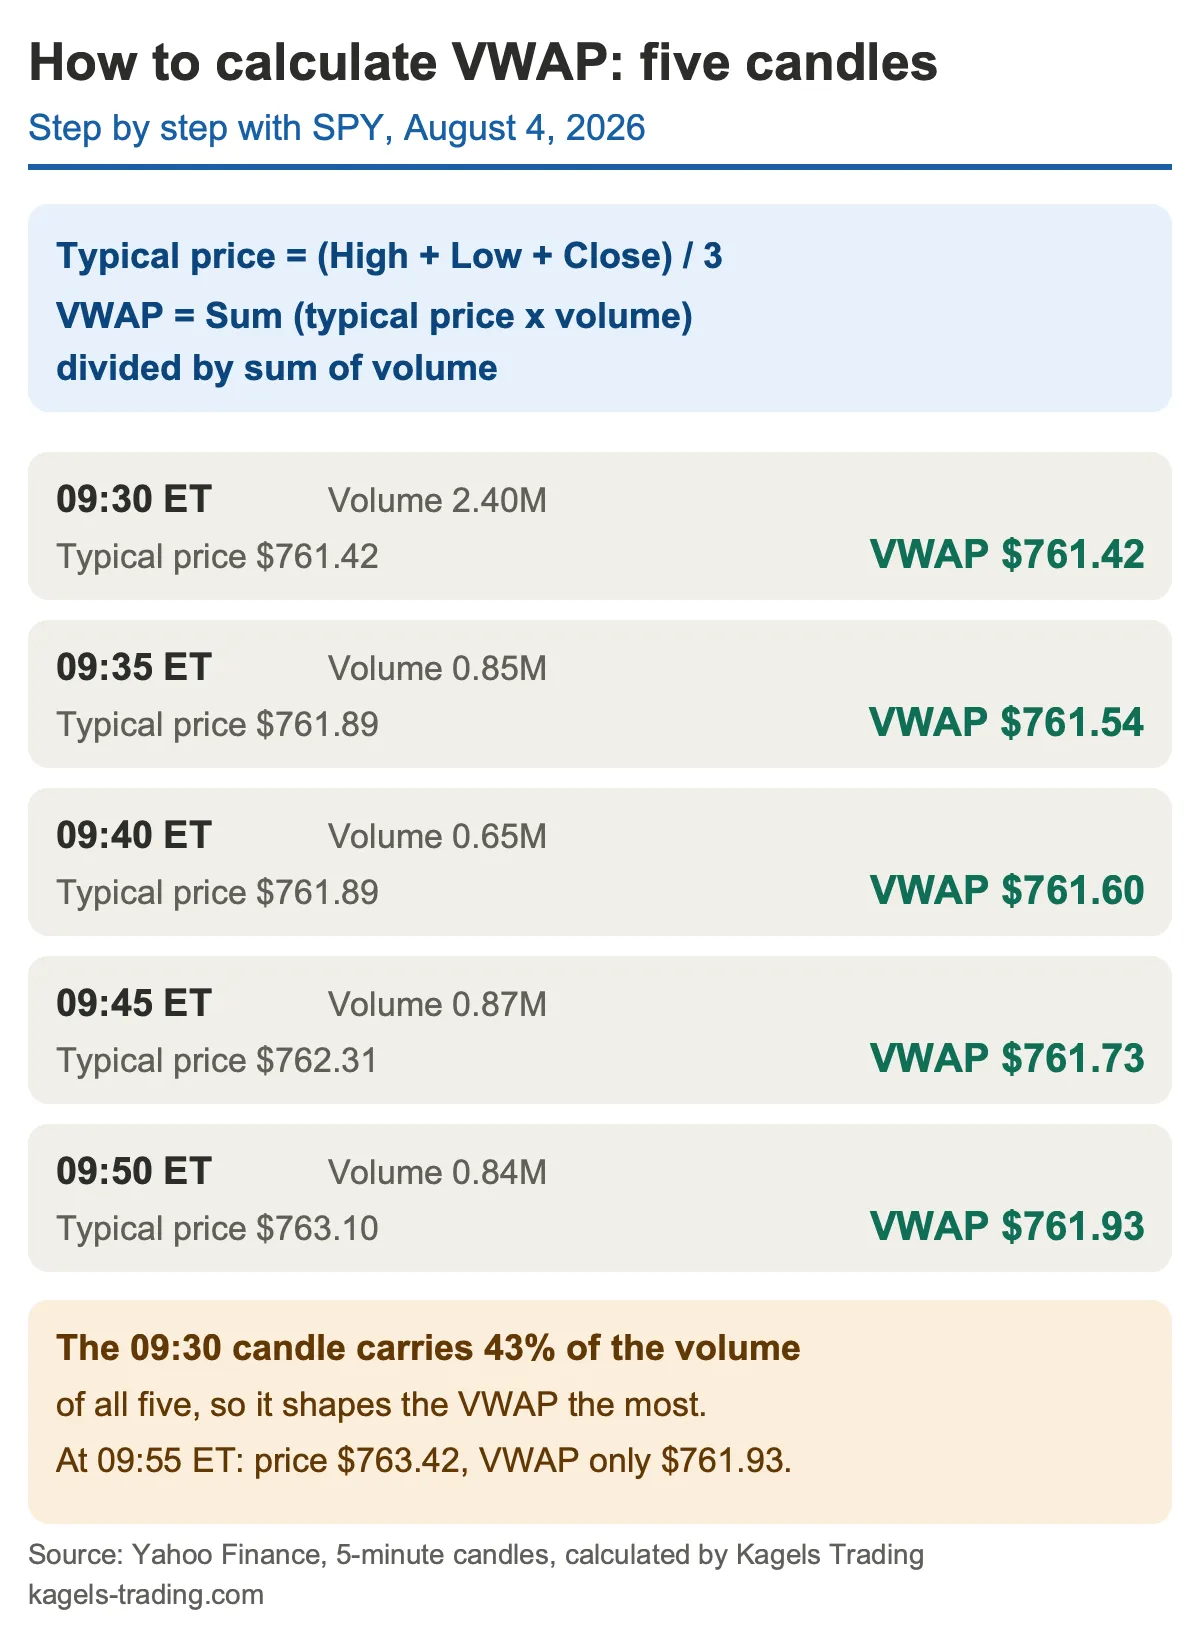 How to calculate VWAP: the first five candles of SPY on August 4, 2026. Our own calculation from Yahoo Finance data.
The opening candle carries 43 percent of the volume and shapes the VWAP accordingly. By 09:55 ET, the price had risen to $763.42, the VWAP only to $761.93. This inertia grows during the day: each new candle is only a small part of the total volume so far, so in the afternoon VWAP hardly reacts to new prices at all.
Trend day or range day: what VWAP shows on the chart
The most important question in the morning is: is today a trend day, or is the market going sideways? VWAP gives a visible answer because it shows where price stands relative to the day’s average. Both charts come from the same month and the same market, SPY on the 5-minute chart. The entry still comes from price action.
Trend day: price stays on one side
On August 4, 2026, every one of the 78 five-minute candles closed above VWAP. SPY opened at $760.63 and closed at $771.28, a daily range of $12.89. VWAP rose from the first candle to the last and stood at $769.01 at the close. This is what a trend day looks like: today’s buyers are in profit almost all day and have no reason to sell. The chart below shows the day with VWAP in orange and the VWAP bands in teal.
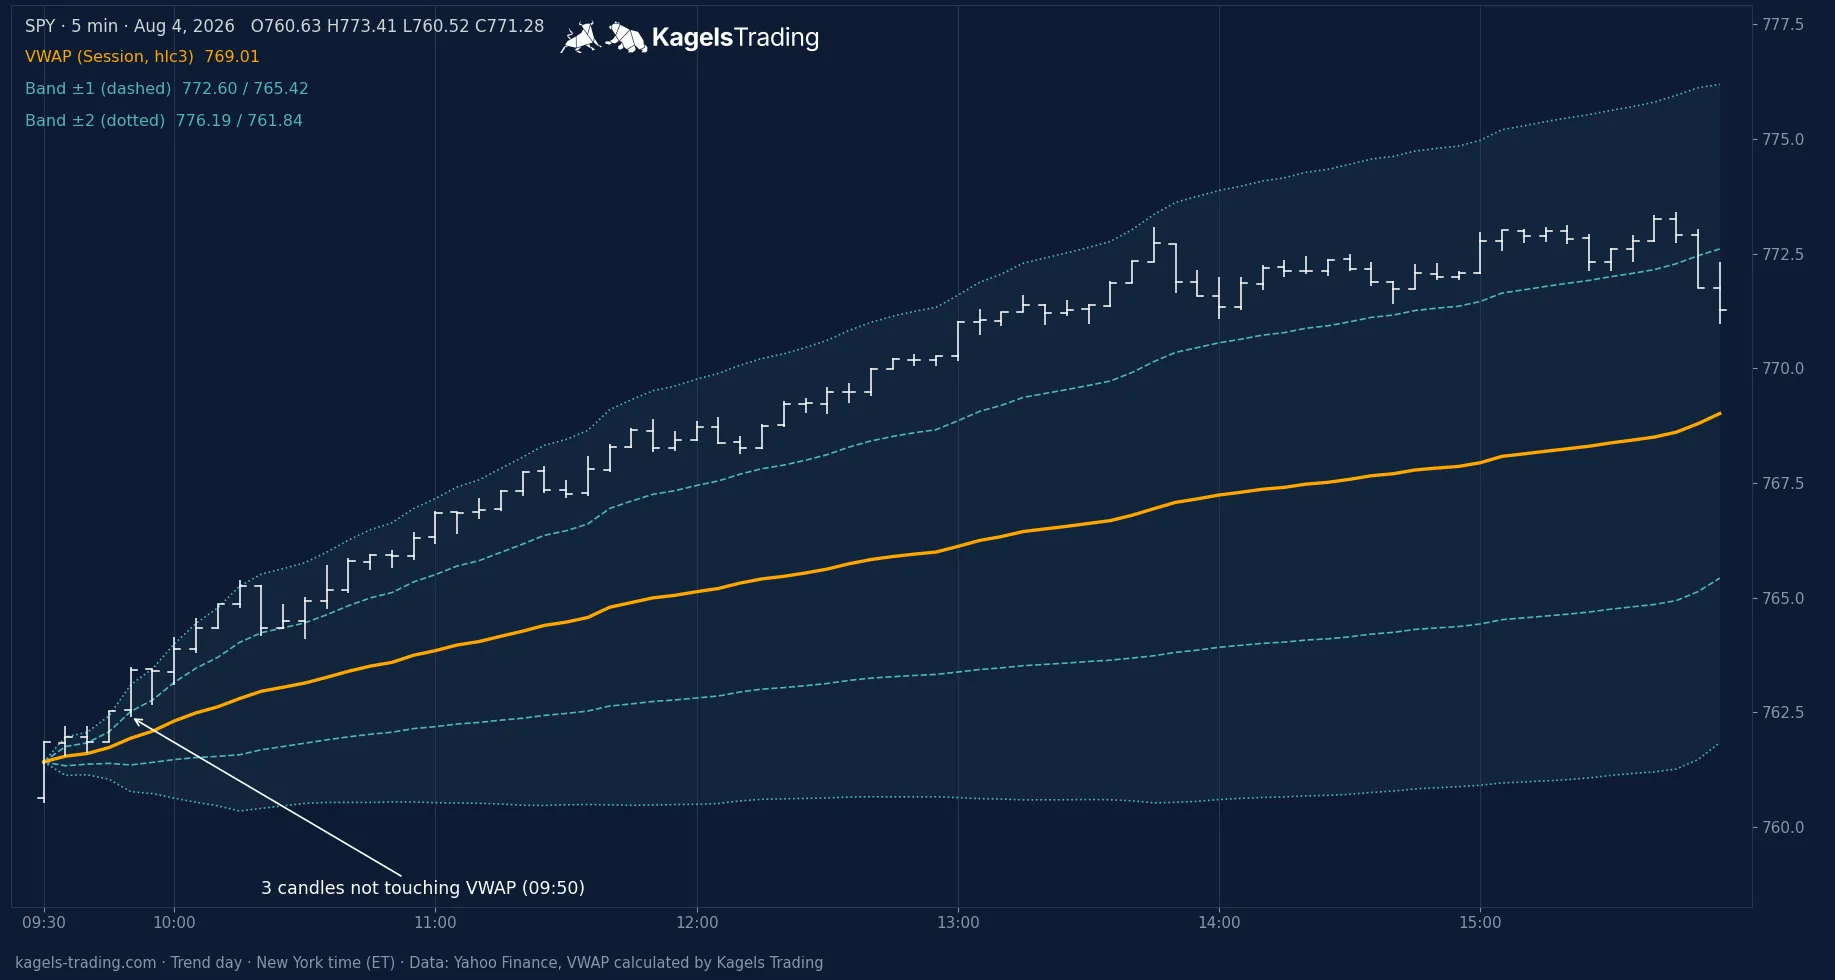 Trend day on August 4, 2026: all 78 closes above VWAP, first price thrust at 09:50 ET. VWAP in orange, bands at one and two standard deviations in teal.
Range day: zigzag around the line
Two weeks later, the same market looked completely different. On August 18, 2026, the close of the 5-minute candles crossed VWAP 22 times, and the daily range was only $2.58. From 10:30 ET to the close, VWAP moved within a range of just 58 cents. This is a typical range day: the line acts like a magnet, and price keeps coming back to it. The chart below shows the day with the same settings.
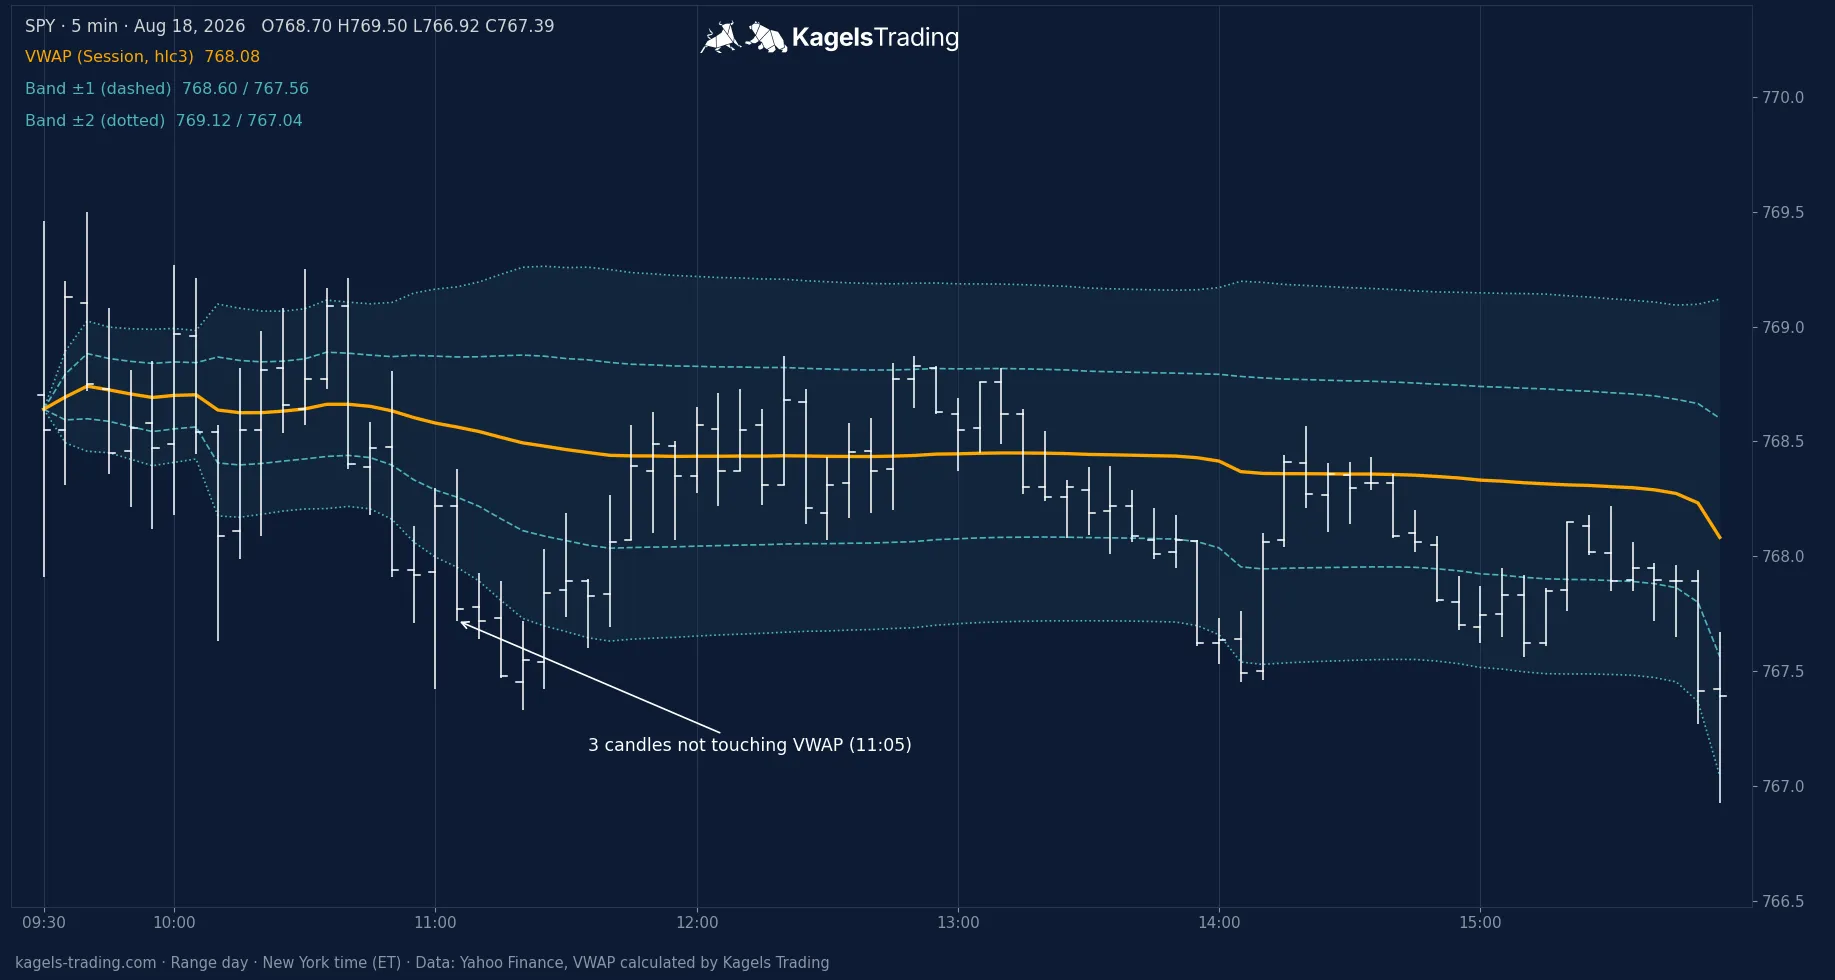 Range day on August 18, 2026: 22 crossings, VWAP runs almost flat. First price thrust at 11:05 ET, back at VWAP at 11:45 ET.
The slope of the line also tells you something. On the trend day, VWAP pointed up without a break. On the range day, it was practically flat after an hour. A flat line means buyers and sellers trade at the same average price, and neither side is in control.
The price thrust method: three candles away from VWAP
A simple rule to classify the day early comes from Galen Woods. The price action trader describes it in his guide to VWAP. It has two steps:
- Spot the price thrust: look for at least three consecutive candles that do not touch VWAP.
- Check for follow-through: if the thrust continues, a trend day is likely, and price action setups in the direction of the trend have a tailwind. If price is pulled back to VWAP, that points to a range day and to trades back to the mean.
Both charts mark the first price thrust. On the trend day it came at 09:50 ET to the upside and kept going. On the range day it came only at 11:05 ET to the downside, and at 11:45 ET price reached VWAP again. Exactly this return is the mark of a range day.
VWAP itself is of little use for the entry. Anyone waiting for a pullback to the line on the trend day would never have got in: after 09:35 ET, not a single low reached VWAP again. A better entry comes from a setup for strong trends, such as a one-candle pullback with a volatility stop.
With this method, the open is waiting time. At the start of trading, candles and VWAP almost always overlap because the line is just forming. That matches the common advice to wait out the first 30 minutes. VWAP does not turn this into a rigid rule, though: if the price thrust comes as early as 09:50 ET, as on August 4, the wait can be shorter.
Our test: how reliable is the side of VWAP?
Whether price is above or below VWAP is often sold as a trend signal. We checked how much this position says about the rest of the day. The basis is 720 full trading sessions of SPY from October 20, 2023, to September 18, 2026, in 60-minute candles from Yahoo Finance. Seven half-day sessions and three days with a missing hourly candle are left out. We counted how often price at the close was on the same side of VWAP as after a given amount of trading time.
| Time | Same side at the close | Days |
|---|---|---|
| after 2 hours | 58.2% | 419 of 720 |
| after 3 hours | 63.1% | 454 of 720 |
| after 4 hours | 69.0% | 497 of 720 |
Source: Yahoo Finance, SPY 60-minute candles, VWAP and count calculated by Kagels Trading.
After two hours, the position relative to VWAP is barely better than a coin toss. 58 percent means that on a little over four days out of ten, price still changed sides by the close. Only in the afternoon does the signal become more reliable, and by then most of the day’s move has already happened.
Real trend days are the exception. In the last 60 trading days, measured on the 5-minute chart, at least 90 percent of the closes were on one side of VWAP on only 17 days. The price thrust rule by Galen Woods triggered on all 60 days. On 37 of them, or 62 percent, the day closed on the side of the first thrust.
VWAP describes a day reliably, but it cannot predict it. The entry decision therefore belongs to price action, not to the line. The test covers one very liquid US ETF and almost three years. Other markets and other periods can give different numbers, but the order of magnitude is clear.
VWAP trading: three strategies and the VWAP bands
The two day types lead to three ways of trading with VWAP. None of them is a complete system. Each one needs an entry from price action and a stop-loss.
1. Trend day: with VWAP at your back
If price stands clearly above a rising VWAP after a price thrust, you look only for long setups. A short sale against this day would be a trade against everyone who bought today and is in profit. With a falling VWAP, the same applies the other way round, and short setups are the better choice.
2. Range day: back to the line
If price swings around a flat VWAP, the line becomes the price target. This idea is called mean reversion: when price moves far from the average, you bet on its return. On August 18 this would have worked several times, on a trend day like August 4 not once.
3. Reclaiming the line
Price that reclaims VWAP from below and holds above it shows a change of control. Anyone who sold short before is now at a loss. The confirmation comes from the first pullback that holds above the line, not from the breakout itself.
VWAP bands: making the distance measurable
VWAP bands are lines above and below VWAP at a distance of one or more standard deviations. You can think of them like Bollinger Bands with VWAP as the middle line. The two charts above show the first and second band.
- Trend strength: on the trend day, 72 of the 78 closes were between the first and second upper band.
- Taking profits: price at the second band is stretched far, a reason to take profits.
- Entry in a range: from the edge of the bands back to the middle, similar to Bollinger Bands.
Automated testing
Because VWAP is pure arithmetic, it suits trading algorithms well. One example is the VWAP day trading strategy by algorithmictrading.net; the study “VWAP Strategies” by Ananth Madhavan looks at how large orders are executed. How to test such rules yourself is explained in our TradingView backtesting guide, with the strategy report and Bar Replay.
Anchored VWAP: VWAP from a point you choose
Anchored VWAP (AVWAP) is a VWAP that starts not with the trading session but at a point you choose on the chart. It shows the volume weighted average price of all trades since that event.
The idea is older than its name. According to TradingView, the physicist Paul Levine developed the tool between 1995 and 1997 as part of his MIDAS approach, building on the work of the trader Kevin Haggerty. Later it was made known above all by Brian Shannon and the CMT Association.
Its use lies in one simple question: how are all those who bought since this event doing? If price is above the Anchored VWAP, they are in profit on average; if it is below, they are at a loss. Anyone at a loss likes to sell as soon as they are back to break-even. That is why the AVWAP often acts as support or resistance.
Good anchor points
- Major highs and lows: the point where the last big move began.
- Gaps and news: quarterly earnings, rate decisions, a gap up or down.
- IPO: the first trading day of a stock. The line then shows the average price of all shareholders since the IPO.
- Time boundaries: the start of a week, month or year, which TradingView also offers as a fixed anchor period.
Example: two anchors on the SPY daily chart
The chart sets two anchors. The green AVWAP starts at the low of April 7, 2025, at $481.80, the red one at the high of August 13, 2026, at $779.37, the highest price in the period shown. The graphic below shows both lines on the daily chart.
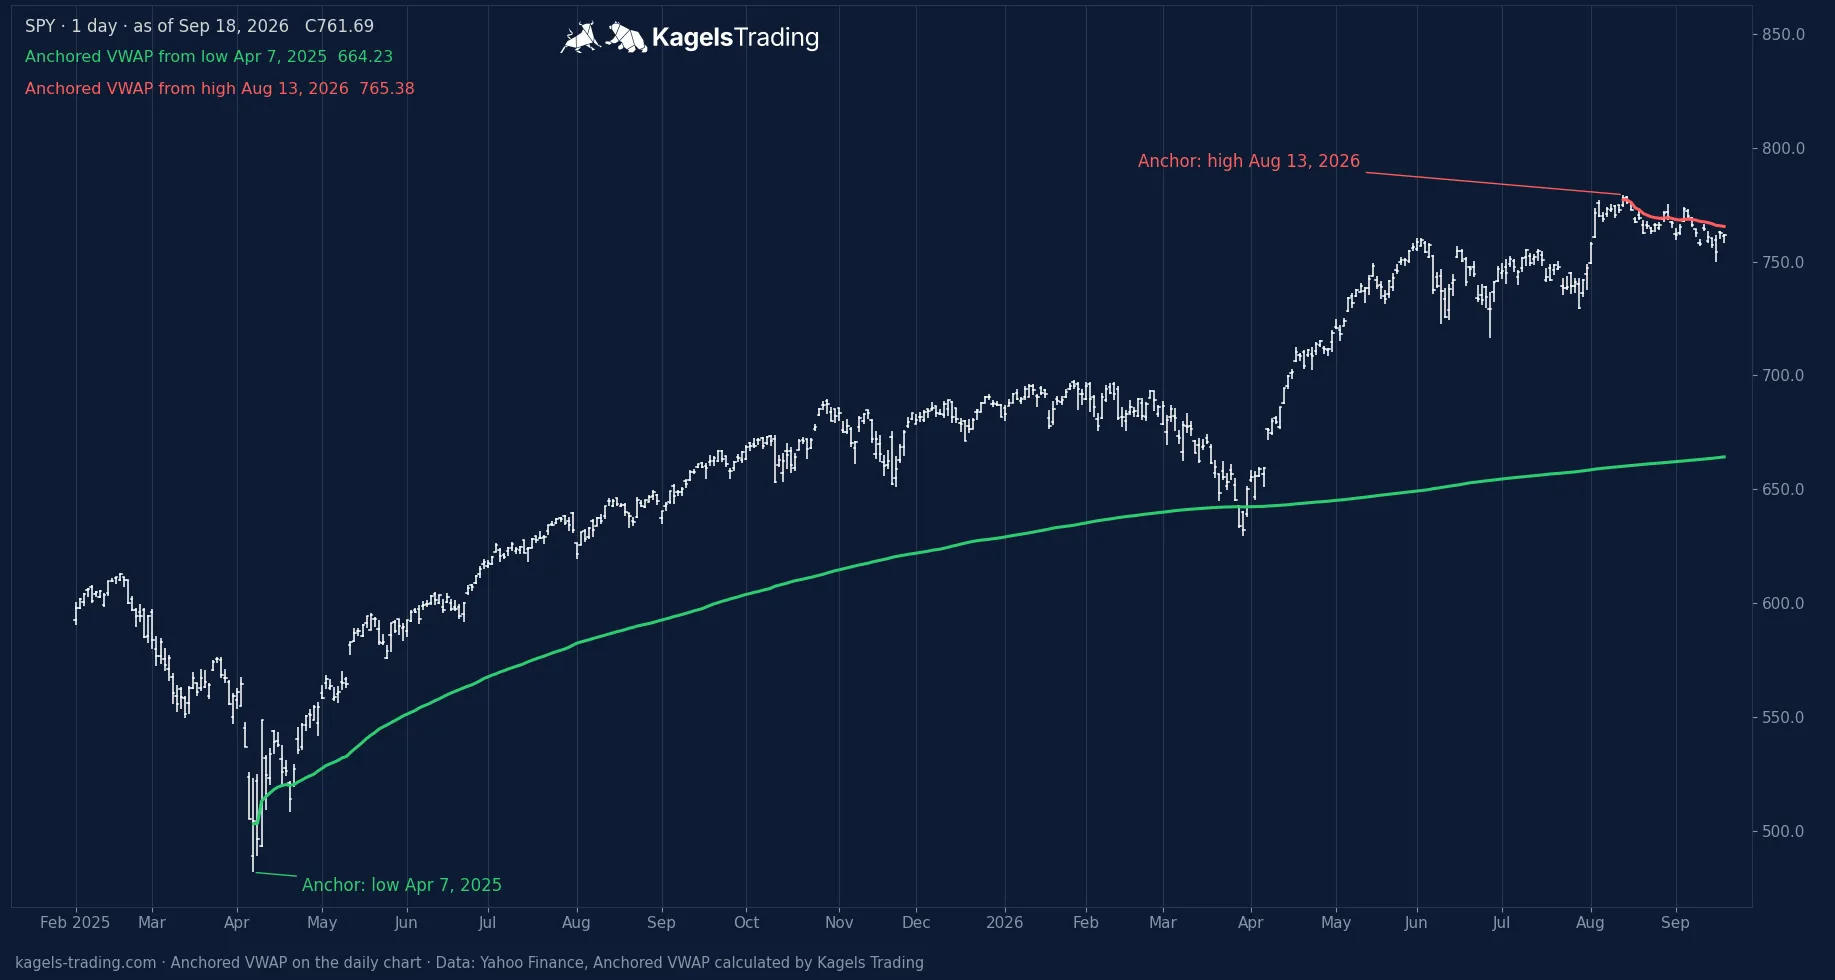 Anchored VWAP: green from the low of April 2025, red from the high of August 2026, as of September 18, 2026. Our own calculation from Yahoo Finance data.
The green anchor has held for a year and a half. Of 365 closes since the low, only four were below it, two of them in the two weeks after the low. In March 2026, SPY slipped to $629.28, about 2 percent below the line, closed below it on March 27 and 30, and then came back. On September 18, 2026, the green AVWAP stood at $664.23.
The red anchor shows the other side. Those who bought since the high paid $765.38 on average. SPY closed at $761.69 on September 18 and thus below it; only five of the 26 closes since the high were above this line. That is not a forecast but a description of which group of buyers is currently under pressure. Our view on the index itself is in the S&P 500 forecast.
How to set an Anchored VWAP in TradingView
In TradingView, the Anchored VWAP is a drawing tool, not an indicator. You find it in the left toolbar, click on the candle where the calculation should start, and the line appears from that point. You change color and line width with a double click on the line.
If you want to go deeper, there are two books in English. “MIDAS Technical Analysis” by Andrew Coles and David G. Hawkins (Wiley, 2011) explains the method from which the Anchored VWAP came. Brian Shannon’s “Maximum Trading Gains With Anchored VWAP” shows it in use on many charts. Both assume basic knowledge of volume and trends and are too specialized for beginners.
How to set up VWAP in TradingView
You add VWAP in TradingView through the indicator search, where it is simply called “VWAP”. The table sums up the most important settings from the TradingView help page linked above. What else the platform offers, including all plans, is in our TradingView review.
| Setting | Default | Effect |
|---|---|---|
| Anchor period | Session | when the line restarts |
| Source | hlc3 | typical price |
| Bands | optional | distance from VWAP |
| Hide on 1D or above | option | no line on the daily chart |
The anchor period is the setting that changes the most. With Session you get the classic daily VWAP for the intraday chart. With Week or Month it becomes a VWAP for swing traders that also works on the hourly or daily chart. On the daily chart with Session, by contrast, the line restarts with every candle and is useless, as TradingView itself points out. The anchor period also offers Quarter, Year, Decade and Century, as well as a restart on earnings, dividends or stock splits.
You calculate the bands as a standard deviation or as a percentage. Up to three bands can be shown, each with its own multiplier. The default source is hlc3, the typical price; hl2 is the common alternative. The option Hide VWAP on 1D or Above makes sure the session VWAP does not appear on the daily chart at all.
What are you trading, and on which chart?
- Day trading on a 1- to 15-minute chartVWAP with anchor period Session
- Swing trading on the hourly or daily chartVWAP with anchor period Week or Month
- Measuring buyers since a high, low or news eventAnchored VWAP drawing tool
- Forex, an index or a CFDCheck the volume first, or use a future or ETF
- Classifying the day earlyPrice thrust: three candles away from VWAP
The settings are TradingView's own; the choice per trading style is our recommendation.
No volume, no VWAP: forex, indexes, CFDs
VWAP is only as good as the volume data behind it. In its help on volume data, TradingView writes that forex pairs and CFDs from some providers have no volume at all and that most indexes show none. In some cases only tick volume is available, meaning the number of price updates, not the number of shares or contracts traded. What the volume figure counts in stocks, futures, forex and crypto is explained in our guide to volume analysis.
For index traders, this means: use the future or an ETF. For the S&P 500, you are on the safe side with SPY or the Micro E-mini S&P 500 future. That is why this article shows SPY and not the index. In forex, VWAP remains an approximation, because there is no central exchange that records all trades.
Other platforms
Almost all charting programs offer VWAP. In NinjaTrader 8 it is part of the order flow tools. In ATAS, too, it belongs to the order flow tools; more on ATAS in our comparison of TradingView alternatives.
Pros and cons of VWAP
VWAP has real strengths because it needs no parameters and includes volume. Its weaknesses lie in timing and in data quality.
What speaks for VWAP
- No parameters: there is no period length to optimize. Every trader sees the same line.
- Volume included: prices with high volume count more than prices with little. A simple average cannot do that.
- Common reference point: funds and brokers measure their execution against it, so the line is a watched price level.
- Flexible: with the anchor period and the Anchored VWAP, it works from the 5-minute chart to the daily chart.
Where VWAP reaches its limits
- Slow in the afternoon: the longer the session runs, the less the line reacts to new prices.
- No entry signal: after two hours, the position relative to VWAP matched the close on only 58 percent of days in our test.
- Needs real volume: in forex, CFDs and many indexes, the data is missing or is only tick volume.
- Nothing to say at the open: in the first minutes, VWAP is almost identical to price and says nothing yet.
Conclusion: VWAP is a reference line, not a signal
VWAP shows the average price at which the market traded today, and whether you are on the expensive or the cheap side. On a trend day, price stays on one side; on a range day, it swings around the line. Our test on 720 trading days also shows the limit: after two hours, the position relative to VWAP tells you on only 58 percent of days on which side the market will close.
My view as a price action trader: VWAP does not replace a look at price action. But it tells you in one second whether you are buying on the expensive or the cheap side of the day, and too few day traders ask themselves that question before they click.
The Anchored VWAP asks the same question for any starting point you like. It shows whether the buyers since a low, a high or a news event are in profit or at a loss. In both cases, the entry comes from price action.
Frequently asked questions about VWAP
What does VWAP tell you?
VWAP shows the volume weighted average price of the current session. If price is above it, today’s buyers are in profit on average; if it is below, they are at a loss. That is not a buy signal but a description of the situation.
How do you calculate VWAP?
For each candle, take the typical price, (high + low + close) / 3, and multiply it by the volume. The sum of these products since the start of the session is divided by the total volume. The result is the VWAP.
What is the Anchored VWAP?
The Anchored VWAP is a VWAP that starts at a point you choose, such as a high, a low or an IPO. It shows whether all buyers since that event are in profit or at a loss on average. In TradingView, it is a drawing tool.
Which VWAP settings make sense in TradingView?
For intraday trading, the anchor period Session with the source hlc3, which is the default. For swing trading, the anchor period Week or Month fits. On the daily chart with Session, VWAP is useless because it restarts with every candle.
Is VWAP a good indicator?
VWAP is a good reference line but a weak signal on its own. In our test on 720 trading days of SPY, the side of VWAP after two hours matched the side at the close on only 58 percent of days. It helps you read the day and your entry price, while the entry itself should come from price action.
Which time frame is best for VWAP?
The classic session VWAP works best on intraday charts, typically from one to 15 minutes. For the hourly or daily chart, switch the anchor period to Week or Month, or use an Anchored VWAP from a major high or low.
Is VWAP better than an EMA?
They answer different questions. An EMA weights recent prices more heavily over a fixed period, while VWAP weights by volume and restarts each session. For day trading, VWAP shows where today’s money traded; for trends over several days, a moving average or an Anchored VWAP is the better tool.
Does VWAP work in forex?
Only to a limited extent. Forex has no central exchange, so many data feeds provide only tick volume, the number of price changes. VWAP is then an approximation, and with some providers the volume is missing entirely.
When is VWAP most meaningful?
When price has moved away from VWAP with at least three candles. At the open it says nothing yet, and in our test on SPY, the side after two hours matched the close on 58 percent of days, after four hours on 69 percent.
This article was written by Karsten Kagels, a discretionary price action trader who trades without technical indicators, and was finally reviewed by Christian Möhrer. The test is based on 720 trading sessions of SPY. This is educational content, not investment advice.
This article is translated from the German edition on kagels-trading.de.
More Technical Indicators guides
- Judge a golden cross
Golden Cross: Definition and S&P 500 Test Results
How the 50-day and 200-day averages cross, and what 38 signals in the S&P 500 since 1950 did against the base rate and buy and hold.
- Judge a death cross
Death Cross: What 38 S&P 500 Signals Since 1950 Show
How deep the S&P 500 fell after 38 death crosses since 1950, how late the signal comes, and what shorting it on SPY did since 1993.
- Use moving averages
Moving Averages: SMA, EMA and a 76-Year 200-Day Test
SMA, EMA and WMA formulas with a worked example, common periods, and what the 200-day line showed on the S&P 500 since 1950.
- Trail a stop with the Supertrend
Supertrend Indicator: Settings, Strategies and an ETF Test
How the ATR-based line is calculated, common settings, five strategies, and what 654 completed flip trades in SPY, QQQ and GLD since 1993 showed.
- Read the Ichimoku Cloud
Ichimoku Cloud: The Five Lines and a US ETF Test
The five lines and the cloud, how traders read the Tenkan/Kijun cross, and what the cloud and the crosses did in SPY (since 1993), QQQ and GLD.
- Measure trend strength with the ADX
ADX Indicator: What Trend Strength Really Tells You
How +DI, −DI and the ADX are calculated, what 20 and 25 mean, and whether a high ADX meant the trend went on in SPY, QQQ and GLD.
- Read the RSI
RSI Indicator: Formula, Settings and a 75-Year Test
The RSI formula, overbought and oversold, and what RSI signals did on the S&P 500 since 1951 against the base rate.
- Read volatility with Bollinger Bands
Bollinger Bands: Settings, Squeeze and a 76-Year Test
Settings, the three typical chart situations, five strategies with rules, and what the bands and the squeeze showed on the S&P 500 since 1950.
- Set stops with the ATR
ATR Indicator: Average True Range for Stops and Size
True range and Wilder smoothing, stop distance and position size, and how ATR stops behaved on SPY from 1994 to 2026 against a fixed stop.
- Trade Donchian breakouts
Donchian Channel: Breakout Rules and a 20-Year ETF Test
Channel rules, the current-bar pitfall, the Turtle systems, and what 499 breakout trades in SPY, GLD and TLT from 2006 to 2026 showed.
- Read the Stochastic
Stochastic Oscillator: Settings, Signals and a 30-Year Test
The %K and %D formula, what 14, 3, 3 means, fast versus slow, and what 785 oversold signals in SPY, QQQ and GLD did against the base rate.
- Judge a divergence
Divergence Trading: Regular and Hidden Divergence Tested
Regular and hidden, bullish and bearish divergences, when they are confirmed, and what 447 RSI divergences detected in SPY, QQQ and GLD did against the base rate.
- Read the MACD
MACD Indicator: Histogram, Divergence and a 31-Year Test
Formula, histogram, crossovers and divergences, with a 31-year test on the S&P 500 and the DAX against the base rate.