
Hindenburg Omen: What 21 Signal Clusters Since 2017 Show


Contents
- Hindenburg Omen in 30 seconds
- What is the Hindenburg Omen?
- How the Hindenburg Omen is calculated
- How I tested the Hindenburg Omen
- What followed the clusters
- Every cluster since 2017, including the false alarms
- Is the Hindenburg Omen active now?
- How I use the Hindenburg Omen
- Conclusion: a warning light, not a sell signal
- Frequently asked questions about the Hindenburg Omen
- About the author
Whenever the Hindenburg Omen fires on Wall Street, a crash headline is rarely far away. The indicator measures a state that most numbers miss: an index still rises, but underneath it the single stocks pull apart. Many of them make new 52-week highs, and at the same time many others make new 52-week lows. The chart looks healthy while the market is split.
This guide shows how the signal is calculated and why different trackers report different dates. I also tested what followed the 21 signal clusters of one public tracker since 2017, against any trading day, and listed every false alarm. The current reading is dated November 6, 2026. This article follows our editorial policy.
Hindenburg Omen in 30 seconds
- What it measures: the Hindenburg Omen fires when many stocks make new 52-week highs and new 52-week lows on the same day while the market is still in an uptrend.
- Four daily conditions in the most common modern version: highs and lows each above 2.2% of issues, an uptrend filter, a negative McClellan Oscillator, and new highs no more than twice the new lows. Most trackers want a second trigger within about a month as confirmation.
- No single rule set: the creator Jim Miekka described 2.8%, a 50-day trend test and a signal that stays valid for 30 trading days while the oscillator is negative; trackers use other thresholds, universes and confirmation rules, so their dates differ.
- My test: after 20 complete clusters since 2017, SPY traded at least 10% lower within six months in 35% of cases, against 23.7% for any day. The median six-month return was still +5.0%.
- Today: on November 6, 2026 the omen was inactive. Only one of four conditions held; the last trigger came on August 17, 2026.
What is the Hindenburg Omen?
The Hindenburg Omen is a market breadth indicator that warns when an uptrending stock market shows unusually many new 52-week highs and new 52-week lows on the same day.
Market breadth describes how many stocks actually carry an index move. An index can rise because most of its members rise. It can also rise because a few heavyweights dominate the calculation while the rest falls. The omen looks for that second case, a split market, in the counts of new highs and new lows. On a stock heatmap the same split shows up as a few large green tiles in a mostly grey field.
The indicator is credited to Jim Miekka, and Tom McClellan dates it to 1995. McClellan, who publishes the McClellan Oscillator, writes that Miekka meant it as an improvement on Gerald Appel’s Split Market Sell Signal; StockCharts’ ChartSchool dates it to the 1980s. Miekka was a former high school physics teacher who lost his sight after an explosion during an experiment. He died in August 2014 at the age of 54, when an SUV struck him in Maine while he was walking with his guide dog, as CNBC reported.
The name refers to the airship disaster of May 6, 1937. The Hindenburg caught fire while landing at Lakehurst, New Jersey, in a moment that looked like routine. That image explains a good part of the indicator’s media career, and also why every new signal produces a wave of crash headlines.
How the Hindenburg Omen is calculated
In the version most trackers use today, a trigger needs all four conditions on the same trading day. The table shows that modern version; Miekka’s own rules worked differently, as the next sections explain. The classic universe is the New York Stock Exchange; modern trackers often count a broader universe of US common stocks.
| Condition | Common rule |
|---|---|
| New 52-week highs | at least 2.2% of issues |
| New 52-week lows | at least 2.2% of issues, on the same day |
| Trend filter | index above its level of 50 trading days ago, or above its 50-day average |
| McClellan Oscillator | below zero on that day |
| Highs against lows | new highs no more than twice the new lows |
In most modern definitions, a single trigger is not yet the omen. It counts as confirmed when a second trigger follows within about a month: 36 days in the widely quoted later version, 30 trading days in the tracker I tested. A cluster of triggers makes noise into a pattern, and the statistics further down are built on clusters, not on single days. Miekka’s original rule had no such second trigger, see below.
The McClellan Oscillator condition
The McClellan Oscillator measures whether more stocks rise or fall, smoothed over several weeks. It starts with the daily difference between advancing and declining issues. From that difference it takes a 19-day and a 39-day exponential average and subtracts the slower one from the faster one.
A reading below zero means breadth has worsened recently. For the omen only the sign counts, not the size: −2 meets the condition as well as −200. This condition is often confused with the high and low counts, but it measures something else, namely rising against falling stocks. It keeps the omen from firing in a broad rally where new highs and a few new lows appear together.
Why trackers report different dates
Two trackers can both be right and still list different signal days. The rule set has changed since the 1990s, and every provider makes its own choices. According to Miekka’s own description, reproduced by Greg Morris on StockCharts in 2016, the threshold was first 2.4% of all issues traded and later 2.8% of advancing plus declining issues, with a trend test against the NYSE level of 50 trading days earlier.
Miekka’s signal worked as a 30-day warning period, not as a confirmation window. Once highs and lows crossed his threshold in an uptrend, the signal stayed valid for 30 trading days, and further signals inside that period were ignored. During those 30 days the warning was active whenever the McClellan Oscillator was negative and inactive whenever it was positive. The later version turned this into a same-day condition plus a second trigger.
| Point | Miekka’s description | Common later version | Tracker tested here |
|---|---|---|---|
| Universe | NYSE issues | NYSE issues | about 4,750 US common stocks |
| Threshold | 2.8% of advances plus declines | 2.2% of issues | 2.2% of valid issues |
| Trend filter | NYSE above its level 50 days ago | NYSE 10-week average rising | SPY above its 50-day average |
| McClellan Oscillator | switches the warning on and off during the 30 days | negative on the trigger day | negative on the trigger day |
| Highs at most twice lows | not stated | yes | yes |
| After the first signal | valid for 30 trading days, later signals ignored | second trigger within 36 days confirms | second trigger within 30 trading days confirms |
The universe matters as much as the threshold. The tracker I used, thetrading.tools, counts US common stocks across exchanges and uses a ratio-adjusted McClellan Oscillator. It does not apply the classic floor of at least 75 issues on the smaller side, and its high and low history leaves out listings that have since disappeared. That survivorship gap can make earlier years look healthier and changes signal dates.
Even one tracker can change its own history. In early September 2026 the same page listed 18 triggers for 2026 and June 23 as the last one; on November 6 it listed 19 triggers and August 17 as the last, after a correction of its breadth data. A second, shorter rule also circulates on social media: S&P 500 within 2% of its record, NYSE new lows above 2% and new highs above 3.5%. It fires on many different days. Compare signal counts only when you know the method behind them, and follow one source over time.
How I tested the Hindenburg Omen
A hit rate without a benchmark says nothing. Every warning signal looks good if you only count the crashes it preceded. The question is whether declines came more often after a signal than after any other day. So I fixed the rules before looking at a single result.
- Signal: a trigger day of the thetrading.tools broad-universe variant, December 27, 2016 to November 6, 2026 (126 trigger days, the first on June 21, 2017).
- Cluster start: the day the number of triggers in the last 30 sessions reaches two. That gives 21 clusters.
- Crash threshold: SPY closes at least 10% below the cluster-start close at any point in the window; I also counted 20%.
- Window: 21, 63 and 126 sessions, about one, three and six months, complete windows only.
- Benchmark: every trading day of the same period, measured the same way (base rate). Returns are SPY closes without dividends.
The tracker publishes its own version of this study, and my numbers differ slightly. It counts 22 cluster starts and finds 33.3% against 23.7% for the six-month decline share. I count a new cluster only when the trigger count rises from below two, which gives 21. The direction of every result is the same.
What followed the clusters
 Click to enlarge
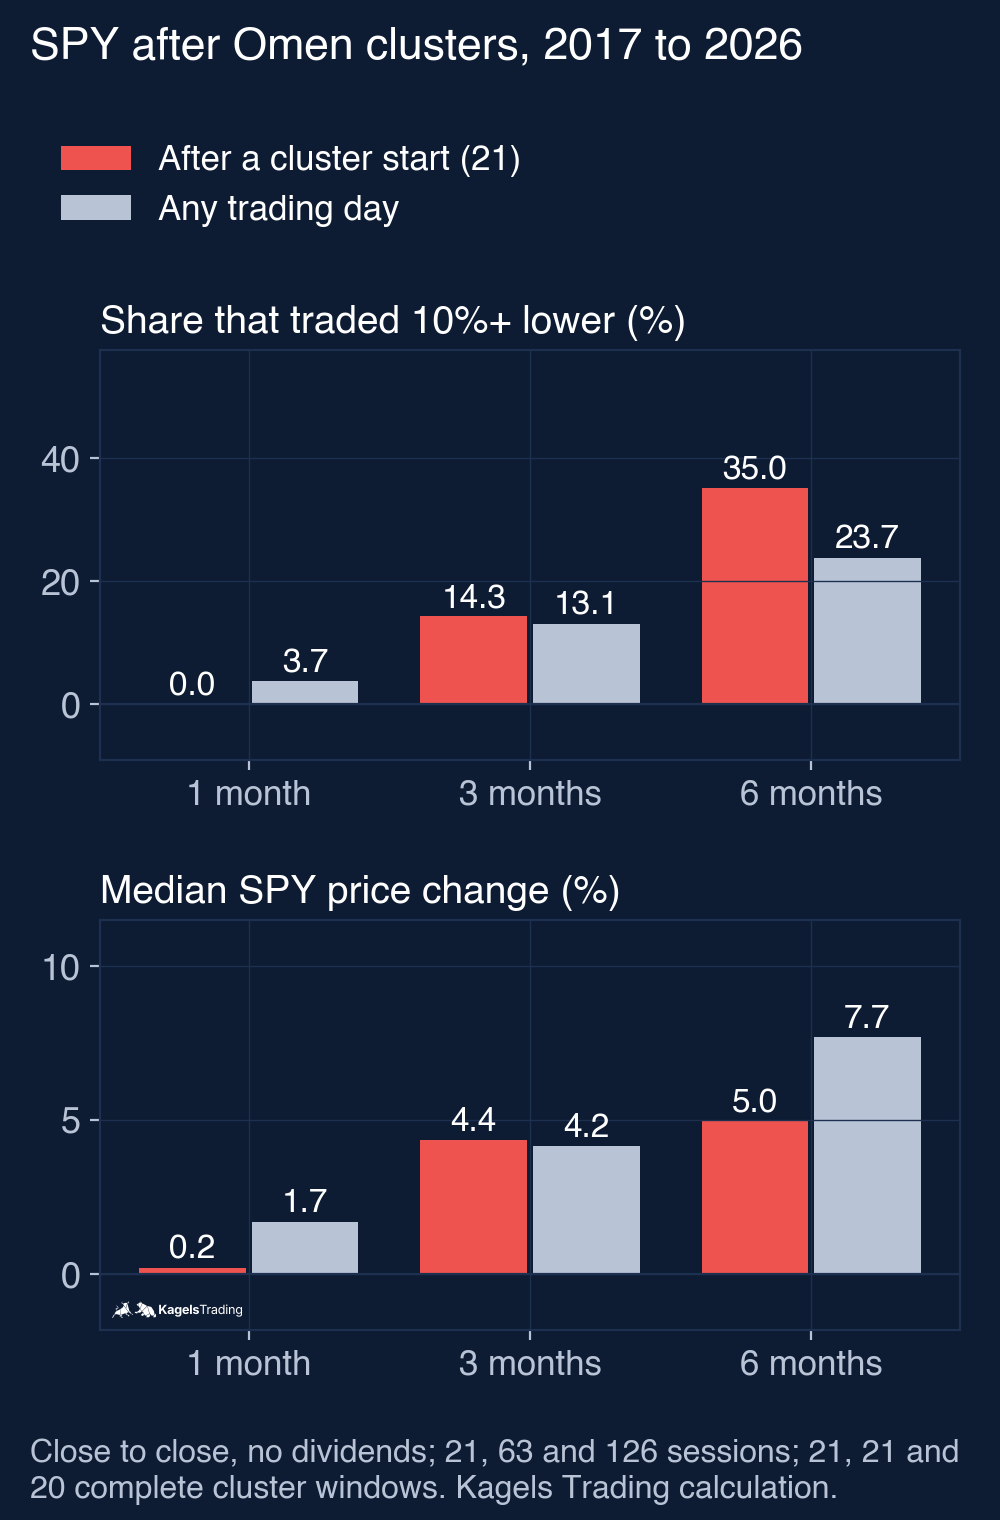
The returns after a cluster stayed positive, but below the base rate. Six months after a cluster start, the median SPY change was +5.0%, against +7.7% for any day. Thirteen of 20 windows ended higher (65%), against 78.7% of all days. Anyone who sold at every cluster usually sold into a market that kept rising.
The decline risk was higher, but only on the six-month horizon. SPY traded at least 10% below the start close within six months after 7 of 20 clusters (35.0%), against 23.7% of all days. After three months the shares were almost the same (14.3% against 13.1%), and within one month no cluster was followed by a 10% decline at all. A fall of 20% or more followed 3 of 20 clusters, against 6.7% of all days.
With 20 cases, this difference is a hint, not a proof. A single extra case moves the result by five points. The cases are also not independent: several six-month windows overlap, and the seven hits belong to only four declines (see below). The base rate is built from overlapping windows too. As a rough illustration only, under the unrealistic assumption of 20 independent cases, seven or more hits would still occur in about 17.5% of samples if declines came at the normal rate of 23.7%.
Every cluster since 2017, including the false alarms
 Click to enlarge
Source: Signals from thetrading.tools, prices from Yahoo Finance, chart by Kagels Trading.
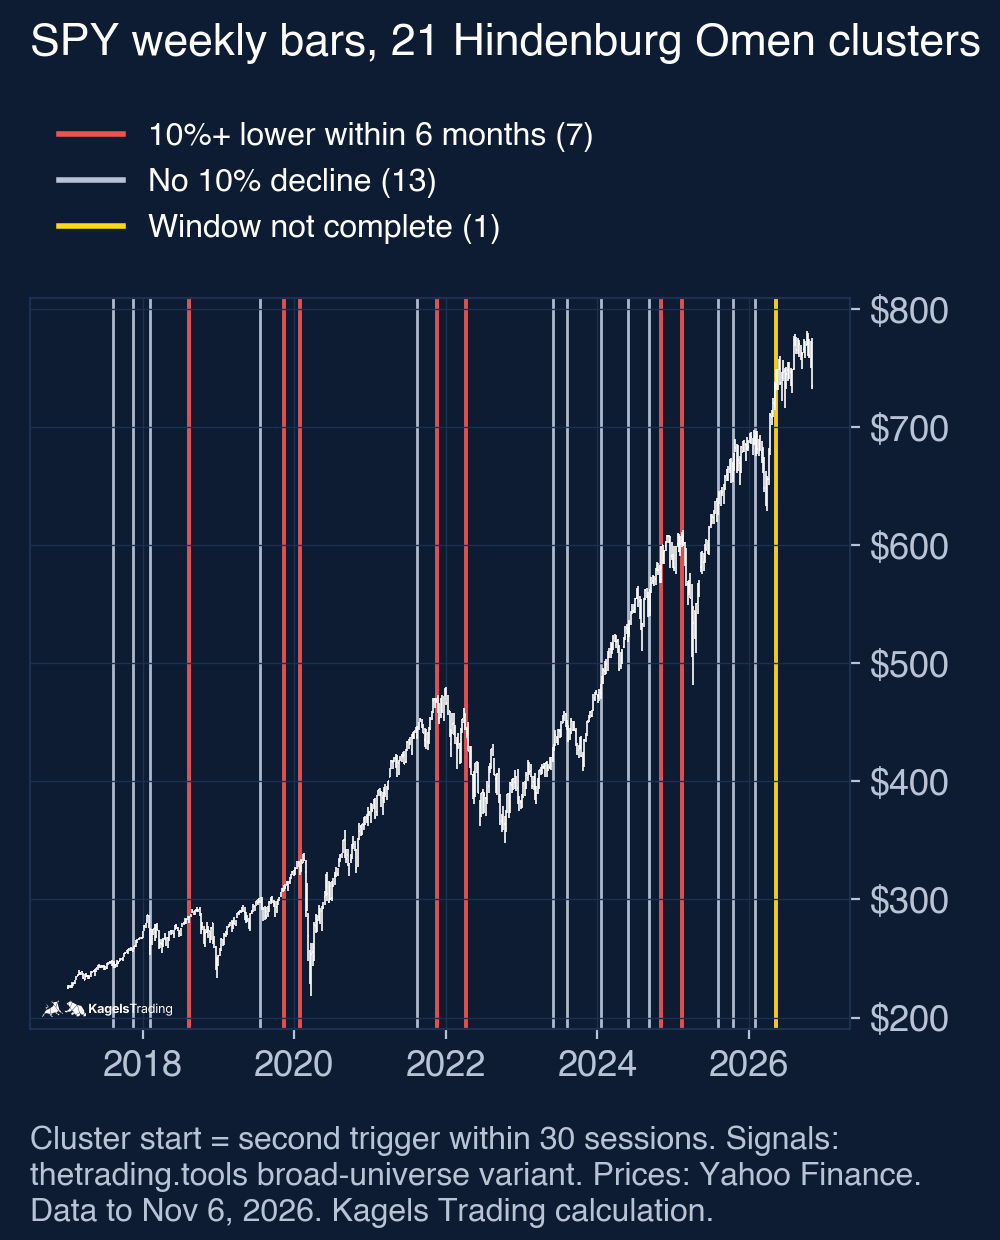
Most clusters were false alarms. Thirteen of 20 complete windows saw no close 10% below the start close, and in several of them SPY was clearly higher six months later. The table lists every cluster with its outcome, measured from the SPY close on the start day.
| Cluster start | SPY 6 months later | Lowest close in 6 months | 10% decline? |
|---|---|---|---|
| Aug 9, 2017 | +4.2% | −1.8% | no |
| Nov 13, 2017 | +5.4% | −0.7% | no |
| Feb 2, 2018 | +3.0% | −6.5% | no |
| Aug 10, 2018 | −3.2% | −17.2% | yes |
| Jul 18, 2019 | +10.7% | −5.0% | no |
| Nov 13, 2019 | −7.4% | −27.9% | yes |
| Jan 30, 2020 | −1.1% | −32.0% | yes |
| Aug 16, 2021 | −1.8% | −4.1% | no |
| Nov 18, 2021 | −17.1% | −17.1% | yes |
| Apr 6, 2022 | −16.4% | −20.0% | yes |
| May 30, 2023 | +8.3% | −2.3% | no |
| Aug 9, 2023 | +11.8% | −7.9% | no |
| Jan 18, 2024 | +15.2% | none below start | no |
| May 28, 2024 | +12.8% | −2.3% | no |
| Sep 4, 2024 | +4.5% | −1.9% | no |
| Oct 31, 2024 | −1.7% | −12.7% | yes |
| Feb 11, 2025 | +6.5% | −18.0% | yes |
| Aug 6, 2025 | +7.1% | −0.1% | no |
| Oct 13, 2025 | +5.6% | −4.7% | no |
| Jan 30, 2026 | +9.5% | −8.7% | no |
| May 11, 2026 | open | −1.9% so far | open |
The seven hits cover only four different declines. Two clusters preceded the Covid crash of 2020, two the bear market of 2022 and two the decline of spring 2025; the fourth was the sell-off of late 2018. The cluster of November 2019 counted as a hit because the Covid crash fell into its window, three months later. No breadth indicator could know about a virus, so part of this hit rate is chance.
The other side of the record also belongs here. I counted drawdown episodes from a closing high: an episode starts when SPY closes 10% below its running high and ends only when that high is regained. From 2017 to November 2026 there were five such episodes, and each had at least one cluster start within 126 sessions before its first close 10% below the peak. That is coverage in this one dataset, looked at in hindsight, not proof that the omen forecast each decline before it began. In early 2018 the cluster of February 2 started a week after the peak, when the fall was already under way. And the same tracker warned 13 times without a 10% decline.
Older records point the same way. In 2010, CXO Advisory examined the 27 confirmed omens since 1986 from Robert McHugh’s list and found that three cases (1987, September 2001 and autumn 2008) explained about half of the average weakness after a signal, a sample it called too small for confident conclusions. The Wall Street Journal reported in 2014 that large declines followed only about 25% of triggers, as quoted by CNBC. Miekka himself pointed to a signal on September 23, 1987, a few weeks before the crash.
Is the Hindenburg Omen active now?
 Click to enlarge
Source: Signals from thetrading.tools, prices from Yahoo Finance, chart by Kagels Trading.
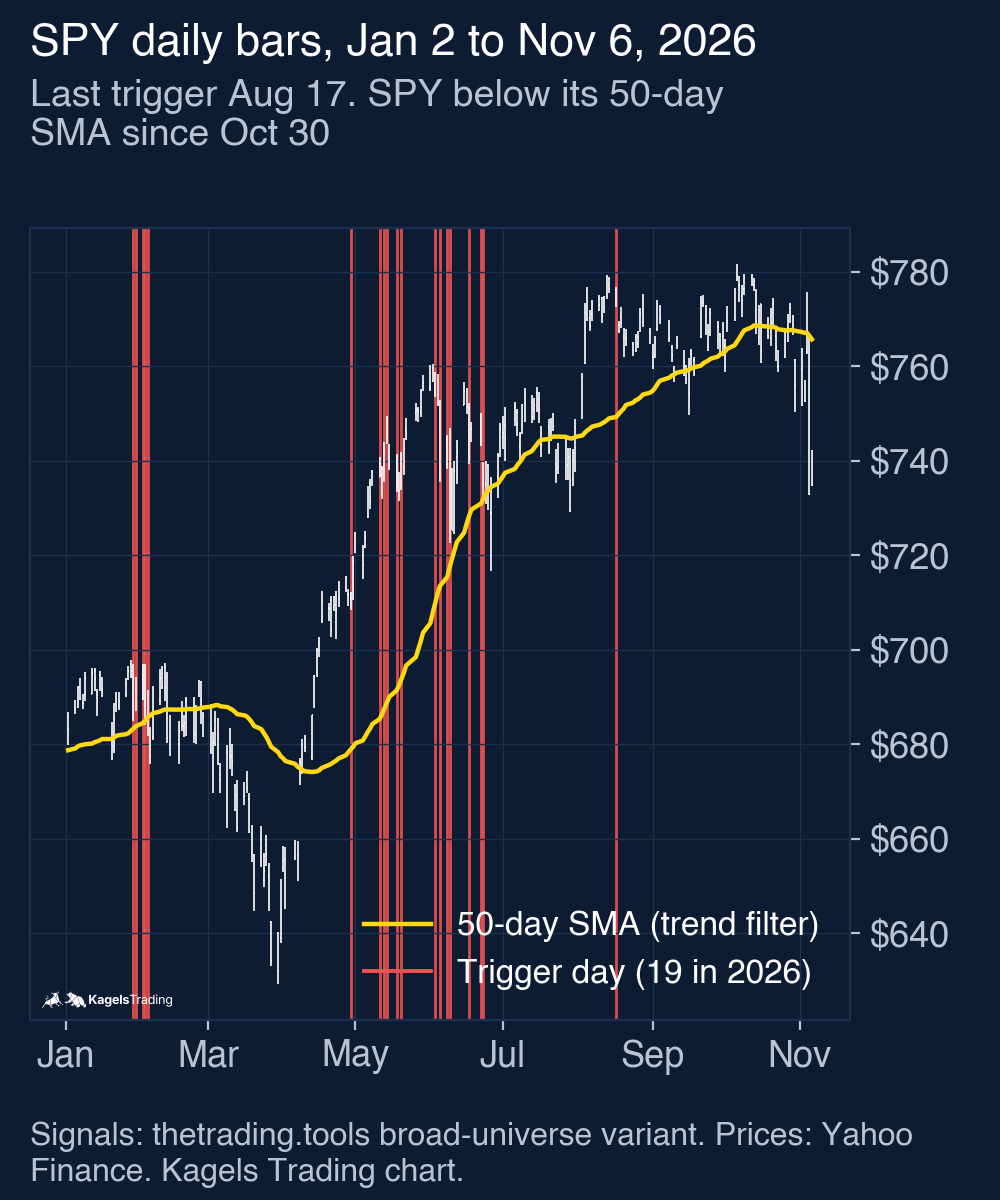
At the close of November 6, 2026, the Hindenburg Omen was inactive. Only one of the four conditions held. 48 stocks made new 52-week highs, 1.10% of 4,377 valid issues and below the 2.2% threshold, while 293 made new lows (6.69%). The McClellan Oscillator closed at +4.73, and SPY closed at $735.36, below its 50-day average of $765.68.
November 5 shows how the trend filter works. That day SPY fell 4.4% to $733.00, new highs reached 6.39% and new lows 11.86% of issues, and the McClellan Oscillator turned negative at −2.45. Three conditions held, but SPY was already below its 50-day average, so the day did not count as a trigger. The omen looks for a split market in an uptrend; once the decline is under way, it falls silent by design.
2026 has been a busy year for the indicator. The tracker recorded 19 triggers, 13 of them between April 29 and June 23, and a single one on August 17. The cluster that started on May 11, 2026 at $739.30 has not produced a 10% decline: the lowest close since then was 1.9% below its start, on June 10. SPY closed at a record $779.09 on October 6, 2026 and on November 6 stood 5.6% below it.
How I use the Hindenburg Omen
I trade without indicators, but I read breadth warnings like this one as a reason to check my risk. I traded through the crash of 1987, the end of the dot-com bubble and the financial crisis of 2008. In each case the deciding question was not whether a warning signal had appeared, but how large my position was at that moment.
A cluster is a reason to check stops and position sizes, not a sell order. The numbers above show why: the median six-month return after a cluster was still positive, and 13 of 20 warnings came to nothing. What a cluster did change was the tail risk, the chance of a deep decline within six months. That is a job for position sizing and risk management, not for a forecast.
The omen also has no timing. Between a cluster start and the first close 10% lower, SPY needed between 22 and 105 sessions in my sample: about one month after the cluster of April 2022, about five months after the cluster of October 2024. A trader who sells at the signal and waits for the crash can miss a large part of the rally in between, as after the clusters of 2023 and 2024.
Advantages and disadvantages
The strengths of the indicator are real, but narrow. Three of them stand out in breadth data and in my cluster test.
- It looks under the surface: the omen measures a split in market breadth that an index chart does not show.
- It has clear rules: conditions that anyone can check with public data, once the variant is fixed.
- It raised the six-month decline risk in my sample, from 23.7% to 35%, and each of the five 10% drawdown episodes since 2017 had a cluster in the six months before its first 10% close (one tracker, in hindsight).
The weaknesses are just as clear. Five of them limit what a trader can do with a signal.
- Many false alarms: 13 of 20 clusters since 2017 were followed by no 10% decline within six months.
- No timing: a decline, if it comes, can start weeks or months later.
- Small samples: 20 complete clusters and four distinct declines are too few for a statistical proof.
- No single definition: threshold, universe, trend filter and window differ between sources, and so do the signal dates.
- It cannot tell causes apart: a real trend change and a sector rotation, in which only the leaders change, can produce the same split.
Breadth warnings are worth comparing with other context indicators. The Fear and Greed Index counts new highs against new lows as one of its seven parts, and the death cross shows a trend change in the index itself. Neither replaces your own plan.
Conclusion: a warning light, not a sell signal
The dramatic name tempts you to dismiss the Hindenburg Omen as superstition, and that would be too simple. The indicator measures something real: a split inside the market that no index level shows. In one tracker’s data from 2017 to 2026, each of the five 10% drawdown episodes had a cluster in the six months before its first 10% close, a pattern seen in hindsight and in a small sample.
The reverse does not hold. Most clusters were followed by no large decline, and the median return after six months stayed positive at +5.0%, against +7.7% for any day. A confirmed cluster raised the chance of a 10% decline within six months from 23.7% to 35% in 20 cases, a shift that a few more cases could still change.
My conclusion: treat the Hindenburg Omen like a warning light on the dashboard. It does not tell you to stop. It tells you to check your speed: stops, position sizes and perhaps partial profits. I did not test an exit strategy. What the numbers do show: SPY finished higher in 13 of 20 complete six-month windows after a cluster, so selling at the signal could have missed the gains that followed.
This article is market analysis, not investment advice. Past signals and their outcomes do not show future results.
Frequently asked questions about the Hindenburg Omen
Is the Hindenburg Omen active right now?
No, at the close of November 6, 2026 it was inactive in the tracker used here. Only one of four conditions held, SPY was below its 50-day average, and the last trigger dated from August 17, 2026. The cluster that began on May 11, 2026 has not been followed by a 10% decline so far.
How often is the Hindenburg Omen right?
After 20 complete clusters since 2017, SPY traded at least 10% lower within six months in 7 cases, or 35%. For any trading day the share was 23.7%. The seven hits belong to only four different declines, and 13 clusters were false alarms.
Should I sell when the Hindenburg Omen appears in the news?
Not on that basis alone. Six months after a cluster start, SPY was still higher in 65% of cases, with a median gain of 5.0%. A cluster is a reason to review stops and position sizes, not to leave the market.
Who invented the Hindenburg Omen?
Jim Miekka, a former physics teacher who had lost his sight, is credited with it. Tom McClellan dates it to 1995; StockCharts names the 1980s. Miekka died in 2014; the name refers to the Hindenburg airship disaster of May 6, 1937.
Why do different sources report different numbers of signals?
Because they use different rules. Thresholds range from 2.2% to 2.8%, some count only NYSE issues and others thousands of US stocks, and the trend filter and confirmation window differ. Even one tracker can revise its own history after a data correction.
What is the difference between 2.2% and 2.8%?
It is the share of issues that must make new highs and new lows on the same day. Miekka’s own description used 2.8% of advancing plus declining issues, after an earlier 2.4% of all issues; many later versions and trackers use 2.2%. A lower threshold produces more triggers.
Where can I follow the Hindenburg Omen myself?
You need daily counts of new 52-week highs and lows, advancing and declining issues, and an index trend filter. Free trackers such as thetrading.tools publish the conditions every day and explain their method; StockCharts and TradingView offer the underlying breadth data and community scripts. Stick to one source and know which variant it uses.
This English edition is based on our German edition on kagels-trading.de and has been adapted for international readers.
More Technical Indicators guides
- Judge a golden cross
Golden Cross: Definition and S&P 500 Test Results
How the 50-day and 200-day averages cross, and what 38 signals in the S&P 500 since 1950 did against the base rate and buy and hold.
- Judge a death cross
Death Cross: What 38 S&P 500 Signals Since 1950 Show
How deep the S&P 500 fell after 38 death crosses since 1950, how late the signal comes, and what shorting it on SPY did since 1993.
- Use moving averages
Moving Averages: SMA, EMA and a 76-Year 200-Day Test
SMA, EMA and WMA formulas with a worked example, common periods, and what the 200-day line showed on the S&P 500 since 1950.
- Trail a stop with the Supertrend
Supertrend Indicator: Settings, Strategies and an ETF Test
How the ATR-based line is calculated, common settings, five strategies, and what 654 completed flip trades in SPY, QQQ and GLD since 1993 showed.
- Read the Ichimoku Cloud
Ichimoku Cloud: The Five Lines and a US ETF Test
The five lines and the cloud, how traders read the Tenkan/Kijun cross, and what the cloud and the crosses did in SPY (since 1993), QQQ and GLD.
- Measure trend strength with the ADX
ADX Indicator: What Trend Strength Really Tells You
How +DI, −DI and the ADX are calculated, what 20 and 25 mean, and whether a high ADX meant the trend went on in SPY, QQQ and GLD.
- Read the RSI
RSI Indicator: Formula, Settings and a 75-Year Test
The RSI formula, overbought and oversold, and what RSI signals did on the S&P 500 since 1951 against the base rate.
- Compare a stock with the market
Relative Strength: Compare Stocks with the Market
The price ratio behind every relative strength line, how it differs from the RSI, a five-step watchlist and two Dow examples from one selection date.
- Read volatility with Bollinger Bands
Bollinger Bands: Settings, Squeeze and a 76-Year Test
Settings, the three typical chart situations, five strategies with rules, and what the bands and the squeeze showed on the S&P 500 since 1950.
- Trade reversals at the bands in a range
Joe Ross's Gimmee Bar: Bollinger Bands for Sideways Markets
Joe Ross's Gimmee Bar with complete long and short rules, our added stop, target and expiry rules, and one clean and one failed trade in Procter & Gamble.
- Set stops with the ATR
ATR Indicator: Average True Range for Stops and Size
True range and Wilder smoothing, stop distance and position size, and how ATR stops behaved on SPY from 1994 to 2026 against a fixed stop.
- Trade Donchian breakouts
Donchian Channel: Breakout Rules and a 20-Year ETF Test
Channel rules, the current-bar pitfall, the Turtle systems, and what 499 breakout trades in SPY, GLD and TLT from 2006 to 2026 showed.
- Read the Stochastic
Stochastic Oscillator: Settings, Signals and a 30-Year Test
The %K and %D formula, what 14, 3, 3 means, fast versus slow, and what 785 oversold signals in SPY, QQQ and GLD did against the base rate.
- Judge a divergence
Divergence Trading: Regular and Hidden Divergence Tested
Regular and hidden, bullish and bearish divergences, when they are confirmed, and what 447 RSI divergences detected in SPY, QQQ and GLD did against the base rate.
- Read the MACD
MACD Indicator: Histogram, Divergence and a 31-Year Test
Formula, histogram, crossovers and divergences, with a 31-year test on the S&P 500 and the DAX against the base rate.
- Use VWAP
VWAP Indicator: Formula, Anchored VWAP and TradingView Setup
The VWAP formula, trend day versus range day, Anchored VWAP and the right settings in TradingView.