
Stochastic Oscillator: Settings, Signals and a 30-Year Test


Contents
- Stochastic Oscillator in 30 seconds
- What is the Stochastic Oscillator?
- How the Stochastic Oscillator is calculated
- Fast, slow and full stochastic: the three variants
- Settings: 14, 3, 3 and when to change them
- Reading the signals: four types
- My test: the stochastic rules on SPY, QQQ and GLD
- Stochastic vs RSI and Stochastic RSI
- Combining the stochastic: trend filter, RSI and Bollinger Bands
- Five common mistakes with the stochastic
- Advantages and disadvantages of the Stochastic Oscillator
- My conclusion: a timing tool, not a trading system
- Frequently asked questions about the Stochastic Oscillator
- About the author
The Stochastic Oscillator does not measure price, but where recent closes stand within the recent range. If a market closes near the high of the last few days, the indicator is high. If it closes near the low, it is low. From this simple idea George C. Lane built a momentum oscillator, an indicator that swings between two fixed values.
This guide explains the formula, the variants and the settings, and then puts the indicator to the test. I measured the textbook rules on three US ETFs: SPY for the S&P 500 since 1993, QQQ for the Nasdaq 100 since 1999 and GLD for gold since 2005. The result contradicts the usual rule at one decisive point, and that is where its practical use lies. This article follows our editorial policy.
Stochastic Oscillator in 30 seconds
- What it measures: the position of recent closes within the high-low range of the last periods, smoothed, on a scale from 0 to 100.
- Two lines: the %K line is the main line, the %D line a moving average of it. When they cross, traders read a signal.
- Default 14, 3, 3: 14 periods for %K, 3 periods of smoothing, 3 periods for %D. These are TradingView’s default values.
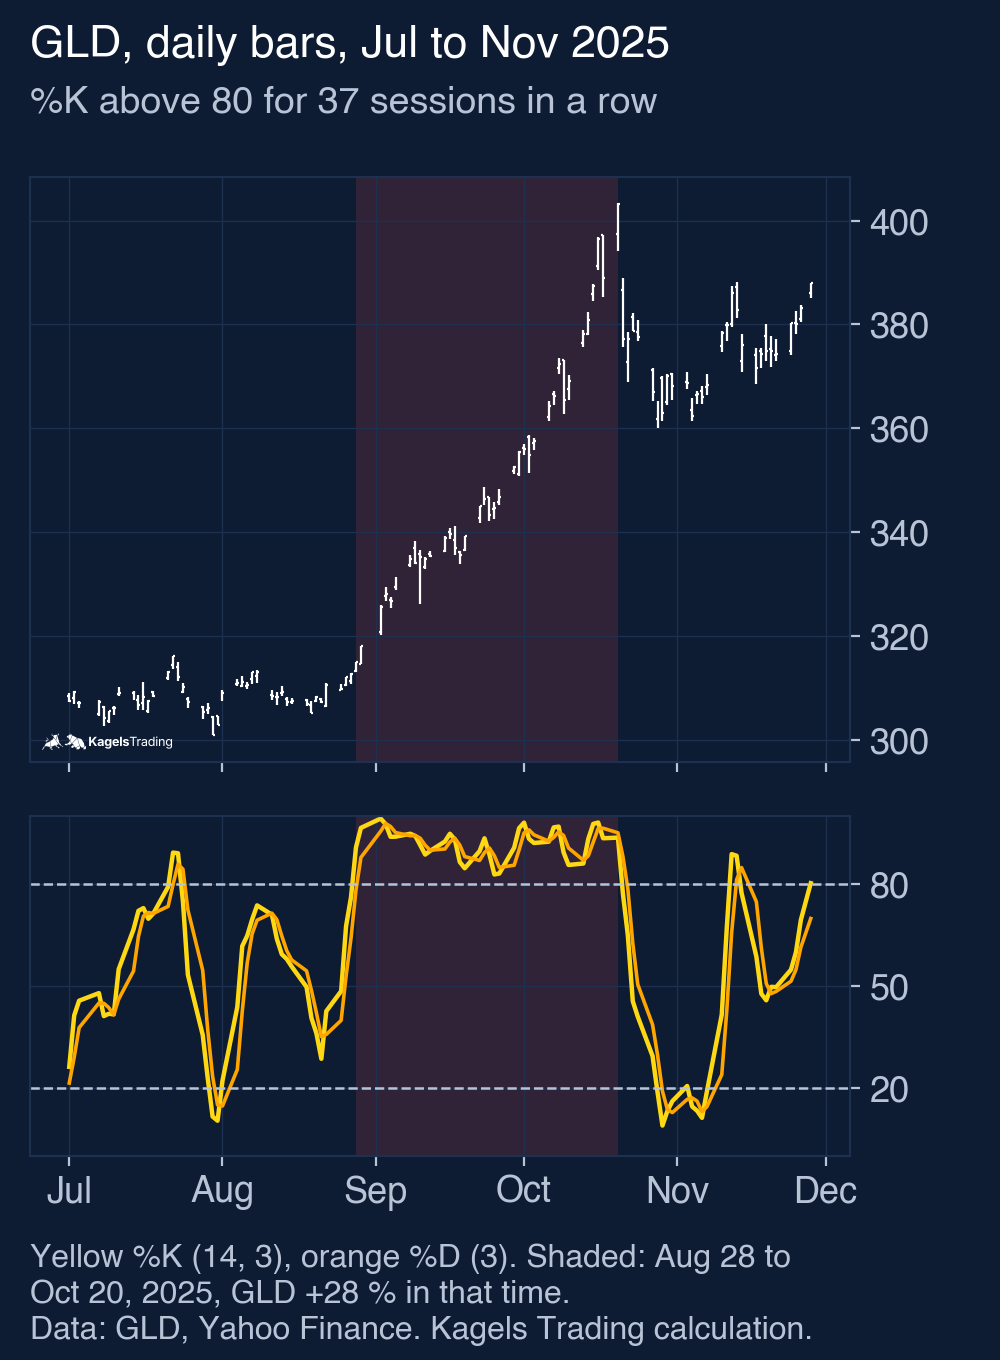
- Overbought is a state, not a sell signal: in SPY the indicator was above 80 on 37.5% of all trading days since 1993, and the longest run above 80 in QQQ lasted 42 sessions.
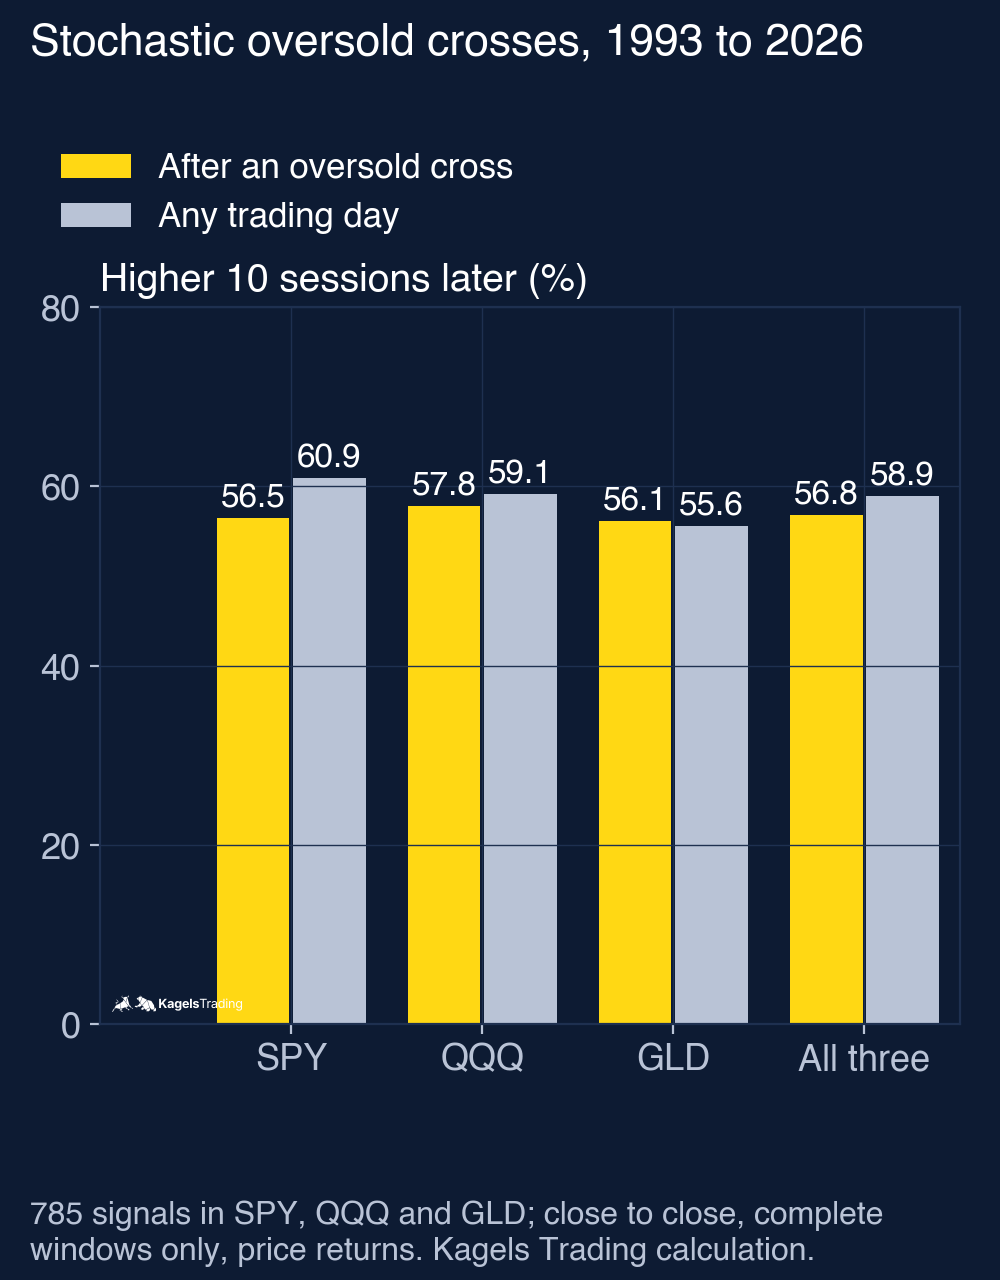
- The cross alone did not beat the base rate: after 785 oversold crosses, the ETF was higher 10 sessions later in 56.8% of cases, against 58.9% for any day.
What is the Stochastic Oscillator?
The Stochastic Oscillator is a momentum indicator that compares the current close with the high-low range of a set number of periods and shows the result on a scale from 0 to 100.
George C. Lane made the indicator popular from the 1950s on. His observation was simple: in an uptrend prices tend to close near the top of the range, in a downtrend near the bottom. The indicator turns that into a number. Readings above 80 are called overbought, readings below 20 oversold.
That makes it different from most other tools. It does not measure the level of price but its position within a range. A market can stand at an all-time high and still show a low reading if it closes at the bottom of its last 14 sessions. That is its value for timing and at the same time its biggest source of error.
The name is misleading. “Stochastic” sounds like probability theory, but the indicator has nothing to do with it. It is a plain calculation on price data, like the MACD, and it uses highs, lows and closes, not volume.
How the Stochastic Oscillator is calculated
The formula has two steps: first the %K line, then the %D line as an average of it. The TradingView help on the Stochastic uses the same structure, with a smoothing of %K as an extra input:
- Raw %K = (close − lowest low of the period) ÷ (highest high of the period − lowest low of the period) × 100
- %K (slow) = 3-period simple average of raw %K
- %D = 3-period simple average of %K
A worked example makes it concrete. Say an ETF traded between $640 and $680 over the last 14 sessions and closed today at $672. The range is $40, the distance from the low $32. That gives a raw %K of 80: the market has used four fifths of its range to the upside.
Both lines move between 0 and 100 and cannot leave that frame. A raw %K of 100 means the close is exactly at the period high, a raw value of 0 that it is at the period low. The plotted slow %K and %D are averages of these raw values, so they can stay below 100 even on a day that closes at the high.
Fast, slow and full stochastic: the three variants
The three variants differ in only one point: how often the values are smoothed. Each extra average makes the lines calmer, usually delays their reaction and can suppress some crossovers. It does not guarantee better signals.
- Fast stochastic: the original raw formula without extra smoothing. Its %K is the raw value, its %D a 3-period average. It reacts at once and swings back and forth on quiet days.
- Slow stochastic: smoothed once more. Its %K is the %D of the fast version, its own %D a further average. Most platforms show this version by default; it usually reacts later and can suppress some crossovers.
- Full stochastic: all three inputs are free. The common 14, 3, 3 is exactly the slow stochastic; a setting such as 21, 5, 5 makes the indicator slower for volatile markets.
| Variant | Strength and weakness | Typical use |
|---|---|---|
| Fast stochastic | Early signals, many false ones | Very short-term trading in liquid markets |
| Slow stochastic | Calmer lines, usually later signals | Swing trading, daily and weekly charts, beginners |
| Full stochastic | Fully adjustable, but needs its own testing | Experienced traders with fixed rules |
For a start, the slow stochastic with 14, 3, 3 is the sensible choice. It is the default in TradingView, most of the literature is written about it, and it does not produce so many signals that you lose track. Change it only when you can name a concrete problem the default causes. All numbers in this article use it.
Settings: 14, 3, 3 and when to change them
The first number is the lookback for %K, the second the smoothing of %K, the third the length of %D. On a daily chart, 14 periods cover about three trading weeks. Shorter values make the indicator more sensitive, longer ones slower. That is not a question of quality but a decision about how many signals you want to see.
As a rule of thumb, the smaller the time frame, the shorter the period. The values below are common starting points from practice, not tested optimums; I did not test them.
| Time frame | Common setting | Typical use |
|---|---|---|
| 1-minute chart | 5, 3, 3 | Scalping |
| 5-minute chart | 9, 3, 3 | Intraday trading |
| 15-minute chart | 12, 3, 3 | Short-term day trading |
| 1-hour chart | 14, 3, 3 | Day and swing trading |
| Daily and weekly chart | 14, 3, 3 | Swing and position trading |
Shorter periods such as 5 or 9 give a signal earlier, and a false one earlier too. You get closer to the turning point and pay with a higher error rate. Longer periods such as 21 or 25 turn the ratio around: fewer signals, and you miss the first part of the move. Neither is better in general; it depends on your holding period.
The thresholds 80 and 20 are not set in stone either. In strong trends many traders use 90 and 10 to reduce the number of alarms; in quiet sideways phases 70 and 30 can make more sense. I tested one such change (30 instead of 20) and report it below. Whatever you change, test it over a longer period first, ideally in a paper trading account, and write the results down in a trading journal.
In TradingView, open “Indicators”, type “Stochastic” and choose the built-in entry. The gear icon next to the indicator name opens the three inputs, called %K Length, %K Smoothing and %D Smoothing. Other platforms use other names and may use other defaults, so check yours before you compare signals.
Reading the signals: four types
The indicator gives four kinds of hints, and they differ a lot in what they are worth. The literature usually lists them side by side as if they were equal. That causes most of the wrong decisions in practice, so here they are in order of how often they mislead.
Overbought and oversold
The best-known reading is also the most dangerous one. Above 80 the market counts as overbought, below 20 as oversold, and many guides turn that directly into a sell or buy signal. That is a mistranslation of the word. “Overbought” does not mean expensive; it means the market has recently closed near the top of its range, and a market in an uptrend does exactly that, day after day.
 Click to enlarge
Crossovers
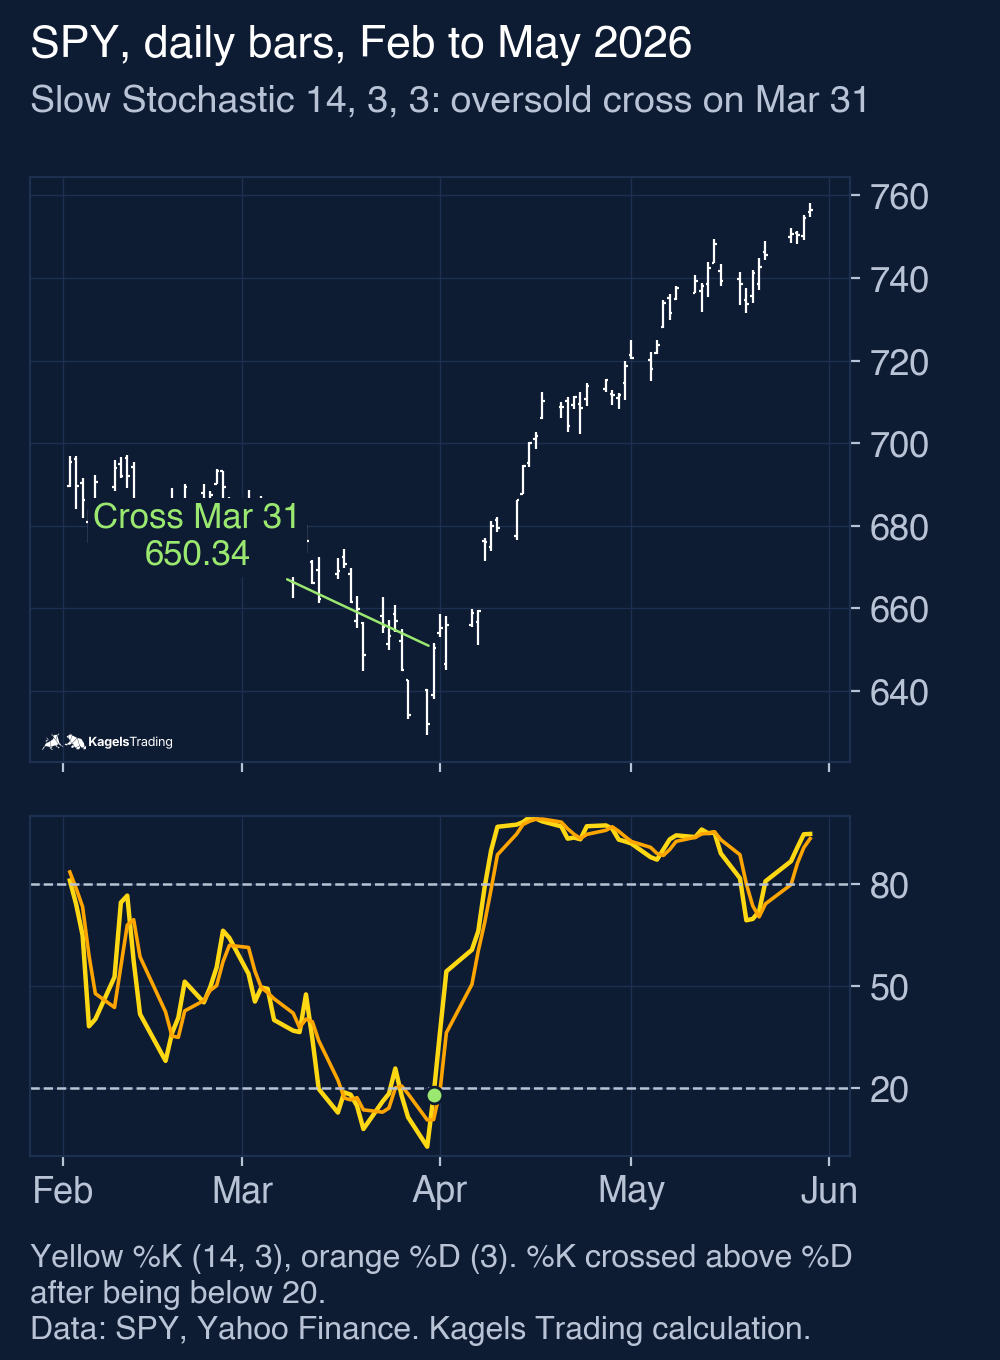
When %K crosses above %D, traders read a buy signal; when it crosses below, a sell signal. The logic: the faster line turns before the slower one, so the momentum changes direction. Crosses in the extreme zones carry more weight than crosses at 55, because the market was really under pressure before. Crosses in the middle of the scale are mostly noise.
 Click to enlarge
Divergences
A divergence occurs when price and indicator point in different directions. In a bullish divergence price falls to a lower low, but the indicator does not. In a bearish divergence price makes a higher high while the indicator makes a lower one. A divergence is a warning, not an entry: it can last for many bars, and it can dissolve again. Only when the market structure follows, for example when an intermediate high breaks, does it become a tradable setup. Regular and hidden divergences, and how often they worked in a test on three ETFs, are explained in our divergence trading guide.
Levels within the indicator
The indicator line itself also forms recurring levels. If the oscillator turns several times at the same place, say around 40, that tells you something about the structure of the current move. In an intact uptrend the pullbacks of the indicator end well above 20. As long as they end above the previous lows, the trend is intact; the same logic on the price chart is the subject of our guide to support and resistance.
My test: the stochastic rules on SPY, QQQ and GLD
Textbook rules for the stochastic are stated almost everywhere and measured almost nowhere. So I calculated them. I wrote the rules down before calculating and applied them unchanged to three ETFs: SPY (S&P 500), QQQ (Nasdaq 100) and GLD (gold), with daily bars from Yahoo Finance up to October 15, 2026. All numbers use the slow stochastic 14, 3, 3 and price returns without dividends.
- Period: from the first day on which the stochastic and a 200-day average both exist: SPY from November 11, 1993 (8,287 trading days), QQQ from December 21, 1999 (6,745), GLD from September 2, 2005 (5,312).
- Signal: %K crosses above %D at the close, after %K was below 20 the day before.
- Comparison: every trading day of the same period and ETF, with the same horizon. Only windows that are complete by October 15, 2026 count.
Finding 1: overbought is a normal state
The indicator was above 80 on more than a third of all trading days in the two stock ETFs. In SPY it was 37.5% of days, in QQQ 36.2%, in GLD 28.6%. Below 20 it was only on 11.3%, 13.4% and 17.7% of days. Stock indices rise over long periods, so their closes sit in the upper part of the range more often than in the lower part.
The runs are even clearer. In the three ETFs together there were 555 phases in which the indicator stayed above 80 for five sessions or more without a break. The median length of those phases was 9 to 10 sessions. The longest lasted 42 sessions in QQQ (January 4 to March 5, 2012, +12.4%), 37 in GLD (August 28 to October 20, 2025, +28.0%) and 29 in SPY (November 3 to December 14, 1995, +5.0%). If you had sold short at the first overbought reading in GLD in 2025, you would have been on the wrong side for almost two months.
Finding 2: the oversold cross did not beat the base rate
The classic buy signal was followed by a higher price less often than an average day. Over all three ETFs there were 785 oversold crosses. Ten sessions later the ETF was higher in 56.8% of cases (446 of 785); for any day of the same periods the share was 58.9%. After 20 sessions, with 784 complete windows, it was 59.6% against 61.2%.
 Click to enlarge
| Oversold cross against the base rate | SPY | QQQ | GLD | All three |
|---|---|---|---|---|
| After the signal | 56.5% (161 of 285) | 57.8% (152 of 263) | 56.1% (133 of 237) | 56.8% (446 of 785) |
| Any trading day | 60.9% | 59.1% | 55.6% | 58.9% |
| After the signal, 20 sessions | 64.9% | 60.5% | 52.1% | 59.6% |
| Any trading day, 20 sessions | 64.0% | 62.0% | 55.8% | 61.2% |
| Median change after the signal, 10 sessions | +0.59% | +0.98% | +0.44% | |
| Median change any day, 10 sessions | +0.65% | +0.80% | +0.37% |
The result is not the same in every ETF, and none of the differences is large. In GLD the signal was slightly above the base rate after 10 sessions and below it after 20; in SPY it was below after 10 and slightly above after 20. The event windows overlap, and the three ETFs often move together, so the signals are not independent observations; I did not run a significance test. The fair reading is: these tested crossover rules showed no consistent advantage in these ETFs and horizons.
As a trade, the signal was positive on average, but so is the market. I also bought at the next open after each signal and sold at the open ten sessions later, with 0.05% cost per side. Of 784 such trades, 56.6% were winners, with a mean of +0.37% and a median of +0.65%. The worst single trade lost 19.8% (QQQ). Since the ETFs themselves rose over the period, a positive mean does not show an edge; the event study above is the comparison that counts. The trades overlap when signals follow each other closely, so they are not independent. There is no matching next-open comparison for any day, so these trade numbers do not show an executable edge either.
The variants I tested
I planned three variants before calculating, and all of them are in this table. None changes the picture fundamentally. The trend filter is the closest to an improvement, but only in QQQ.
| Variant, higher (or lower) after 10 sessions | SPY | QQQ | GLD | All three |
|---|---|---|---|---|
| Threshold 30 instead of 20 | 57.4% (base 60.9%) | 54.1% (59.1%) | 55.9% (55.6%) | 55.8% of 1,019 (58.9%) |
| Only above the 200-day average | 60.1% of 143 (62.1%) | 67.2% of 122 (60.8%) | 53.7% of 121 (55.8%) | 60.4% of 386 (60.1%) |
| Sell signal from above 80: share lower | 35.4% (base 39.0%) | 36.8% (40.7%) | 43.5% (44.2%) | 37.6% of 1,522 (40.9%) |
The trend filter mostly helped because of the filter, not the indicator. Days above the 200-day moving average were already higher more often than average days, and the filtered signals only matched that level in total (60.4% against 60.1%). In QQQ they were clearly above it, in SPY and GLD below. The sell signal from the overbought zone did worse than a random day: the ETFs fell after it less often than after any day.
These numbers have limits. They come from three ETFs, one setting and fixed horizons, without stops, targets or position sizing. A trader with a clean exit plan can get a different result from the same signals. What the test shows is the raw value of the signal, and on its own it does not carry.
Stochastic vs RSI and Stochastic RSI
The RSI measures something different from the stochastic. It compares the size of gains with the size of losses, while the stochastic measures the position in the range. Both end up on a scale from 0 to 100, but they get there by different routes. The RSI guide has its own test on the S&P 500, and its oversold signals also showed no consistent advantage over the base rate.
The Stochastic RSI is a third tool, not a variant of either. It applies the stochastic formula to the RSI values instead of to price, which makes it much faster and more often at its extremes. It runs on the RSI, not on price. Its extremes (0.8 and 0.2, or 80 and 20, depending on the scale your platform shows) describe the RSI’s position in its own range, not price’s position in the price range. Check the scale before you compare readings; the details are in the RSI guide.
Combining the stochastic: trend filter, RSI and Bollinger Bands
An oscillator that brings no advantage on its own needs a job in a team. That job is timing, and the direction comes from somewhere else. The ideas below are common practice; apart from the 200-day filter in the table above, I have not tested them.
- A trend filter first: a moving average decides the direction. Above it you take only buy signals, below it only sell signals. The setup is the pullback in the trend: price above the average, the indicator falls to the lower zone and turns there.
- With the RSI: if both point the same way, two different calculations agree. If they disagree, that is a reason to skip the trade, and in practice the second case is the more useful one.
- With Bollinger Bands: when price touches the lower band while the stochastic is below 20, two different extreme measures meet. In sideways phases that can be useful; in trends price walks along the band and both tools stay “extreme”. The settings are in our guide to Bollinger Bands.
I have traded on the price chart since 1980, not on indicators. An oscillator tells me where the market stands in its range. Whether I take a trade depends on the market structure and the bar in front of me; the guide to price action trading describes how I read it. The stochastic is most useful to me where it contradicts an observation: when a market makes new highs and the indicator does not follow, I look more closely.
Five common mistakes with the stochastic
Four of these five mistakes have the same root: the indicator is used for a statement it cannot make. It describes a state; it does not forecast a turn. Where a point below refers to a number, it comes from the test above; the rest is practical guidance I have not measured.
- Ignoring the bigger trend: the indicator shows 85, the trader sells short, and the market keeps rising. In SPY the indicator was above 80 on 37.5% of all days. Decide the direction first, ideally on a higher time frame, and take only signals in that direction.
- Reading extremes as reversal signals: in a strong trend the indicator stays up for weeks. In an uptrend a drop to 50 is already a pullback; waiting for 20 often means missing the move.
- Reacting to every cross: the stochastic produces more crosses than an account can afford. Filter hard: a cross becomes a candidate only in the extreme zone, in the direction of the trend and with a second, independent reason.
- No exit plan: the indicator says nothing about when to end a trade. Put the exit at the market structure, at the last swing low or a fixed amount, not at a reading of the oscillator.
- Sizing by how good a signal looks: a “strong” signal does not justify a larger position. Keep the risk per trade constant; our guide to position sizing shows how.
Advantages and disadvantages of the Stochastic Oscillator
Each point in this list goes back to the test or to the way the formula works. The indicator describes the recent position of the close correctly; problems start when that description is read as a forecast.
What speaks for the stochastic
- Clear description: it gives a smoothed measure of where recent closes stood within their range.
- Timing help in a known trend: it makes pullbacks visible, which can help with the entry once the direction is decided.
- Fits clean ranges in principle: in sideways phases with clear edges the range stays stable, which is what the formula assumes; I did not test this separately.
- Free and everywhere: it is built into every common platform.
What speaks against the stochastic
- Overbought misleads in trends: above 80 on more than a third of all days in SPY and QQQ, with runs of up to 42 sessions.
- The cross alone had no advantage: 56.8% higher after 10 sessions against a base rate of 58.9%, over 785 signals.
- The filter does the work: with a 200-day filter the signals only matched the filtered base rate (60.4% against 60.1%).
- Different by market: what looked better in QQQ looked worse in SPY and GLD.
My conclusion: a timing tool, not a trading system
The Stochastic Oscillator answers one question well: where have recent closes stood within the range of the last periods? That is an honest and useful piece of information. The crossover rules I tested on top of it did not show a consistent advantage in my test.
Two numbers are worth remembering. SPY was above 80 on 37.5% of all trading days since 1993, so this state is normal and not an alarm. And the classic oversold cross was followed by a higher price in 56.8% of cases, against 58.9% for any day.
That gives a clear division of labour. The direction comes from the price chart or a trend filter. The oscillator looks for a good moment to enter within it. The risk is set by your rules, not by your impression of the signal. If you want a ready-made rule that works without your own analysis, the stochastic will disappoint you; if you already read the market structure and want a simple extra hint for timing, it is a free and easy tool.
This article is market analysis, not investment advice. Trading can lead to the loss of the capital you use, and past results of a rule test do not show future results.
Frequently asked questions about the Stochastic Oscillator
What is the Stochastic Oscillator?
The Stochastic Oscillator is a momentum indicator that shows, in smoothed form, where recent closes stood within the high-low range of a set number of periods. It runs from 0 to 100; readings above 80 count as overbought, below 20 as oversold. It was made popular by George C. Lane.
What do the settings 14, 3, 3 mean?
14 is the lookback for %K, the first 3 the smoothing of %K and the second 3 the length of %D. These are the default values in TradingView and give the slow stochastic. On very short time frames, traders often use 5, 3, 3 or 9, 3, 3, but those are conventions, not tested values.
What is the difference between fast and slow stochastic?
The fast stochastic uses the raw formula without extra smoothing, the slow stochastic smooths it once more. The fast version reacts at once but produces many false signals; the slow version is calmer, usually reacts later and can suppress some crossovers. On daily and weekly charts the slow version is the usual choice.
Does a reading above 80 mean I should sell?
No, because overbought is a normal state in a rising market. In my test SPY was above 80 on 37.5% of all trading days since 1993, and in QQQ one run above 80 lasted 42 sessions. Selling short at those readings meant standing against the trend.
Can I trade the stochastic on its own?
Not on the evidence of my test. After 785 oversold crosses in SPY, QQQ and GLD, the ETF was higher 10 sessions later in 56.8% of cases, against 58.9% for any day. The indicator needs a direction from somewhere else and an exit rule of its own.
What is the difference between the stochastic and the RSI?
The stochastic measures the close within the recent range, the RSI compares the size of gains and losses. Both run from 0 to 100, but they can disagree, which is useful as a filter. The Stochastic RSI applies the stochastic formula to the RSI and is much faster than either; the RSI guide explains it.
This English edition is based on our German edition on kagels-trading.de and has been adapted for international readers.
More Technical Indicators guides
- Judge a golden cross
Golden Cross: Definition and S&P 500 Test Results
How the 50-day and 200-day averages cross, and what 38 signals in the S&P 500 since 1950 did against the base rate and buy and hold.
- Judge a death cross
Death Cross: What 38 S&P 500 Signals Since 1950 Show
How deep the S&P 500 fell after 38 death crosses since 1950, how late the signal comes, and what shorting it on SPY did since 1993.
- Use moving averages
Moving Averages: SMA, EMA and a 76-Year 200-Day Test
SMA, EMA and WMA formulas with a worked example, common periods, and what the 200-day line showed on the S&P 500 since 1950.
- Trail a stop with the Supertrend
Supertrend Indicator: Settings, Strategies and an ETF Test
How the ATR-based line is calculated, common settings, five strategies, and what 654 completed flip trades in SPY, QQQ and GLD since 1993 showed.
- Read the Ichimoku Cloud
Ichimoku Cloud: The Five Lines and a US ETF Test
The five lines and the cloud, how traders read the Tenkan/Kijun cross, and what the cloud and the crosses did in SPY (since 1993), QQQ and GLD.
- Measure trend strength with the ADX
ADX Indicator: What Trend Strength Really Tells You
How +DI, −DI and the ADX are calculated, what 20 and 25 mean, and whether a high ADX meant the trend went on in SPY, QQQ and GLD.
- Read the RSI
RSI Indicator: Formula, Settings and a 75-Year Test
The RSI formula, overbought and oversold, and what RSI signals did on the S&P 500 since 1951 against the base rate.
- Read volatility with Bollinger Bands
Bollinger Bands: Settings, Squeeze and a 76-Year Test
Settings, the three typical chart situations, five strategies with rules, and what the bands and the squeeze showed on the S&P 500 since 1950.
- Set stops with the ATR
ATR Indicator: Average True Range for Stops and Size
True range and Wilder smoothing, stop distance and position size, and how ATR stops behaved on SPY from 1994 to 2026 against a fixed stop.
- Trade Donchian breakouts
Donchian Channel: Breakout Rules and a 20-Year ETF Test
Channel rules, the current-bar pitfall, the Turtle systems, and what 499 breakout trades in SPY, GLD and TLT from 2006 to 2026 showed.
- Judge a divergence
Divergence Trading: Regular and Hidden Divergence Tested
Regular and hidden, bullish and bearish divergences, when they are confirmed, and what 447 RSI divergences detected in SPY, QQQ and GLD did against the base rate.
- Read the MACD
MACD Indicator: Histogram, Divergence and a 31-Year Test
Formula, histogram, crossovers and divergences, with a 31-year test on the S&P 500 and the DAX against the base rate.
- Use VWAP
VWAP Indicator: Formula, Anchored VWAP and TradingView Setup
The VWAP formula, trend day versus range day, Anchored VWAP and the right settings in TradingView.